


 nueva página del texto (beta)
 Inglés (pdf)
 Artículo en XML
 Referencias del artículo
 Enviar artículo por email
 Citado por SciELO
  Similares en
SciELO
Similares en
SciELO 
 Permalink
1. Introduction
Corrosion is a chemical or electrochemical reaction between a metal and its environment that produce degradation of material. There are several kinds of corrosion such as uniform corrosion, galvanic corrosion, crevice corrosion, pitting, intergranular corrosion, etc. Galvanic corrosion happens when a metal or alloy is electrically coupled to another metal in same the environment. There are many methods of corrosion control such as material selection, coatings, inhibitors, and cathodic protection. Corrosion inhibitor is organic or inorganic component that can be added in small amounts to reduce corrosion problems (Khadom, Yaro, AlTaie, & Kadum, 2009a; Khadom, Musa, Kadhum, Mohamad, & Takriff, 2010; Musa, Khadom, Kadhum, Takriff, & Mohamad, 2012). Recently the using of friendly and the natural materials where the aim of researchers that concentrated on studying the kinetics parameters, such as, activation parameters and adsorption behavior of the corrosion inhibition
process (Yaro, Khadom, & Ibraheem, 2011a; Yaro, Khadom, & Wael, 2013; Yaro, Khadom, & Wael, 2014). Application of mathematical modeling was rarely used. Mathematical modeling is a powerful tool for increasing the availability of electrochemical data for a number of materials and environmental systems for industrial applications that enable chemical and materials engineers to predict corrosion potentials and corrosion rates using equations derived from electrochemical principles (Khadom & Yaro, 2011; Khadom, Yaro, Altaie, & Kadhum, 2009b). The present work was a step in the direction of application a mathematical model for galvanic corrosion - saline water - inhibitor system at different operating conditions.
2. Mathematical model
For activation control and to determine the potential of a system, in which the reduced and oxidized species are not at unit activity, the familiar Nernest equation can be employed (Cifuentes, 1987; Fontana, 1987):
or written as:
where E is the equilibrium half-cell potential, E° the standard equilibrium half-cell potential, R is the gas constant (8.314 J/K mol), T is the absolute temperature (K), n is the number of electrons transferred, F the Faraday constant (96,487 coulomb/equiv.), a red and a oxid are activities or (concentrations) of oxidized and reduced species. Hydrogen ion activity is commonly expressed, for convenience, in terms of pH. This is defined as (Uhlig & Revie, 1985):
Hence, for the half-cell reaction
Tafel slopes (Tafel constants) are determined from the following equations (Fontana, 1987):
for anode and cathode reaction, respectively, where α is the symmetry coefficient, which describes the shape of the rate controlling energy barrier. The relationship between reaction rate and overvoltage for activation polarization is:
Where η A isovervoltage, β as before, and i is the rate of oxidation or reduction in terms of current density. This equation is called the Tafel equation. The reaction rate is given by the reaction current or current density, so the high field approximation gives (Uhlig & Revie, 1985):
and
The effect of temperature is to change the value of the exchange current density i o as follows (Uhlig & Revie, 1985):
Corrosion current for anodic reaction rate can be obtained as (Uhlig & Revie, 1985):
and the cathodic one is:
For the case of diffusion control, the reaction current is given by Fick’s law (Liberati, Nogueira, Leonel, & Chateauneuf, 2014):
or its equivalent
The limiting current, i.e. the maximum current under diffusion control is obtained when C s = 0, so
or
where the mass transfer coefficient is defined as
The corrosion current is then
z c is used in Eqs. (15)-(20) because in corrosion processes the cathodic reaction is the one likely to be controlled by diffusion. C b solubility of oxygen in water. The bulk concentration of oxygen changes with pressure, for barometric pressures other than 101.325 kPa (sea level), the bulk concentration of oxygen can be computed from the following equation (Truesdale, Downing, & Lowden, 1955):
where C b is the bulk concentration of oxygen, C 101.325 is a saturation value at 101.325 kPa (tested experimentally, Table 1), P T is total pressure (kPa), p is the vapor pressure of water. The mass transfer coefficient (K) in Eq. (19) varies with the flow or relative speed between metal and the environment, the geometry of the system and the physical properties of the liquid. To calculate the variation of K in dynamic environment, dimensionless group are used such as (Yaro, Al-Jendeel, & Khadom, 2011b):
Table 1 Solubility of oxygen in 1% MgCl2.
| Temperature (°C) | Concentration of inhibitor (ppm) | Solubility of oxygen (mg/l) |
|---|---|---|
| 30 | Blank | 6 |
| 90 | 5.9 | |
| 180 | 5.8 | |
| 270 | 5.8 | |
| 360 | 5.8 | |
| 35 | Blank | 5.8 |
| 90 | 5.6 | |
| 180 | 5.6 | |
| 270 | 5.5 | |
| 360 | 5.5 | |
| 40 | Blank | 5.6 |
| 90 | 4.6 | |
| 180 | 4.6 | |
| 270 | 4.6 | |
| 360 | 4.5 |
All are often applied. For the smooth rotating cylinder electrode, the mass transport correlation is given by Eisenberg, Tobias, and Wilke (1954) relationship applies in the case of turbulent regime.
The value of K from Eqs. (22)-(25) can be expressed as:
This correlation is valid within the following range: 1000 < Re < 100 000 and 850 < Sc < 11 490. The effect of temperature and pressure on diffusion coefficient is shown in the following equation:
where the exponent n varies from 1.75 to 2.0, T o reference temperature in K, D o diffusion coefficient at the reference temperature and pressure, P o reference pressure. For galvanic corrosion under activation control (Hassan, Abdul Kader, & Abdul-Jabbar, 2011) at (E g ):
and
for one metal
for two metals
or in terms of current densities and areas
or
if
for diffusion control (Hassan et al., 2011):
for one metal
for two metals
where f 1 and f 2 are the anodic and cathodic electrode area fractions.
Eq. (47) became
For binary galvanic system under activation control (acidic medium) and mass transfer (diffusion) control (neutral medium), for one metal:
when two metals at (E g ):
3. Experimental work
3.1. Preparation of plant extracts
Fresh Curcuma longa (turmeric) were washed under running water, sliced into small pieces before drying in a hot air oven at 50°C for about 6 h. Dry slice was collected and ground into fine powder using a high-speed blender. The dry, Curcuma longa was packed in a plastic bag, sealed, and kept until used. The slice (25 g) was blended with distilled water (250 ml) in a reflux heater with conical flax (500 ml) for 3 h at 70◦C. The conical flax was supplied with mixer for homogenous solution and uniform temperature distribution. The solution is then cooled, followed by filtration to extract solid particles free inhibitor solution. Each 1cm3 of extract yield a powder 0.0045g of solid material.
3.2. Polarization tests
A total of 90 test runs was carried out in the presence and absence of inhibitor at different experimental conditions using potentiodynamic polarization technique. Tests were carried out using a beaker of 500 ml. The cell containing working electrode, lugging capillary probe, thermometer, counter graphite electrode. All potential values were measured in reference to a saturated calomel electrode (SCE). The lugging capillary prob was adjusted such that it was at a distance not more than 1 mm from the working electrode. The working electrode were 2 samples from carbon steel type (ASTM A 106/A) and copper type (ASTM B-111-443). The working electrode was (2.4 cm outside diameter x 1.35 cm long) carbon steel (type ASTM A 106/A) and copper (type ASTM B-111-443) cylinder; this cylinder was fixed on brass zone on the shaft. Graphite electrode was used as a counter electrode has a dimension of (9.5 cm diameter × 8 cm. long), two wires were connected to a cylindrical concentric graphite electrode. The chemical compositions (% wt) of working electrodes were for steel alloy 0.25%C, 0.5%Mn, 0.025%P, 0.025%S, 0.1%Si, 0.4%Cr, 0.15%Mo, and the balance is Fe. The copper alloy compositions are 70-73%Cu, 0.007%Pb, 0.0006%Fe, 0.001%Sb, 0.0.009%Sn, and the balance is Zn. Mild steel and copper specimens were cleaned using emery paper of grade number 220, 320, 400, and 600, then washed with running tap water followed by distilled water, then dried with a clean tissue, degreased with benzene, dried, degreased with acetone, dried, and finally left in desiccator over silica gel. The electrode was mounted directly to the working electrode. (SCE) was used as a reference electrode. To ensure that KCl solution was saturated, a small amount of KCl (solid) was kept in the solution of (SCE) as long as the test. The cathodic polarization is carried out beginning from the highest negative potential of −900 mV until reaching the corrosion potential. The potential was changed in scan rate of 10-15 mV/min, then the current is recorded. The anodic polarization readings start of a potential resulting in a zero current density and is increased in a step of 10-15 mV with recording of the current at each step for one minute interval until a potential of about −100 mV. The galvanic corrosion rate of steel-copper couple in the absence and presence of inhibitor concentration of 0, 90, 180, 270 and 360 ppm, area ratio of cathode to anode 1:1, at different temperature 30, 35, and 40◦C was evaluated in aerated 1% (wt) MgCl2 and pH 6.
4. Results and discussion
4.1. Electrochemical polarization studies
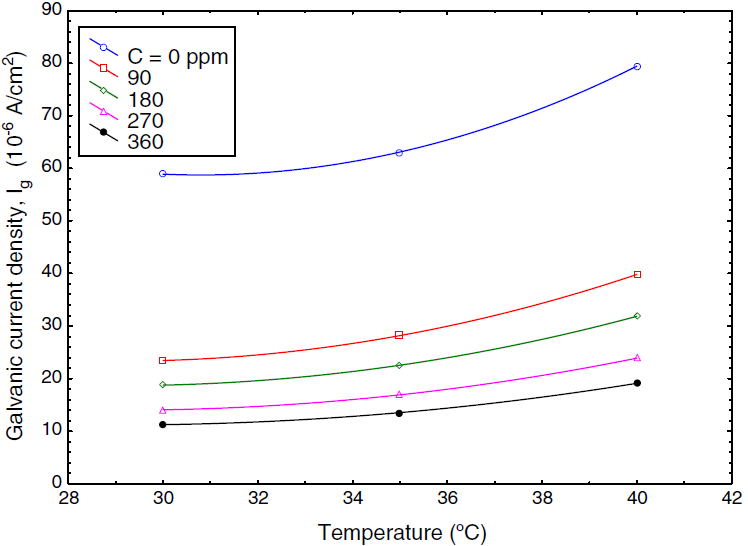
The corrosion behavior of Fe and Cu in 1% MgCl2 solution with and without inhibitor was studied using polarization techniques. The inhibitor was tested in different conditions of temperature, velocity and inhibitor concentration. A total of 90 test runs is carried out. Electrochemical parameters for each metal individually were calculated using polarization curves similar to Figures 1 and 2 that obtained for Fe and Cu in 1% MgCl2 solution. While galvanic parameters were calculated by superimposing the anodic branch of the less noble material (mild steel) to the cathodic branch of the most noble material (copper alloy) as shown in Figure 3. Similar figures are obtained at all operating conditions. From polarization curves, the free corrosion current I corr , corrosion potential E corr , limiting current density, i L , and galvanic corrosion, I g were obtained. A plateau corresponding to a limiting current density (i l ) is observed in the cathodic region of the polarization curves between −800 and −600 mV SCE. Therefore, the cathodic reaction seems to be controlled by diffusion. It was shown that the values of I corr and I g increased with temperature and velocity, while it decreased with inhibitor concentration. Maximum inhibitor efficiency was around 90% at 360 ppm and 30◦C. The average values of inhibitor efficiency were approximately 55, 72, 76, and 83% at inhibitor concentration of 90, 180, 270, and 360 ppm respectively. The increasing in corrosion protection with addition of inhibitor may be attributed to increase in metal surface coverage. Increasing inhibitor concentration beyond 380 ppm may yield further reduction in galvanic corrosion current, but economical considerations have to be taken into account. Figures 4 and 5 show the variation of galvanic corrosion as a function of different operating conditions.
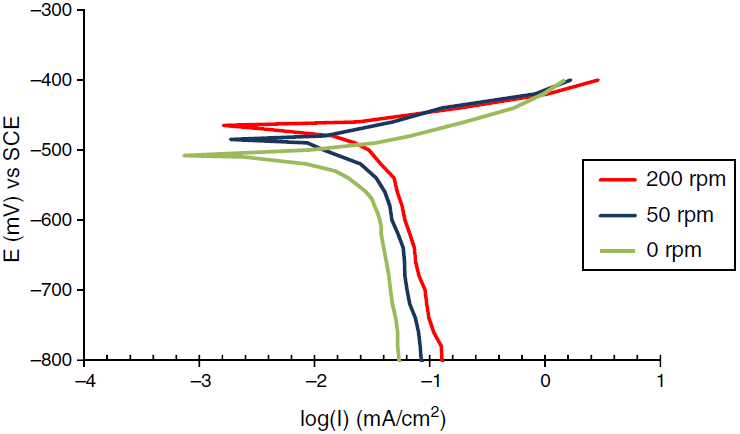
Fig. 1 Polarization curves for the corrosion of Fe in 1% wt MgCl2 at temperature 30°C and different rotation speed.
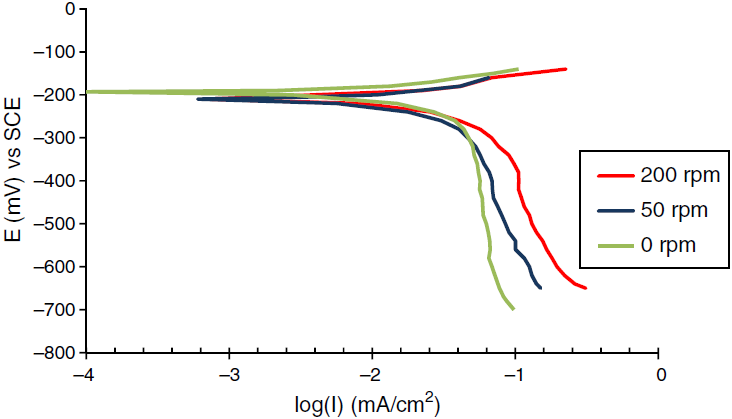
Fig. 2 Polarization curves for the corrosion of Cu in 1% wt MgCl2 at temperature 30°C and different rotation speed.
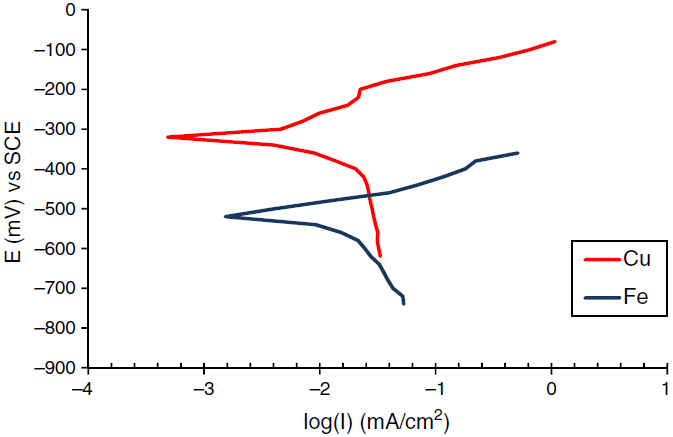
Fig. 3 Polarization curves for the corrosion of Fe-Cu coupling at speed of rotation 50 rpm, temperature 40°C and 180 ppm inhibitor concentration.
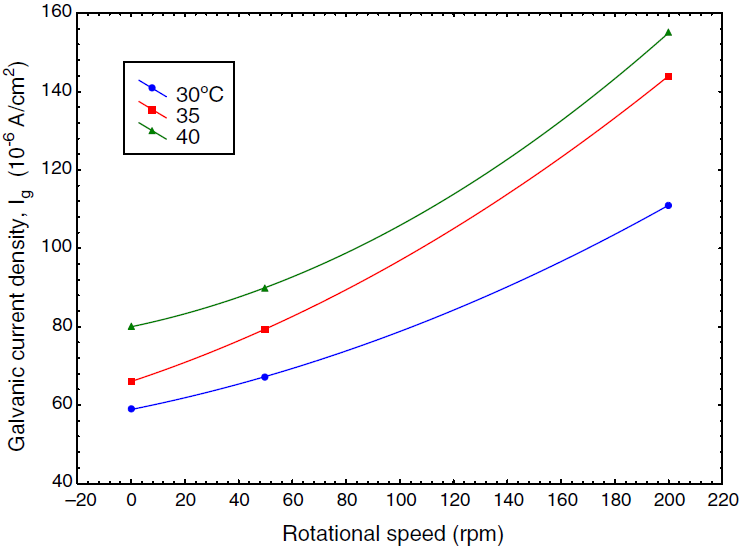
Fig. 4 Galvanic current as a function of speed of rotation at different temperature in absence of inhibitor.
4.2. Theoretical and modeling studies
A mathematical model has been developed based on the ordinary galvanic corrosion model and fluid dynamics analysis model. The calculation is divided into two types. Activation control and mass transfer control. Simplifications leading to analytic solutions of the model equations are so complex, so numerical solutions must be attempted. As an example, a numerical method implemented on a microcomputer. The sweeping method and algorithm are as follows:
Estimate equilibrium potentials for metals and for hydrogen from Eq. (1) at T of 30, 35 and 40°C. For pH values use Eq. (3) to calculate hydrogen ion concentrations.
Tafel slopes for anodic and cathodic reactions are established from Eqs. (4) and (5) at α = 0.5 and T of 30, 35 and 40°C.
The exchange current density is calculated from Eq. (10) for three values of temperatures (30, 35 and 40°C).
Bulk concentration of oxygen in water is calculated from Eq. (21) at different temperatures 30, 35 and 40°C, by using, Table 1.
The value of oxygen diffusivity is estimated from Eq. (27) at different temperatures 30, 35 and 40◦C. The mass transfer coefficient K is calculated by using Eq. (26).
The limiting current is estimated from Eq. (20) at different temperatures 30, 35 and 40°C.
It is necessary to realize that the galvanic corrosion potentials (E g ) of the reactions involved are chosen between the more negative (or less positive) equilibrium potential of the metals and the equilibrium potential of hydrogen evolution.
The values of E eq , β, i o , E g (=E a = E c ) are substituted in Eqs. (11) and (13) to determine anodic and cathodic currents.
For activation control:
The summations of the anodic and cathodic currents are compared to determine the absolute value of their difference.
A new value of E g is assumed as in step 8 and the program is executed again, showing the difference between the summation of the anodic and cathodic currents to decrease
Step 11 is repeated until a minimum difference current is found. The minimum will be detected when the sweeping procedure goes beyond the true galvanic potential value as the difference starts increasing. The precision will be greater the smaller the potential step while the processing time will increase accordingly.
For mass transfer control:
The difference between the summation of the anodic currents and limiting currents, Eq. (42), are calculated and compared to determine the absolute value of their difference.
A new value of E g is assumed as in step 8 and the program is executed again, showing the difference between the summation of the anodic and limiting currents to decrease
Step 11 is repeated until a minimum difference is found. The minimum will be detected when the sweeping procedure goes beyond the true galvanic potential value as the difference starts increasing. The precision will be greater the smaller the potential step while the processing time will increase accordingly.
For cathode reaction under activation control complicit with mass transfer:
The difference between the summation of the anodic and cathodic currents and limiting currents Eq. (49), are calculated and compared to determine the absolute value of their difference.
A new value of E g is assumed as in step 8 and the program is executed again, showing the difference between the summation of the anodic and cathodic currents and limiting currents to decrease
Step 11 is repeated until a minimum difference is found. The minimum will be detected when the sweeping procedure goes beyond the true galvanic potential value as the difference starts increasing. The precision will be greater the smaller the potential step while the processing time will increase accordingly.
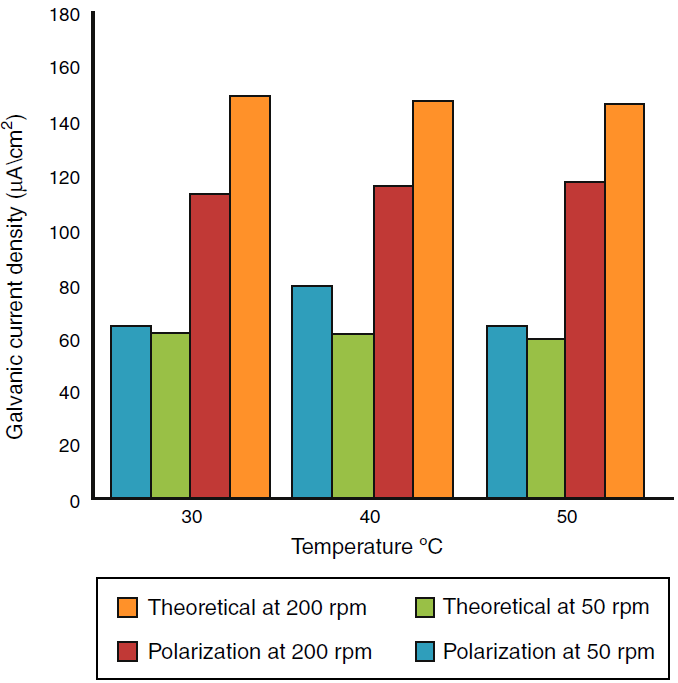
A program written in Microsoft Excel 2010 for free corrosion rate of single metal and binary galvanic system under activation control (acidic medium) and mass transfer (diffusion) control (neutral medium) and also to calculate the galvanic corrosion rate when the system is under both activation and mass transfer control. Table 2 that show the effect of temperature on the corrosion current and corrosion potential of copper and iron, limiting current was calculated from Eq. (44), corrosion current of metals were calculated from Eq. (53). Figures 6 and 7 show a comparison of the galvanic current density obtain from polarization curve and theoretical calculation. Figures 8 and 9 show a comparison of the galvanic current density obtain from polarization curve, weight loss and theoretical calculation.
Table 2 Galvanic corrosion of Cu/Fe couple versus temperature under the following conditions: [Fe2+]= [Zn2+] = 10-6 M, f Fe = 0.5, f Zn = 0.5, alpha of H =0.5, alpha of Cu = Fe = 0.5.
| T(°C) | rpm | E g (mV) | I Cu ((A/cm2) | I Fe(μA/cm2) |
|
|
I Limining (μA/cm2) |
| 30 | 0 | -0.79537 | 1.094E-11 | 57.332 | 3.23710 | 0.9141 | 53.1813 |
| 35 | -0.83150 | 2.555E-12 | 59.644 | 1.91495 | 1.1058 | 56.6239 | |
| 40 | -0.83578 | 8.056E-12 | 66.779 | 1.71268 | 0.8241 | 64.2429 | |
| 30 | 50 | -0.82944 | 2.062E-12 | 65.240 | 4.25687 | 1.7317 | 59.2514 |
| 35 | -0.83656 | 2.957E-12 | 64.116 | 3.31561 | 1.1878 | 59.6125 | |
| 40 | -0.83968 | 9.196E-12 | 62.836 | 1.45716 | 0.8992 | 60.4799 | |
| 30 | 200 | -0.79930 | 7.466E-12 | 158.870 | 1.59136 | 0.8795 | 156.399 |
| 35 | -0.80699 | 1.663E-11 | 159.46 | 1.48002 | 0.6337 | 157.352 | |
| 40 | -0.81276 | 3.079E-11 | 160.84 | 0.72399 | 0.4773 | 159.642 |
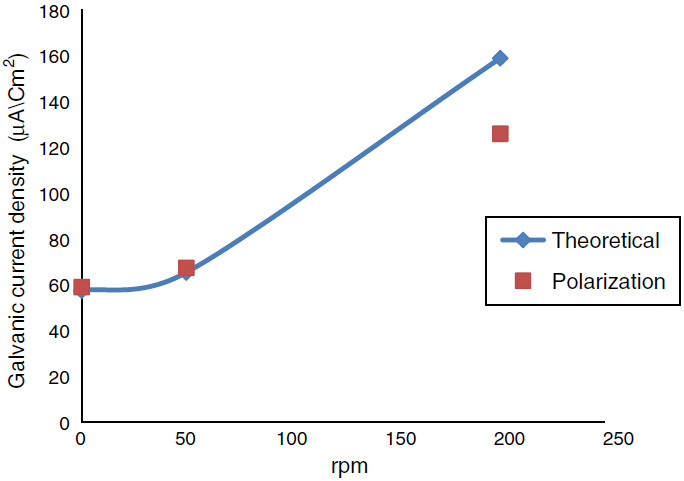
Fig. 6 Comparison of the galvanic current density obtains from polarization curve and theoretical calculation at temperature 30° C different rpm.
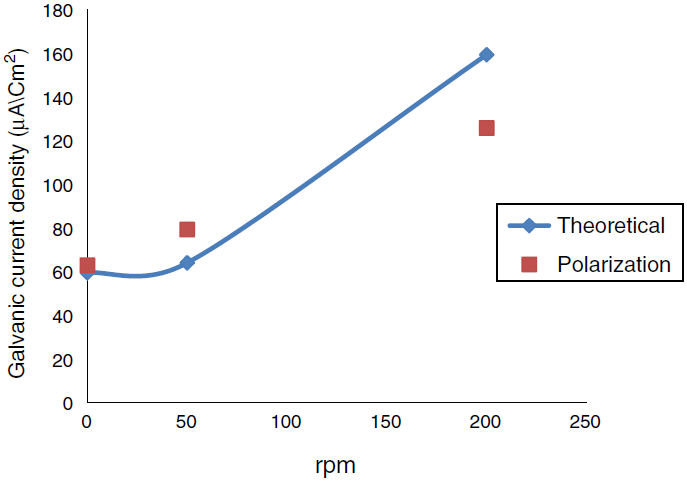
Fig. 7 Comparison of the galvanic current density obtains from polarization curve and theoretical calculation at temperature 35° C different rpm.
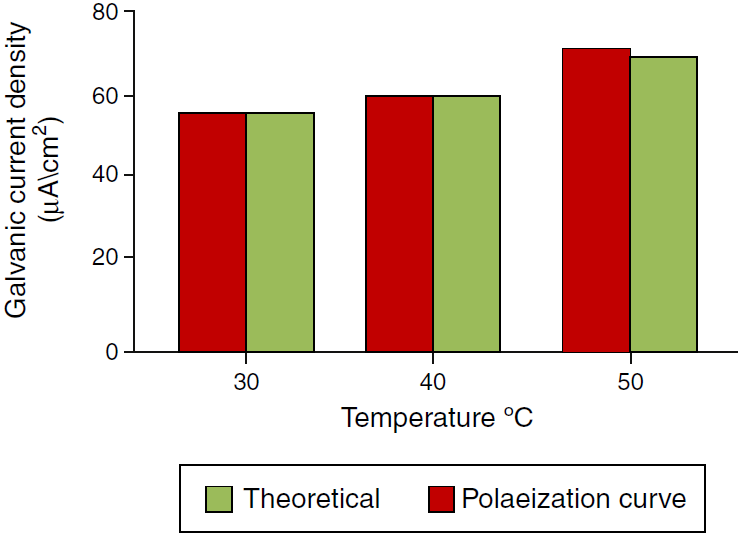
Fig. 8 Comparison of the galvanic current density obtains from polarization curve, weight loss and theoretical calculation at different temperature.
5. Conclusion
Galvanic current and the corrosion current densities increase with increasing temperature and velocity, and decrease with increasing inhibitor concentrations. The addition of inhibitor reduced the galvanic corrosion current. A mathematical model equation was very effective tool to analyze the shape of polarization curves. Theoretical results agreed with experimental one.

