


 nova página do texto(beta)
 Inglês (pdf)
 Artigo em XML
 Referências do artigo
 Enviar este artigo por email
 Citado por SciELO
  Similares em
SciELO
Similares em
SciELO 
 Permalink
1. Introduction
Clays are generally termed as aluminosilicates and they have a definite crystalline structure. They contain aluminum oxide and silicon dioxide as universal minerals and clays were classified into phyllosilicates and layers silicates (Bailey & Brindley, 1979). They are composed principally of silica, alumina and water often with iron, alkali or alkaline earth metals (Nguetnkam, Kamga, Villiéras, Ekodeck, & Yvon, 2008).
Pottery has been the focus of research from a variety of disciplinary perspectives, including archeology, for numerous reasons. Pottery has been produced by humans since at least 10,000 BC, usually by those living in sedentary communities. Because it is non-perishable, it tends to be preserved in the archeological record. Moreover, pottery was used by people throughout society, not being restricted to the upper stratum. It was also used in varied contexts: from a daily residential use to a more specialized one, such as mortuary purposes. Because of its plasticity as a raw material, clay could be formed into a number of different shapes, thus ceramics was used for a myriad of functions. Ceramics is related to the most ubiquitous artifact class, the majority of which comprises vessels and shards (fragments of vessels).
Nowadays, a multidisciplinary approach is being practiced in most of the areas of research to have comprehensive information. It is particularly useful in the archeological investigations as it is the combination of arts and science. Infrared absorption by a mineral arises from the vibrations of its constituent atoms, and the frequencies of these vibrations are dependent on the mass of the atoms, the restraining forces of the bonds, and the geometry of the structure. Infrared (IR) spectroscopy has a long and successful history as an analytical technique and is used extensively (McKelvy et al., 1996; Stuart, 1996). It is mainly a complementary method of X-ray diffraction (XRD) and other methods used to investigate clays and clay minerals. X-ray powder diffraction patterns (XRD) are to define homogeneous groups of clay based materials according to their mineralogical composition. Qualitative mineralogy of the studied samples is determined with the standard interpretation procedures of XRD. The examination of fresh-fractured surfaces of ceramic samples under the scanning electron microscope (SEM) provides information on the surface morphology of the clays developed during firing and the degree of vitrification (Maniatis & Tite, 1978, 1981). This information combined with known morphologies of clays and pottery or by refiring samples from the terracotta in the laboratory and re-examination with the SEM leads to the determination of the firing temperatures used in antiquity. Provenance is normally assessed by elemental analyses using EDS (Ravisankar et al., 2014).
The provenance studies are carried out in two ways using physical and chemical methods. Physical methods explain the size, shape and surface decoration of artifacts and reflect the ancient cultures (Shepard, 1980; Tykot, 2004). Similarly, the chemical methods are used for the identification of trace, minor and major elemental composition of artifacts. Elemental composition plays an important role to provide the provenance studies, using archeological artifacts. Alkali, alkaline earth elements and rare earth elements (REEs) are used for grouping the archeological artifacts (Beal & Olmez, 1997; IAEA, 2003). Elemental concentration data in conjunction with statistical analysis methods like factor analysis and/or cluster analysis are used extensively for grouping/provenance study of clay ceramics (Neff, 2000; Tykot, 2004). These chemometric analyses are helpful to find the similarities between the samples, which give meaningful interpretation to archeological studies (Glascock, Braswell, & Cobean, 1998; Oliveira, Munita, & Hazenfratz, 2010). Thus, the statistical analyses were performed for grouping of artifacts by using the WINSTAT and SPSS software packages respectively.
2. Materials and methods
2.1. Site details - Arpakkam (12°49′N 79°42′E)
Arpakkam is a village panchayat located in Kanchipuram district of Tamil Nadu state, India. The Arpakkam site map is shown in Figure 1 and the photograph of samples is shown in Figure 2. This place is located in between two rivers, namely, Cheyyar and Palar. The places around Arpakkam, Kanchipuram, Mamallapuram and Uttiramerur are archeologically very significant for their Pallava rock cuts, structural temples, and epigraphical remains. It is a known fact that Kanchipuram and Mamallapuram were the political capital and port city of the Pallavas respectively, while the existence of a well-established electoral system is endorsed in lithic record at Uttiramerur. Apart from these, the region is studded with many Jaina centers with natural caverns once inhabited by Jaina monks, containing stone beds and Brahmi inscriptions datable to the early centuries of the Christian era (Mahadevan, 1994). From the epigraphical records, it is gleaned that Arpakkam was formed part of Magaralnadu of Eyil Kottam in Tondaimandalam. Arpakkam was a hub of Buddhism, Jainism, Saivism and Vaishnavism by 10th century A.D. in this microregion.

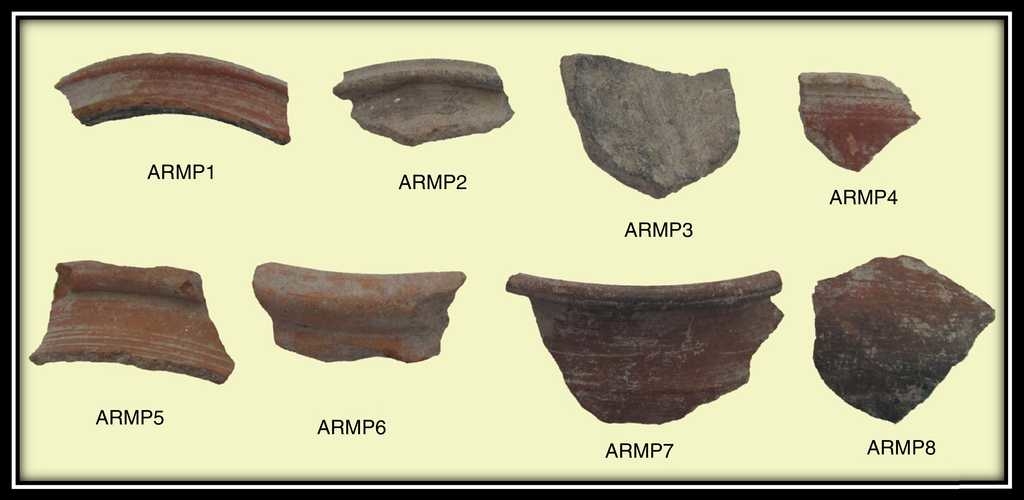
During the course of the exploration undertaken in the village, the presence of burial urns in the north and north western parts of the present village proper was observed. Very near to the burial site, in recent years a dwelling site was identified by the Department of Ancient history and Archeology during its further intensive survey. The archeological mound rising to a height of nearly two meters was traced. In the surface of the mound, plenty of all black ware, black and red ware and red slipped ware shards in different shapes were collected. Moreover, a few terracotta objects and beads were also collected. The presence of pot shards coupled with other artifacts would very well endorse that the archeological mound would contain cultural properties, which would help in tracing the material history of the ancient Tamils. Furthermore, they are two of the few burial and dwelling sites located side by side for a comparative study.
2.2. Fourier transform infrared spectroscopy (FT-IR)
FT-IR spectra were recorded in the mid infrared region (4000-400 cm−1) in an evacuated chamber of a Bruker Tensor 27 spectrometer using KBr discs as matrices. The spectral resolution is of ±2 cm−1 and the spectra were accumulated over 16 scans. The FT-IR spectroscopy was applied for all the samples. The sample was mixed with KBr in the ratio of 1:20. At first, the sample was crushed and ground with KBr. The mixture of the ground sample and KBr was pelletized as a disk. The fitting of peaks and smoothing were done with the OPUS 6.5 software in the instrument over the working window.
2.3. X-ray diffraction (XRD)
For the X-ray diffraction analysis, a small fragment of the specimen of about 0.2 g of the sample was ground manually using an agate mortar. Thirty milligrams of the powdered sample were homogeneously dispersed on a cover glass which was served as a sample holder in the X-ray diffractometer. Subsequently, the X-ray diffraction patterns were obtained at ambient temperature with a Rigaku miniflex II diffractometer using CuKα radiation of λ = 1.5406 Å. Diffraction patterns were recorded at 2θ angles in the range of 20-70°.
2.4. Scanning electron microscopy and energy dispersive spectroscopy (SEM-EDS)
The samples were prepared for the SEM analysis by simply cracking the artifact (fresh fractures) and then coated with a thin gold layer in order to obtain a conductive surface. A very narrow beam of electrons is scanned rapidly back and forth across the sample. As electrons hit the sample, some were scattered back from the surface, and low-energy electrons were also knocked out of the sample. These back-scattered and secondary electrons were converted into electronic signals which give rise to images of the area scanned on a display monitor.
The morphological investigations were undertaken on a JEOL, JSM-6390 scanning electron microscope at an accelerating voltage of 20 kV and a beam current of 1-3 nA. SEM images were obtained by either secondary electrons (SE) or back-scattered electrons (BSE). The instrument was equipped with an energy dispersive spectrometer (EDS) system, for the analysis of the X-rays emitted by the sample to determine the elemental composition for elemental identification during SEM observations. Pure element oxides and natural minerals were used as standards for the quantitative analysis.
2.5. Chemometric analysis - software details
The statistical methods such as cluster analysis (CA) and factor analysis (FA) were performed with the help of the WINSTAT Excel and SPSS 16.0 software packages, respectively. Factor analysis and the cluster analysis are a common approach used as a tool to examine graphically the grouping pattern of the samples in terms of chemical composition. The auto-scaling procedure had been performed to carryout multivariate statistical analysis on the data. In the cluster analysis, simple linkage and Euclidean distance were used to grouping the artifacts.
3. Results and discussion
3.1. Fourier transform infrared (FT-IR) Analysis
FT-IR spectra of the samples collected from Arpakkam site are shown in Figure 3. To provide adequate identification of a clay mineral by infrared spectroscopy, the spectra were recorded. Absorption bands of adsorbed water molecules appeared at 3400 and 1630 cm−1 and C-H absorption bands at 2850-2960 cm−1, which arise from organic contaminants. The identification of clay minerals by FT-IR spectroscopy is greatly promoted by reference spectra (Farmer, 1968).
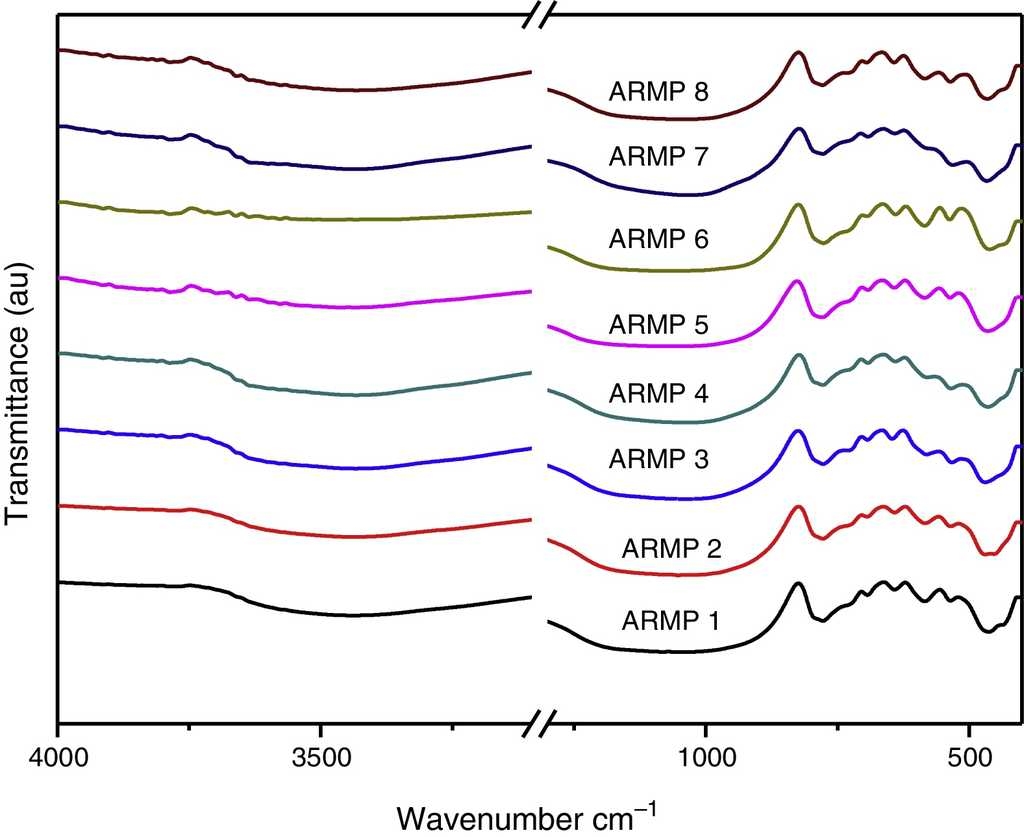
In the 1100-400 cm−1 regions, vibrational bands corresponding to Si-O, Si-O-Si, Al-O and Al-Si-O were detected in all of the samples. These vibrational bands could be attributed to the feldspars and quartz. Quartz was observed through the appearance of the bands at around 776 and 694 cm−1 whereas the weak Al-O-Si stretching of feldspar in all the pot shards was indicated the presence of the absorption peaks in the range of 641-646 cm−1. Very weak calcite bands (around 1880 and 1785 cm−1) were present in all the samples (Seetha & Velraj, 2015). The maximum of the Si-O band changed systematically with the firing temperature of the clay and the main Si-O stretching bands were located at about 1035-1084 cm−1 (Table 1). According to Shoval (1994), a single peak with the maximum of 1042 cm−1 was found at 700 °C. In 800 °C, the band split and two maxima appeared at 1050 cm−1 and 1078 cm−1 respectively. A single band was observed at 1082 cm−1 at 900 °C. Hence, samples ARMP3, ARMP4, ARMP7 and ARMP8 exhibiting a ν (Si-O) band around 1036-1045 cm−1 suggest that the firing temperature was in the range of 700-800 °C (<800 °C) (Damjanović et al., 2011). Conversely, the absorption spectra of Si-O band of the remaining antique relics observed at 1051, 1052, 1080 and 1084 cm−1 for ARMP1, ARMP2, ARMP5 and ARMP6 respectively, indicates the firing temperature at 900 °C or even higher (>800 °C). The estimated firing temperature and prevailed atmospheric conditions are given in Table 2.
Table 1 Tentative vibrational assignments using FT-IR absorption frequencies (cm−1) and relative intensities of ancient ARMP pot shards.
| FT-IR absorption bands in wave number (cm−1) with relative intensities | Tentative vibrational assignments | |||||||
|---|---|---|---|---|---|---|---|---|
| ARMP1 | ARMP2 | ARMP3 | ARMP4 | ARMP5 | ARMP6 | ARMP7 | ARMP8 | |
| 3435M | 3433M | 3433M | 3433S | 3434M | 3433W | 3433S | 3432S | O-H str. of adsorbed water |
| - | - | - | - | - | 2928W | C-H str. of organic contaminants | ||
| 1880VW | 1881VW | 1881VW | 1880VW | 1880VW | 1880VW | 1880VW | 1880VW | C-O str. of calcite |
| 1785VW | - | - | - | - | - | - | - | C-O str. of calcite |
| 1627W | 1632W | 1633W | 1634W | 1625W | 1644W | 1633W | 1632W | H-O-H bending of adsorbed water |
| - | - | - | - | 1084VS | 1080VS | - | - | Al-Si-O str. of amorphous aluminosilicates |
| 1051VS | 1052VS | 1045VS | 1041VS | - | - | - | 1043VS | Si-O str. of clay minerals |
| - | - | - | - | - | - | 1036VS | - | Si-O str. of clay minerals |
| 778M | 778M | 777M | 778M | 779M | 776S | 778M | 778S | Si-O symmetrical str. of quartz |
| 693W | 694VW | 693W | 692VW | 692VW | 694VW | 692W | 694VW | Si-O symmetrical str. of quartz |
| 641VW | 642W | 646VW | 640W | 642VW | 638VW | 642W | 643VW | Al-O-Si str. of feldspar |
| 584W | 584W | 581W | 580W | 584W | 584W | - | 584M | Fe-O bend of magnetite |
| 535W | 535W | 533M | 534M | 536W | 537W | 531M | 536M | Fe-O bend of hematite |
| 463S | 469S | 470S | 466S | 464S | 461S | 466S | 465S | Si-O-Si bending of silicates |
VS - very strong, S - strong, M - medium, W - weak, VW - very weak.
Table 2 Estimated firing temperature and prevailed atmosphere conditions of ARMP pot shards.
| Sample codes | Octahedral sheet structure (Band at 1100 and 915 cm−1) | Position of the silicate band (cm−1) | Estimated firing temperature (°C) | Existence of iron compounds | Firing atmosphere prevailed |
|---|---|---|---|---|---|
| ARMP1 | Disappeared | 1051 | >800 | Hematite/magnetite | Oxidizing |
| ARMP2 | Disappeared | 1052 | >800 | Hematite/magnetite | Oxidizing |
| ARMP3 | Disappeared | 1045 | <800 | Hematite/magnetite | Reduction |
| ARMP4 | Disappeared | 1041 | <800 | Hematite/magnetite | Oxidizing |
| ARMP5 | Disappeared | 1084 | >900 | Hematite/magnetite | Oxidizing |
| ARMP6 | Disappeared | 1080 | >900 | Hematite/magnetite | Oxidizing |
| ARMP7 | Disappeared | 1036 | <800 | Hematite/magnetite | Oxidizing |
| ARMP8 | Disappeared | 1043 | <800 | Hematite/magnetite | Reduction |
The FT-IR spectra showed absorption bands of 466 cm−1, 535 cm−1 and 584 cm−1 (Fig. 3) are due to Si-O-Si bending of silicates, Fe-O bending of hematite and magnetite respectively. The higher amount of magnetite represents a reducing atmosphere and the higher amount of hematite indicates an oxidizing atmosphere. The concentration ratio of iron oxides (Fe3O4/Fe2O3) determined the prevailed firing atmosphere during the production of relics and was determined by the I /I 0 method (Seetha & Velraj, 2015). If the intensity ratio of magnetite and hematite is less than one (I /I 0 < 1), thereby contains a high amount of hematite or otherwise (I /I 0 > 1) it contains a high amount of magnetite. This suggests that these relics might have been fired in the open air (oxidizing atmosphere) and closed kiln (reducing atmosphere). From these results (Table 2), it can be determined that the artisans of Arpakkam were well aware of both the techniques of firing the potteries in oxidizing and reducing atmospheres and that the samples might have been fired to the temperature around and below 800 °C. The identification of clay minerals by FT-IR were complemented with the XRD analysis and were confirmed. According to Tite (1995), the firing temperature in the open air can change rapidly from reducing to oxidizing atmosphere subject to fluctuations in wind flow and weather. And the artifacts are very rarely fully oxidized due to the insufficient firing time for organic material within the clay to be burnt out. As discussed by Pavía (2006), color is temperature dependent: increasing the temperature turns the clay a shade of red and latterly darkens the color. At 700 °C and 800 °C, the clay displays an orange to light red color, whereas above 900 °C, it turns a deeper red color.
3.2. X-ray diffraction (XRD)
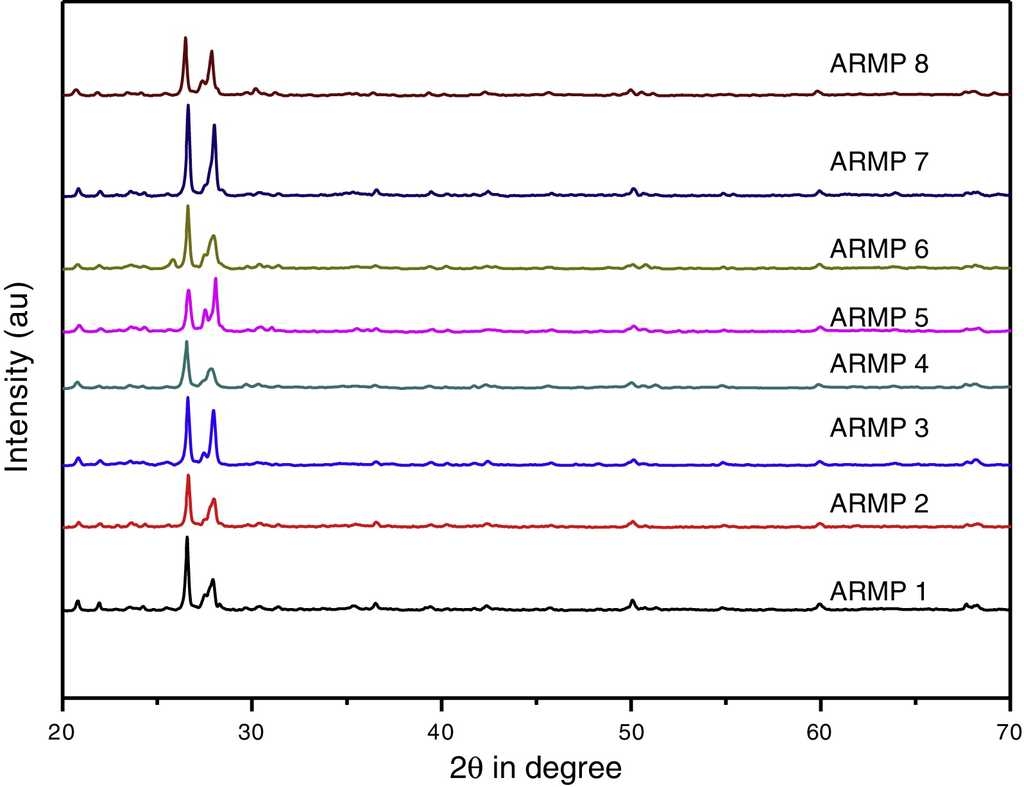
In order to identify clay minerals, the X-ray diffractograms were recorded in 2θ range of 20-70°. Identification of crystalline minerals was carried out using the Joint Committee of Powder Diffraction Standards (JCPDS, 2003) data bank. Table 3 includes a summary of the mineral assemblage of the pottery samples and the corresponding diffraction patterns are shown in Figure 4. Quartz and albite are major constituents in the selected samples, whereas iron oxides such as hematite and magnetite are also present in all the samples. Calcite, bytownite, orthoclase, illite, muscovite, high-temperature silica probably microcline and mullite were occasionally recorded.
Table 3 Mineral phases obtained by XRD analysis.
| Minerals | ARMP1 | ARMP2 | ARMP3 | ARMP4 | ARMP5 | ARMP6 | ARMP7 | ARMP8 |
|---|---|---|---|---|---|---|---|---|
| Quartz | + | + | + | + | + | + | + | + |
| Albite | + | + | + | + | + | + | + | + |
| Microcline | − | − | − | − | + | − | − | − |
| Calcite | + | + | + | + | + | − | + | + |
| Magnetite | + | + | + | + | + | + | + | + |
| Hematite | + | − | + | + | − | + | + | − |
| Illite | − | − | − | − | − | + | + | − |
| Orthoclase | − | + | + | + | + | + | + | − |
| Mullite | − | − | − | − | + | − | − | − |
| Bytownite | + | + | − | + | − | − | − | + |
| Muscovite | − | − | − | − | − | + | − | − |
| Dolomite | + | − | + | + | + | + | − | + |
| Dickite | − | − | + | − | − | + | − | − |
+ = present; - = absent.
The mineralogy of the samples reveals that clay is predominantly non-calcareous and it is inveterated by the EDS analysis. However, the pottery occasionally contains traces of primary calcite only in few of the samples. The presence of some of the minerals is a clear indication of the firing temperature. According to Peters and Iberg (1978) and Maggetti (1982), calcite decomposes at approximately 600-850 °C in natural clay, and calcium silicates (diopside-wollastonite) appear in the range 850-900 °C. But in the present work, calcite was present in few of the samples and there was an absence of secondary calcium silicates which indicates that the pottery clay samples were non-calcareous in nature.
The presence of minerals such as quartz (PDF No. 891961) at 3.35, 1.82, 2.46, 4.28, 1.38, 1.53 Å, hematite (PDF No. 898104) at 1.69, 1.83 Å and magnetite (PDF No. 893854) at 2.95, 2.54, 1.45 Å were verified with the corresponding standard data set. The high temperature mineral phase microcline (3.72, 3.45, 4.22 Å) (PDF No. 831604) and mullite (2.21 Å) (PDF No. 831881) were obtained from shards ARMP5 and ARMP6. Conversely, the remaining relics ARMP1, ARMP2, ARMP3, ARMP4, ARMP7 and ARMP8 contained low firing temperature mineral, such as calcite with a less intense peak. The existence of Illite (PDF No. 310968) is typically represented by a peak appearing at 2.21 Å. The presence of illite/muscovite indicates that the firing temperature was lower than 900 °C (Franquelo et al., 2008), whereas the presence of hematite indicates a firing temperature of about 850 °C (Cardiano et al., 2004). This agrees with the firing experiments, which demonstrated that increasing the temperature turns the clay a darker shade of red (above 800 °C). The calcite peaks 2.28, 1.98, 3.01 Å were almost observed in all the samples except in ARMP6. Nevertheles, from the FT-IR results, the weak calcite band was present in all the samples. This may be due to the poor crystallinity of calcite. The feldspar group mineral has similar characteristics because of a similar structure. The alkali feldspars group minerals orthoclase (2.13 Å) and anorthoclase (3.25 Å) were present in few of the samples. The plagioclase feldspar group minerals albite (3.18, 4.04, 3.21 Å) (PDF No. 898575) was abundant in all samples and bytownite (3.77 Å) was present in some of the samples (Table 3).
3.3. Scanning electron microscopy and energy dispersive spectroscopy (SEM-EDS) Analysis
In order to estimate the firing temperature, scanning electron microscopy has long been used to characterize the morphology and degree of vitrification of archeological ceramics (Tite, Freestone, Meeks, & Bimson, 1982). The degree of particle interconnection is important, which suggests an increase in the firing temperature. Firing in a reducing atmosphere, as compared to an oxidizing atmosphere, resulted in the lowering of the temperatures at which the various vitrification structures formed at about 50 °C. The micro morphology and EDS spectra of the selected pot shards are shown in Figure 5. Concentrations of major elements and trace elements are displayed in Table 4.
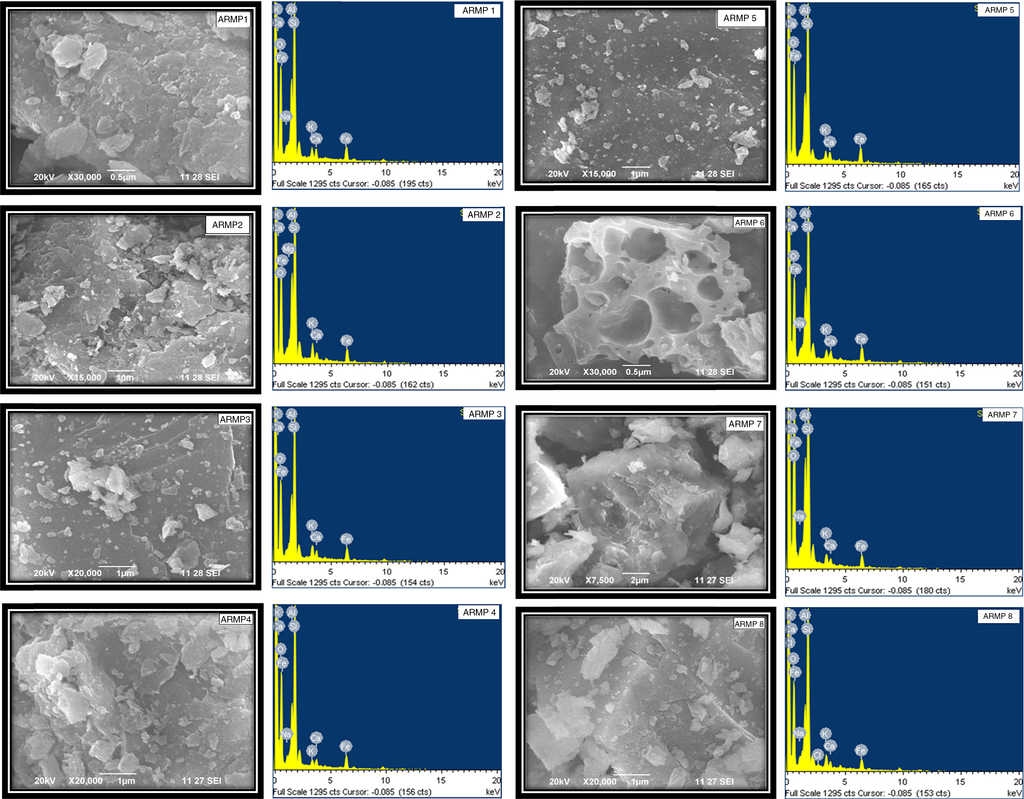
Table 4 Elemental concentrations (EDS) of ARMP pot shards.
| Name of the elements | Elemental composition - wt (%) | |||||||
|---|---|---|---|---|---|---|---|---|
| ARMP1 | ARMP2 | ARMP3 | ARMP4 | ARMP5 | ARMP6 | ARMP7 | ARMP8 | |
| O | 51.00 | 50.39 | 52.17 | 54.33 | 53.60 | 50.31 | 57.28 | 52.17 |
| Na | 1.60 | 1.31 | - | 1.31 | - | 1.59 | 1.34 | 1.63 |
| Al | 9.55 | 10.02 | 9.09 | 7.51 | 8.47 | 9.00 | 8.91 | 7.55 |
| Si | 26.70 | 27.24 | 26.11 | 26.85 | 27.02 | 26.58 | 25.36 | 27.42 |
| Cl | - | - | - | - | - | - | - | 0.69 |
| K | 1.95 | 3.03 | 3.10 | 1.62 | 1.75 | 2.24 | 1.58 | 2.86 |
| Ca | 2.17 | 1.40 | 1.67 | 1.57 | 1.66 | 1.94 | 1.06 | 1.73 |
| Fe | 7.04 | 6.61 | 7.86 | 6.81 | 7.48 | 8.35 | 4.46 | 5.95 |
In the present work, the isolated smooth-surface areas or filaments of glass in some of the samples (ARMP1-ARMP4) were appeared. According to Maniatis and Tite (1981), this structure, which is referred to as the initial vitrification stage, was similar for both the non-calcareous and calcareous clays and it was developed typically at firing temperatures in the 800-850 °C range in an oxidizing atmosphere. The isolated glassy areas of the stage increase until they coalesce to form an essentially continuous vitrified layer, which is known as the continuous vitrification stage appearing in ARMP5. In order for continuous vitrification (CV) to occur, the firing temperature of the sample may be below 1000 °C. Some fractures display continuous glass and bloating pores, indicating strong vitrification. Pottery sample ARMP6 includes glassy areas associated with medium pores CV (MB), which are formed throughout the pottery body at about 1050 -1100 °C (Maniatis & Tite, 1981). In some cases, it was possible to recognize a slightly earlier stage in the development of vitrification in which there was no definite smooth-surface areas of glass but some slight buckling and rounding of the edges of the clay plates. This structure is represented by no vitrification (NV), which appeared in ARMP7 and ARMP8. The incomplete dehydroxylation exhibited by these samples in the FT-IR study further support that the firing temperature was below 750 °C. The clay types and vitrification stage with corresponding firing temperature are depicted in Table 5.
Table 5 Vitrification stages and firing temperature ranges of ARMP pot shards.
| Shards code | CaO% | Clay type | Vitrification stage | Firing temperature (°C) |
|---|---|---|---|---|
| ARMP1 | 3.04 | NC | IV | <750 |
| ARMP2 | 1.96 | NC | IV | 800-850 |
| ARMP3 | 2.34 | NC | IV | 800-850 |
| ARMP4 | 2.10 | NC | IV | 800-850 |
| ARMP5 | 2.32 | NC | CV | <1000 |
| ARMP6 | 2.71 | NC | CV(CB) | 1050-1100 |
| ARMP7 | 1.48 | NC | NV | 800-850 |
| ARMP8 | 2.42 | NC | NV | <750 |
Calcium is an essential nutrient that plays an important role in determining the physical and chemical characteristics of soil. Clays can be divided into two main types such as non-calcareous (CaO < 6%) and calcareous (CaO > 6%). From the EDS data, it should be noted that all the samples analyzed were non-calcareous (concentration of CaO less than 6%) (Musthafa, Janaki, & Velraj, 2010; Velraj, Janaki, Musthafa, & Palanivel, 2009).
3.4. Chemometric analysis
The statistical analysis such as cluster analysis (CA) and factor analysis (FA) were performed for the grouping of artifacts with the win STAT and SPSS software packages. Elements O, Na, Al, Si, K, Ca, Cl and Fe present in the selected pot shards were used for the chemometric analysis.
A factor analysis (FA) as a data reduction technique was performed in two steps which included the extraction and rotation of factors. The FA can be expressed as (Zarei & Bilondi, 2013),
 (1)
(1)
where, z is the component score, a is the component loading, f is the factor score, e is the residual term accounting for errors or other sources of variation, i is the sample number and m is the total number of variables.
The rotated component matrix values of 7 elements presented in the selected samples are given in Table 6. As shown in this table, factor 1 explains 37.91% of the total variance in the data set due to high positive loadings of elements Si, Ca and Fe, whereas factor 2 explains the high positive loadings of elements Al and K and the total variance is 23.41%. Finally, factor 3 explains the total variance is about 18.04% and the high positive element is Na. There are three factors extracted from the data set and the total variance is 79.45%. According to this, the total variance is more than 50% which reveals that the principle component (PC) fit to the data set is good. In addition, the factor score was obtained for the grouping of artifacts. From the FA analysis, two groups of samples were identified: group I consisting of elements Si, Ca and Fe, and group II containing Al and K. Figure 6 and 7 show the bivariate plot of three principal component scores.
Table 6 Factor analysis of ARMP pot shards.
| Variables | Factor 1 | Factor 2 | Factor 3 |
|---|---|---|---|
| O | −0.804 | −0.587 | −0.067 |
| Si | 0.787 | −0.051 | 0.235 |
| Ca | 0.850 | 0.049 | −0.057 |
| Fe | 0.735 | 0.201 | −0.555 |
| Al | −0.147 | 0.886 | −0.067 |
| K | 0.307 | 0.682 | −0.010 |
| Na | 0.098 | −0.007 | 0.942 |
| % of variance explained | 37.907 | 23.407 | 18.041 |
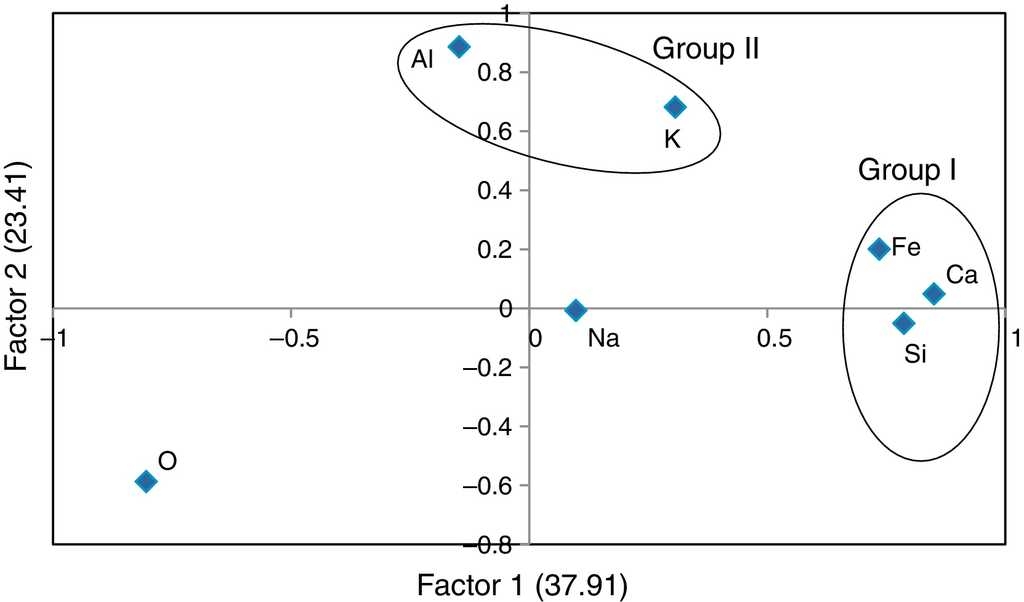

In the cluster analysis, simple linkage methods and Euclidean distance were used and two groups were obtained: (i) ARMP1-ARMP3, ARMP5-ARMP7 (ii) ARMP4, ARMP8. The dendrogram of Arpakkam pot shards, shown in Figure 8, shows that the two groups of samples in the selected site are in good agreement with FA.

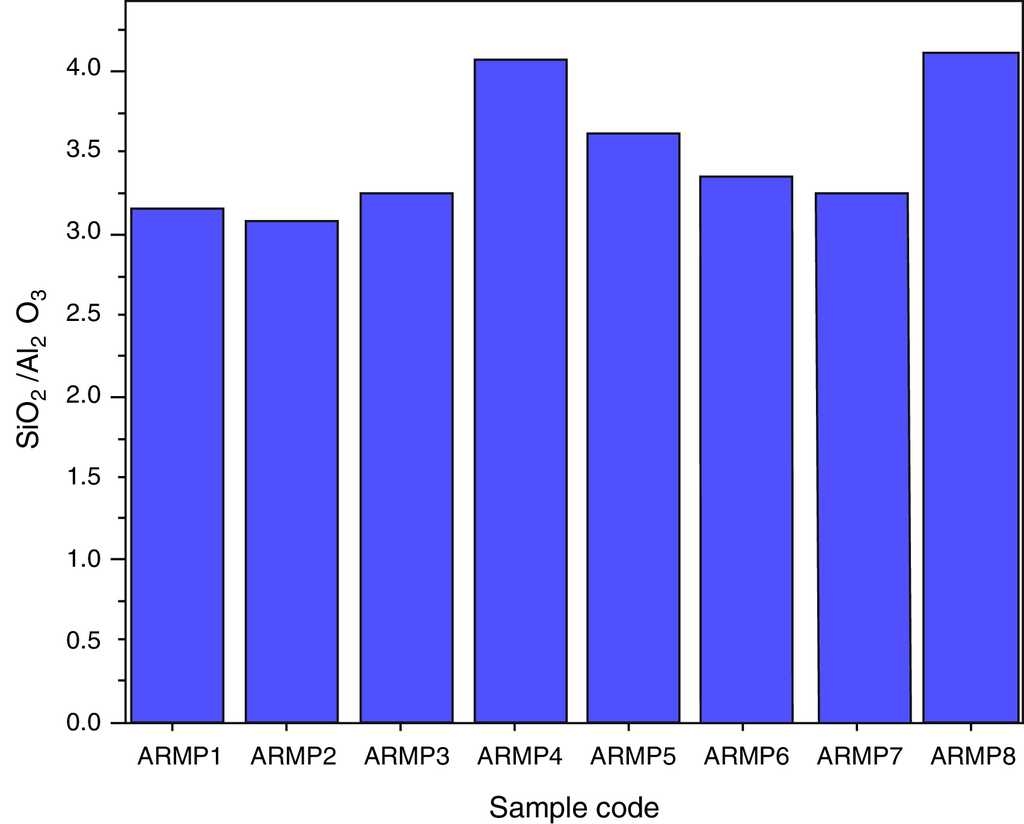
The Si and Al concentration ratio values are expected to remain the same in fired and raw clay source because of their non-volatile nature. Most of the clays can be described as hydrous aluminum silicates with general formula of Al2O3·2SiO2·2H2O. Thus, for obtaining information on provenance/grouping studies of potteries, the concentration ratios of SiO2 to Al2O3 were plotted for all pottery samples as shown in Figure 9. It was also confirmed that the selected site samples were separated as two groups, which may due to different sources.
4. Conclusion
Spectroscopic techniques coupled with chemometric tools FA and CA were used to characterize the selected clay potteries. According to the vibrational assignments and the mineralogy performed by FT-IR and XRD, the firing techniques of the relics during manufacture were obtained. Both of these techniques were well concurring with each other. Furthermore, the SEM analysis was carried out to estimate the range of firing temperatures is also in good agreement with the results of the above techniques. From all the above results, low firing (<800 °C) and high firing (>800 °C) temperatures were obtained in the oxidizing and reducing atmosphere. Hence, the results of the EDS analysis indicate that some of the major and minor elements such as O, Na, Al, Si, Cl, K, Fe and Si, Al, Na were investigated. Elements Si, Al and Na were non-volatile in nature and were used for the preliminary grouping of artifacts. The chemometric tool, i.e., CA showed that there are two distinct groups in the selected artifacts. This indicates that the potteries are made out of clays of different composition; these results are in agreement with the results of the factor analysis.

