


 nova página do texto(beta)
 Inglês (pdf)
 Artigo em XML
 Referências do artigo
 Enviar este artigo por email
 Citado por SciELO
  Similares em
SciELO
Similares em
SciELO 
 Permalink
1. Introduction
The risk of wax deposition is one of the most important challenges in the production of crude oils and handling of fuels (Bello, Ademodi, & Akinyemi, 2005; Fadairo, Ameloko, Ako, & Duyilemi, 2010; Garcia, 2001; Lorge, Djabourov, & Brucy, 1997; Misra, Baruah, & Singh, 1995; Oseghale, Akpabio, & Edebor, 2012). Paraffin deposition in trunk lines and transmission lines exposed to cooler climatic conditions remains an expensive aspect of getting oil to the market (Koshel & Kapoor, 1999). For instance in Nigeria, pipelines (e.g. Ezombe, Ashland) have been known to wax up beyond recovery (Adewusi, 1997) during crude oil transport. In 2007, 1500 bpd was deferred due to wells closed in as a result of wax problems (Sulaimon, Falade, & De Landro, 2010).
Very pertinent among these fundamentals variables that impact the formation of wax deposition are the rheological properties of the wax bearing crude oil (Adewusi, 1997; Sifferman, 1979; Taiwo, Fasesan, & Akinyemi, 2009; Wardhaugl, Boger, & Toner, 1988). In previous works, it has been noted that chemical methods are the most convenient and economic way for the prevention of precipitation of the wax from waxy crude oil as well as they increase its flow ability at lower temperature (Atta, El-Ghazawy, Morsy, Ali, & Elmorsy, 2013; Deshmukh & Bharambhe, 2008; Mahto, 2010; Popoola, Ayo, Adedeji, & Akinleye, 2015; Soni & Bharambe, 2006). This work is aimed at investigating the impacts of chemical additives on the rheological properties of the waxy crude oil. In recent times, esters of synthetic fatty acids, especially oleic acid, have been found to have a positive effects on the pour points of some waxy crude oils (Hafiz & Khidr, 2007; Soni & Bharambe, 2006). Hence the investigation of the impact of natural esters of the fatty acid, which could be obtained from seed oil, especially from non-edible seeds on flow properties of waxy crude oil. The blend of such natural esters of fatty acid with other relevant chemicals could also be investigated. Therefore, this study investigated the impacts of rubber seed oil (RSO) from Hevea brasiliensis , castor seed oil (CSO) from Ricinus communis and jatropha seed oil (JSO) from Jatropha curcas on the rheological properties of Nigerian waxy crude oil. In addition, the impact of triethanolamine (TEA) and xylene on the crude oil samples were also investigated for comparative purposes. The crude oil samples used for the study were obtained from the Niger delta region of Nigeria. The rheological properties considered were viscosity, shear rate, shear stress, yield stress and pour point.
2. Materials and method
2.1. Material
The seed oils were extracted from seeds obtained from farm locations within the western region of Nigeria while the reagents (xylene, triethanolamine, hexane) used were analytical grade products of BDH Chemical Ltd, Poole England. Four crude oil samples obtained through the Department of Petroleum Resources (DPR) from major oil companies in the Niger Delta region of Nigeria were used in the study. Crude oil sample symbolized A is Bonny light 1, B is Forcados; C is Bonny medium blend; and D is Bonny light 2.
2.2. Extraction of seed oils
Solvent extraction was used to extract the oil from the seeds using a Soxhlet extractor with n -hexane (800 ml) as the solvent. The extraction was carried out for 6 h at temperature corresponding to the boiling point of the solvent (68 °C). The solvent in the hexane-oil mixture was evaporated in vacuo using rotary evaporator. The oil obtained was then collected and weighed. The fatty acids compositions of the seed oils were determined using a gas chromatograph equipped with a flame ionization detector (FID) and capillary column (30 m × 0.25 mm × 0.25 μm films).
2.3. Sample preparation
Crude oil samples were reconditioned by heating them to a temperature of about 60 °C for nearly 10 h, with hand-rocking occasionally during heating in the laboratory prior to experiments to erase any previous history that might exist in such samples. Reconditioning the samples ensured that all precrystallized wax got redissolved into the oil, thereby erasing any thermal and shear history and producing homogenous samples for testing.
2.4. Characterization of crude oil samples
The n -paraffin composition of the crude oil samples was obtained using an Agilent Technologies 6890N gas chromatograph equipped with a flame ionization detector (FID). Helium was used as the carrier gas at a flow rate of 7.5 ml/min while the column chosen was a Supelco SPBTM-1 for its ability to resolve a wide range of paraffins. The percentage composition was calculated using the peak area normalization method, by dividing the peak area for each component with the total peak area and multiplying by 100 assuming an equal detector response.
The specific gravity (S.G.) and API (American Petroleum Institute) gravity of the crude oil samples were determined using the ASTM D287 standard while the pour points were determined using the portable Pour Point Tester PPT 45150 by PSL System Technik, which is a compact lab-instrument for measuring the pour point of oils and oil products. PPT 45150 measures according to the rotational method ASTM D5985 like the Herzog Pour Point Apparatus MC 850. The precipitation method was used for the determination of wax content as reported by Mahto and Singh (2013).
2.5. Rheological properties of the crude oil
The rheological properties of crude oil samples with and without chemical additives were studied using a rotational viscometer, the Fann Viscometer (Model 35). Following the standard procedure the corresponding shear stresses (τ ) for shear rates (γ ) of rotor speed 3-600 rpm were determined and recorded at various temperature ranges from 5 to 40 °C (Fann Instrument Company, 2013). Temperature control was through immersion of the sample-contained viscometer cup in a thermostated water bath to attain the desired temperature before each analysis.
The effects of the chemical additives on wax deposition potentials of the crude oil samples were also determined using the cold finger device and procedure as described by Bello, Fasesan, Akinyemi, Macaulay, and Latinwo (2005) to evaluate the strength of the additives on inhibiting wax deposition.
The paraffin inhibition efficiency (PIE) of the additives was determined using Eq. (1).
 (1)
(1)
where W f = amount of wax deposited without chemical addition, g; W t = amount of wax deposited with chemical additive treatment, g.
3. Results
3.1. Fatty acids compositions of the seed oil
The fatty acid composition of the extracted seed oils is shown in Table 1. It was observed that the major fatty acids in the rubber seed oil was linoleic acid (38.2%) followed by linolenic acid (24.1%) and oleic acid content of 18.3%. The jatropha seed oil was observed to contain mostly oleic acid (43.11%) and linoleic acid (39.12%) while the castor seed oil contained 4.73% oleic acid and 89.3% ricinoleic acid which is a hydroxyl derivative of oleic acid. The oils also contain some saturated fatty acids like palmitic and stearic acids as indicated in Table 1. These observations agreed with the findings of previous researchers (Kumar & Purushothaman, 2012; Mokhtari et al., 2014; Nangbes, Nvau, Buba, & Zukdimma, 2013; Pianthong and Thaiyasuit, 2009; Shrirame, Panwar, & Bamniya, 2011).
Table 1 Fatty acid composition of seed oils.
| Component | IUPAC name | RSO | JSO | CSO |
|---|---|---|---|---|
| Palmitic acid | n -Hexadecanoic | 10.2 | 12.33 | 1.45 |
| Stearic | n -Octadecanoic | 9.1 | 5.12 | 1.0 |
| Oleic | Cis-9-octadecenoic | 18.3 | 43.11 | 4.73 |
| Linoleic | Cis-9-cis-12-octadecedienoic | 38.2 | 39.12 | 2.96 |
| Ricinoleic | 12-Hydroxy-cis-9-octadecenoic | - | - | 89.3 |
| Linolenic | Cis,cis,cis-9,12,15-octadecetrienoic | 24.1 | 0 | 0.2 |
| Arachidic | Eicosanoic | - | 0.2 | - |
| Palmitoleic | Cis-9-hexadecenoic | - | 0.12 | - |
| Myristic | n -Tetradecanoic | 0.1 | 0 | - |
| 9,10-Dihydroxystearic | 9,10-Dihydroxyoctadecanoic | - | - | 0.36 |
The pour points of crude oil samples tested range from 7 to 24 °C as shown in Table 2. The crude oil sample with highest pour point (sample C) has the highest viscosity but the sample with the least pour point did not have the lowest viscosity. Hence, this gives credence to the findings of previous researchers (Adewusi, 1997; Bello, Ademodi, et al., 2005; Koshel & Kapoor, 1999; Miadonye & Puttagunta, 1998) that high viscosity does not necessarily imply high pour point for a crude oil sample. Similarly, though sample D has the highest APIg while sample C has the least APIg, it was observed that heavy oil (low API gravity) does not necessarily correlate with pour point. Sample C has the highest wax content while sample D has the lowest wax content, but sample B has the lowest pour point. The sulphur contents of all the crude oil samples are quite low. It was further observed from Figure 1 that sample C has C18+ n -paraffin composition than any of the other three crude oil samples. This may have contributed to its high wax content. This is in agreement with previous researcher findings (Zhu, Walker, & Liang, 2008). The asphaltene content of sample C was the highest while sample B contained the lowest percentage of asphaltene out of the four samples tested (Table 2). The average carbon numbers of the crude oil samples calculated from compositional analysis (Fig. 1) using ASTM D2887 are 20.7, 14.8, 24.6 and 14.1 for samples A, B, C and D, respectively.
Table 2 Characteristic properties of crude oil samples.
| Samples | S.G | APIg | Pour point (°C) | Viscosity at 40°C (mPa s) |
Wax content (%) | Sulphur content (wt%) | Asphaltene content (wt%) |
|---|---|---|---|---|---|---|---|
| A | 0.8610 | 32.8 | 16 | 11.11 | 28.45 | 0.13 | 0.22 |
| B | 0.8528 | 34.4 | 7 | 4.05 | 18.65 | 0.15 | 0.02 |
| C | 0.8428 | 27.4 | 24 | 39.24 | 33.22 | 0.02 | 0.28 |
| D | 0.8497 | 35.0 | 10 | 2.86 | 8.44 | 0.08 | 0.03 |

3.2 Rheological measurement of crude oil samples without additives
The crude oil samples were observed to behave as Bingham plastic fluid at temperatures around their pour points and below as shown by Figure 2 to Figure 5. These behaviors were established by the correlation coefficients obtained when modeling analysis carried out by fitting the rheological data to three existing models namely, Bingham plastic model, Casson plastic model and power law model as recorded in Table 3. The observations is in agreement with the findings of previous researchers (Soni & Bharambe, 2006; Taiwo, Otolorin, & Afolabi, 2012) of Sample C displayed Bingham behavior at 25 °C a temperature slightly above its pour point of 24 °C with small yield stress of about 0.6298 Pa and as the temperature reduces further, it behaves more non-Newtonian with higher yield stress (Table 4). At 30 °C, sample C tend to behave pseudoplastic with zero yield stress. This is an indication that there may be possibility of presence of some un-dissolved wax crystals in the sample at this temperature. This gives credence to the observations of Yan and Luo (1987) and Lorge et al. (1997) for waxy crude oil. However, at temperature higher than 30 °C and precisely 40 °C as shown in Figure 4, sample C behaved as Newtonian fluid. This trend of behavior was obtained for virtually all the crude oil samples tested which behaved as non-Newtonian fluid at temperature a little above their pour point and become more non-Newtonian as the temperature decreases a certain minimum temperature. Conversely, above that temperature they tend to behave as Newtonian fluids (Fig. 2 to Fig. 4). It was observed that for sample A, Newtonian behavior started at above 25 °C (Fig. 2), samples B and D respectively at above 15 °C (Fig. 5) and sample C above 30 °C (Fig. 4). Thus from the flow characteristics, samples B and D may be said to possess best inhibition property to wax formation in pipe lines than samples A and C. It is known that at low temperatures there is the tendency for waxy crudes to become more viscous, non-Newtonian and crystallize its wax contents. Although, it may be argued that initial wax contents (see Table 2) of the crude samples generally affect the physico-chemical properties and hence rheology of crude oil samples. Samples B and D contain less wax than samples A and C, which invariably enhanced their flow property at the low temperature of 15 °C than samples A and C at 25 °C and 30 °C, respectively. (Rheological behavior of pure crude oil samples is being considered in this section particularly with changes in temperature while the subsequent section considered the effects of the additives on the samples.)
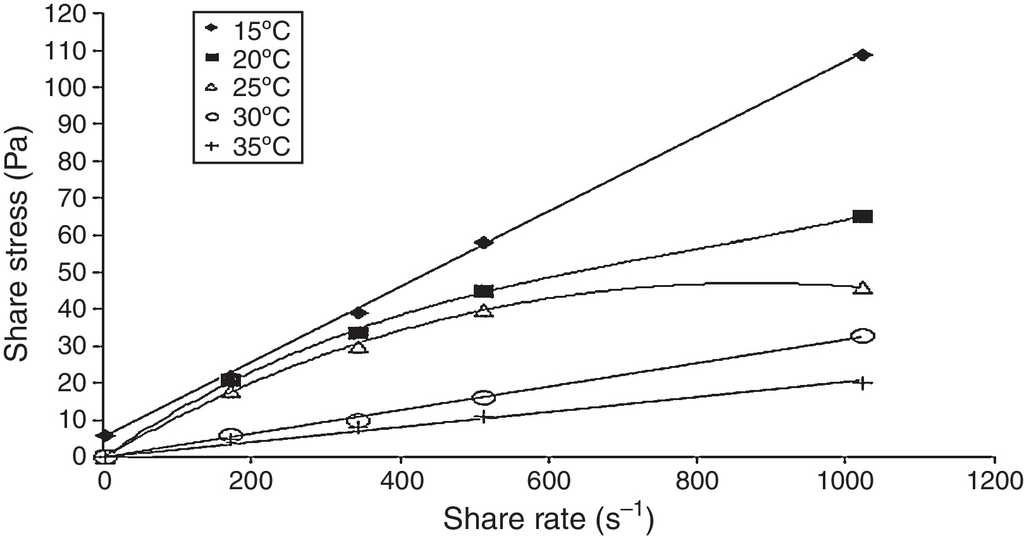
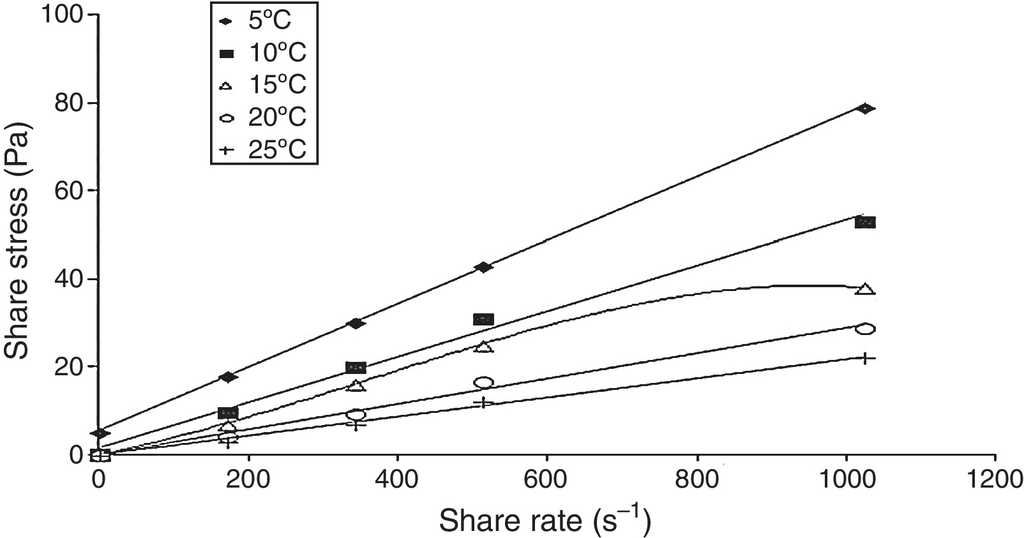


Table 3 Rheological parameters and correlation coefficients of models for the undoped crude oil samples at low temperatures.
| SAMPLE | Bingham | Carson | Power | ||||||
|---|---|---|---|---|---|---|---|---|---|
| τ o | μ p | R | k 1 | k 2 | R | m | n | R | |
| A (15 °C) | 5.3138 | 0.1016 | 0.9998184 | 1.9649 | 0.2512 | 0.9879855 | 0.1380 | 0.9709 | 0.6170774 |
| B (5 °C) | 5.4478 | 0.0723 | 0.9998890 | 1.8931 | 0.2084 | 0.9911563 | 0.1558 | 0.9058 | 0.7924726 |
| C (15 °C) | 16.1038 | 0.1349 | 0.9998266 | 3.3560 | 0.2663 | 0.9952277 | 0.4930 | 0.8338 | 0.7919470 |
| D (1 °C) | 10.7487 | 0.0853 | 0.9990805 | 2.7518 | 0.2097 | 0.9855621 | 0.4703 | 0.7672 | 0.7190340 |
Table 4 Temperature variation of rheological parameters and correlation coefficients of plastic models for the samples.
| Sample | Bingham | Carson | ||||
|---|---|---|---|---|---|---|
| τ o | μ p | R | τ o | μ p | R | |
| C (15 °C) | 16.1038 | 0.1349 | 0.999826573 | 3.3560 | 0.2663 | 0.995227653 |
| C (20 °C) | 6.9911 | 0.1263 | 0.999317350 | 2.0319 | 0.2890 | 0.992836911 |
| C (25 °C) | 0.6298 | 0.0884 | 0.998868499 | 0.5651 | 0.2755 | 0.994219467 |
| D (1 °C) | 10.7487 | 0.0853 | 0.999080540 | 2.7518 | 0.2097 | 0.9855621 |
| D (5 °C) | 6.3154 | 0.0781 | 0.999959540 | 2.2172 | 0.2050 | 0.952274158 |
| D (10 °C) | 1.7124 | 0.0639 | 0.999046276 | 0.8182 | 0.2254 | 0.997476737 |
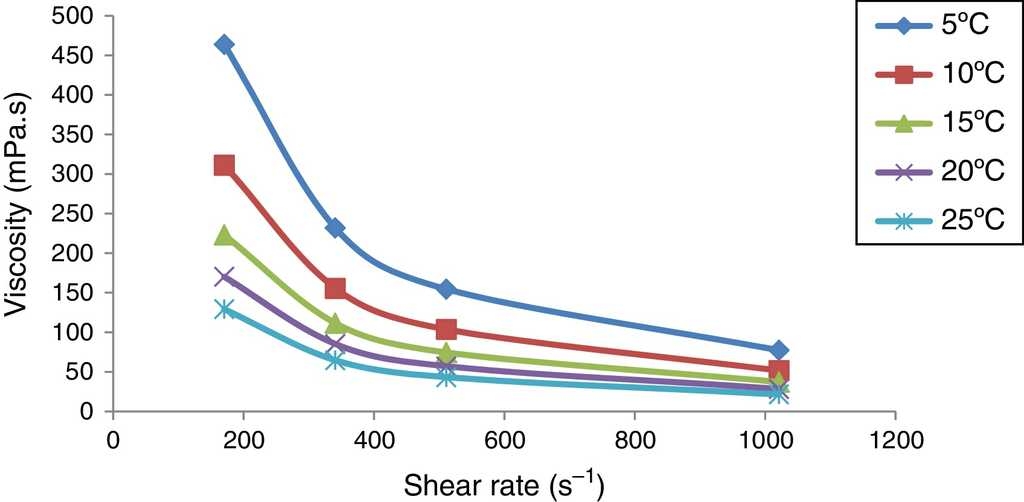
Furthermore, it was observed that the viscosity of the crude oil samples reduces with increase in temperature. The viscosity of sample A reduces with the increase in the shear rate (Fig. 6). It was observed that at high temperatures, especially well above the pour point of sample B, the viscosity of the crude oil remains almost constant with increase in shear rate. The viscosity became higher as soon as the temperature reduces to the pour point and became even higher at lower shear rate. This trend was also observed for other crude oil samples tested (see Fig. 7 to Fig. 9). This trend is in agreement with the previous observations from the rheograms of the samples earlier plotted and agreed with the findings of previous researchers (Kelechukwu & Yassin, 2008; Mahto & Singh, 2013; Singh, Venkatesan, Fogler, & Nagarajan, 2001; Soni & Bharambe, 2006; Taiwo et al., 2009).


3.3. Effects of additives on pour point
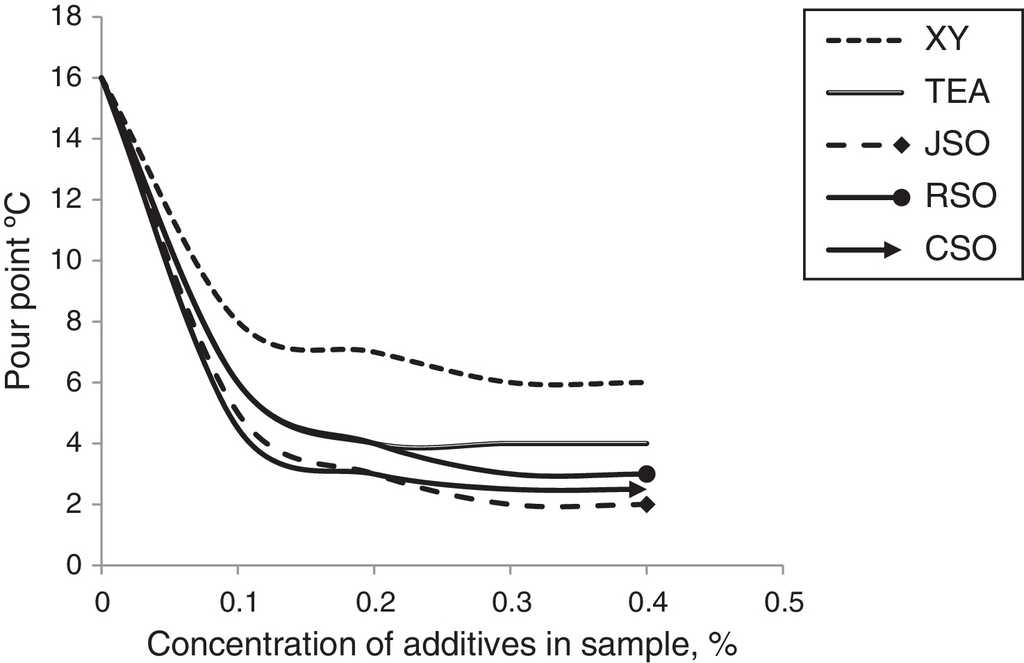
All the seed oils have the ability to depress the pour points of the crude oil samples just as xylene and triethanolamine (TEA) would do. It was however observed that for sample A, CSO depressed the pour point most (about 13 °C depression) among all the additives at low concentration [specifying the concentration used would make the work less speculative] of addition (Fig. 10) while xylene exacted least depression on sample A pour point. As the quantity of additive increases, the pour point depression increases slightly and, eventually, remains unchanged. JSO impacted slightly more on pour point depression sample A at higher dosage than CSO. Also, it was observed that TEA and RSO displayed similar effect as TEA on sample A at low concentration of up to 0.2% doping by volume while RSO depressed its pour point further at higher concentration compared with TEA. Thus, TEA is an effective pour point depressant at very low concentration in agreement with the observation of previous researchers (Popoola et al., 2015; Taiwo et al., 2009) but the seed oils would perform better at the same concentration on waxy crude oil. At high concentrations, the level of depression of all the additives on the pour point of sample A remains the same. The behavior of the seed oils may be attributed to the fact that the mono-unsaturated molecules present in them can actually bind to the larger paraffin molecules in solution and thereby sequester them from being available for wax aggregation and deposition. But where the wax content of the sample being tested has been taken care of by the optimum dose of additive, further addition beyond the optimum value will have no impact on the its pour point. It could therefore be inferred that the degree of depression caused by the addition of chemical additives to the pour point as in the case of rheology of a waxy crude oil sample depends on the quantity of paraffin wax in the sample and their molecular distribution.
It was observed that there is a sharp decrease in the pour point of sample B on addition of 0.1% of the chemical additives (Fig. 11). Both TEA and JSO depress the pour point of sample B at the same rate at 0.1% concentration but JSO depresses the pour point more than TEA at higher concentrations. It was also observed that JSO depressed the pour point of sample B the most among the additives tested at 0.2% concentration. The pour point of sample B was depressed by RSO and TEA separately to the same value of 2 °C at 0.3% concentration and did not change after further addition of either of the additives. Castor seed oil (CSO) and TEA separately depressed the pour point of sample B to the same value (2 °C) at 0.2% concentration. Further addition of TEA to the samples does not change the pour point while further addition of CSO causes the pour point to further decrease. This implies that TEA is not an effective pour point depressant for sample B beyond 0.2% concentration. At 0.3% concentration of JSO and CSO, respectively, the pour point of sample B is depressed to the same value of 1 °C, which is lower than the value (2 °C and above) obtained for XY, RSO and TEA at the same condition.

Hence CSO and JSO are observed to be more effective pour point depressants for sample C up to 0.3% concentration addition than XY, RSO and TEA. Beyond 0.3% addition of CSO or JSO to the sample does not change the pour point. It was observed that at 0.4% concentration, xylene steadily depressed the pour point of sample B until it got to the lowest value of 2 °C. Thus the pour point depression that other additives would have attained at lower concentrations could only be achieved when a large quantity of xylene is used. This is an indication that other additives are more effective pour point depressants for sample B than xylene. This may be due to co-crystallization of those additives with wax present in the crude oil during cooling which causes to develop a weaker wax crystal structure and it results in a decrease in the pour point.
It could be observed from Figure 12 that CSO and JSO have a similar trend of effects and highest positive impact on sample C pour point while XY exhibited least effect of depressing the pour point of the sample. Every chemical additive exhibits high degree of pour point depression at low concentration of additive (0.1%) in the following order: XY (10), TEA (12), RSO (13), JSO (14) and CSO (14). Hence the rate of depression of the pour point decreases with the increase in concentration of each additive. The pour point of sample C remains unchanged after adding TEA beyond 0.2% while addition of any of JSO RSO and CSO beyond 0.3% does not have any further effect on the pour point of the sample. Both JSO and CSO were able to depress the pour point of sample C by 17 °C at 0.3% concentration which other additives could not attain.

For all [note all here i.e. TEA, XY, JSO, RSO and CSO] the additives tested the pour point of sample D on addition of 0.1% chemical additives separately sharply decreases (Fig. 13). The degree of depression of the pour point of sample D on addition of 0.1% TEA and RSO at separate occasion are the same but lower than the depression caused by CSO and JSO, which also displayed a similar degree of pour point depression of sample D at 0.1% addition. The addition of XY to sample D steadily depressed the pour point of the sample throughout the range of additive dosage. TEA does not further impact on the pour point of sample E beyond 0.2% concentration. All the other chemical additives depress sample D pour point until 0.3% when they stopped altering the sample mixture pour points at any further addition of chemical additive.

3.4. Rheological measurements of dozed samples
The results of the investigation of the effects of the seed oils on the relationship between shear rate and shear stress of sample C at 15 °C are shown in Figure 14 to Figure 16. When 0.1% concentration of RSO was added, sample C exhibited a pseudo-plastic fluid property. But at higher concentration of RSO, the sample exhibited Newtonian fluid property (Fig. 14). The gradients of the Newtonian plots showed that addition of RSO to sample C above 0.3% dosage, increased the viscosity of the sample. When sample C is doped with JSO at 0.1-0.4% concentration range, the sample exhibited Newtonian flow property 15 °C (Fig. 15). The viscosity, however, increased at above 0.3% concentration of JSO dosage in sample C. The effect of CSO on sample C followed the same pattern as that of JSO but in different magnitude (Fig. 16). The apparent viscosities of the samples were observed to decrease with an increase in the amount of additive doping from 0.1 to 0.3% for the three seed oil (RSO, JSO and CSO) as shown in Table 5, while the addition of TEA to the crude oil samples above 0.2% increased the viscosities of the samples. This is an indication that the seed oils could interact with the paraffin molecules of the crude oil samples up to 0.3% concentration thereby reducing the viscosity of the sample. The hydroxyl functions or the delocalized unpaired electron over the π-orbital at double bond of the unsaturated fatty acid components of seed oils may have interacted with some functionalities of the wax to result in the reduction of the viscosity (Fig. 17). This is in agreement with the suggestion of previous researchers (Gateau, Henaut, Barre, & Argillier, 2004; Taiwo et al., 2012).
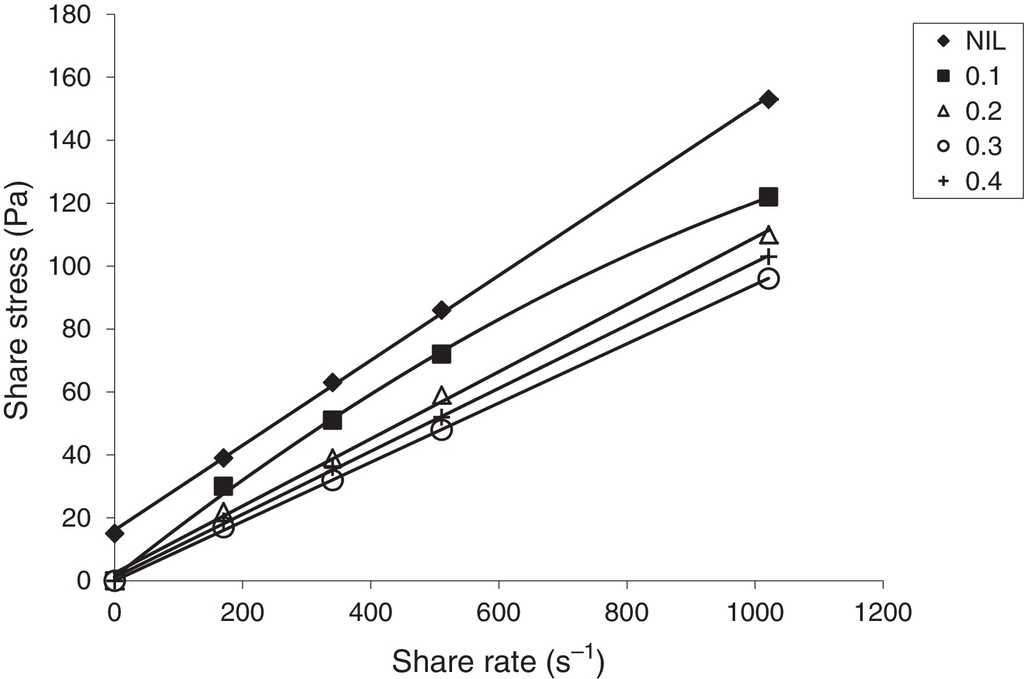


Table 5 Effects of chemical additives on viscosities of crude oil samples at various temperatures.
| Additive | Concentration (%) | Temperature (°C) | Apparent viscosity (mPa s) | |||
|---|---|---|---|---|---|---|
| Sample A | Sample B | Sample C | Sample D | |||
| Blank | 0.0 | 15 | 106.6 | 37.2 | 149.7 | 29.4 |
| 20 | 63.6 | 28.4 | 132.1 | 19.1 | ||
| 25 | 45.0 | 21.5 | 89.0 | 11.6 | ||
| TEA | 0.1 | 15 | 53.8 | 29.4 | 119.4 | 20.5 |
| 20 | 48.9 | 22.5 | 98.8 | 13.7 | ||
| 25 | 40.1 | 16.6 | 81.2 | 8.8 | ||
| 0.2 | 15 | 47.0 | 23.5 | 100.8 | 16.6 | |
| 20 | 41.1 | 18.6 | 85.1 | 10.8 | ||
| 25 | 37.2 | 12.7 | 74.4 | 6.8 | ||
| 0.3 | 15 | 57.7 | 27.4 | 107.6 | 26.4 | |
| 20 | 46 | 26.4 | 95.9 | 15.7 | ||
| 25 | 43.1 | 18.6 | 87.1 | 10.8 | ||
| RSO | 0.1 | 15 | 57.7 | 31.3 | 119.4 | 22.5 |
| 20 | 51.9 | 23.5 | 97.8 | 15.7 | ||
| 25 | 41.1 | 16.6 | 79.3 | 9.8 | ||
| 0.2 | 15 | 48.9 | 26.4 | 107.6 | 19.6 | |
| 20 | 43.1 | 19.6 | 87.1 | 12.7 | ||
| 25 | 37.2 | 13.7 | 74.4 | 7.8 | ||
| 0.3 | 15 | 42.1 | 23.5 | 93.9 | 17.6 | |
| 20 | 38.2 | 16.6 | 79.3 | 10.8 | ||
| 25 | 34.2 | 10.8 | 71.4 | 8.8 | ||
| JSO | 0.1 | 15 | 50.9 | 26.4 | 113.5 | 18.6 |
| 20 | 43.1 | 19.6 | 93.9 | 12.7 | ||
| 25 | 37.2 | 13.7 | 77.3 | 7.8 | ||
| 0.2 | 15 | 44.0 | 22.5 | 94.9 | 15.7 | |
| 20 | 37.2 | 16.6 | 83.2 | 10.3 | ||
| 25 | 33.3 | 10.3 | 70.5 | 6.4 | ||
| 0.3 | 15 | 37.7 | 17.6 | 90.0 | 13.7 | |
| 20 | 31.8 | 14.7 | 74.4 | 7.8 | ||
| 25 | 30.3 | 7.8 | 66.5 | 5.4 | ||
| CSO | 0.1 | 15 | 52.8 | 27.4 | 112.5 | 17.6 |
| 20 | 46.0 | 20.5 | 92.0 | 11.7 | ||
| 25 | 39.1 | 14.7 | 76.3 | 6.8 | ||
| 0.2 | 15 | 45.0 | 23.5 | 95.9 | 14.2 | |
| 20 | 39.1 | 17.6 | 82.2 | 9.8 | ||
| 25 | 35.2 | 11.7 | 70.0 | 6.4 | ||
| 0.3 | 15 | 38.2 | 18.6 | 89.0 | 12.7 | |
| 20 | 33.3 | 15.7 | 74.4 | 7.83 | ||
| 25 | 32.3 | 9.2 | 66.5 | 4.9 | ||
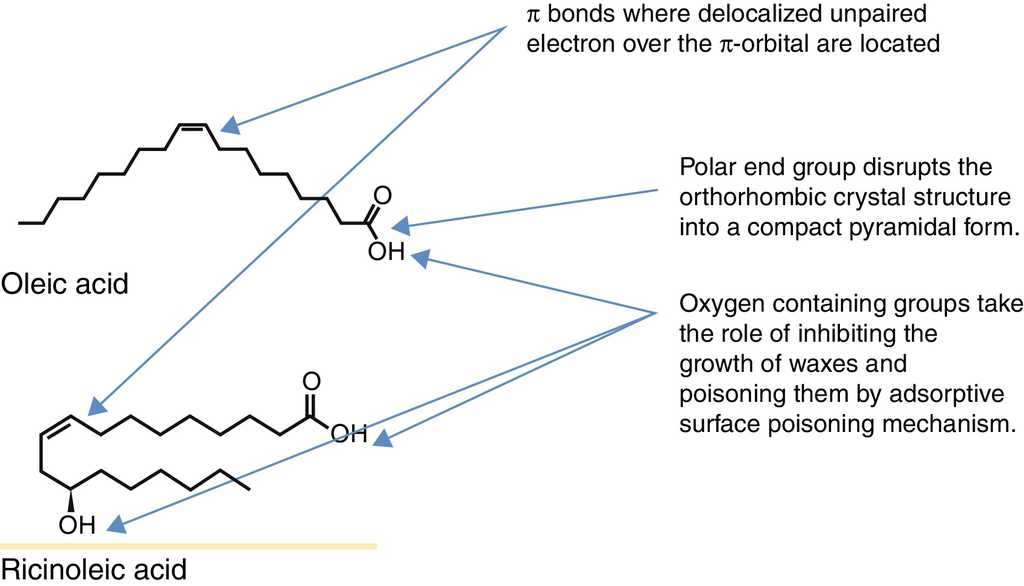
Fig. 17 A typical structure of oleic acid and ricinoleic acid indicating the site of interaction with the wax structure.
Furthermore, the oleate esters (in the natural oil in addition to the oleic acid) may have made stronger H-bonds with resin or asphaltene than those between resin and asphaltene molecules; H-bonds among asphaltene-oleate-resin stretch into the space and thus, the mutual overlapping of the aromatic ring planes of resins and asphaltene reduces greatly, hence, the viscosity of the crude oil reduces. This gives credence to the work by Soni and Bharambe (2006) in which they stated that if chemical additive molecules have polar groups in their polymeric backbone or pendant chain which can form stronger H-bond with the polar groups of resin and asphaltene present in the crude oil, then they act as an effective flow improver. From the fatty acid composition analysis, the jatropha seed oil contained the highest percentage of oleic acid followed by rubber seed oil (Table 1). The castor seed oil, however, contained a very high percentage of a derivative of oleic acid Ricinoleic acid (which is oleic acid with an hydroxyl compound substituting one of hydrogen in the 12th carbon). The ricinoleic acid in the castor seed oil was a little above 89%. It is very pertinent to mention that the seed oils did contain esters of some of these fatty acids in certain proportion although that is not listed here. The high percentage of oleic acid in the JSO and ricinoleic acid (hydroxyl derivative of oleic acid) in CSO containing hydroxyl polar group may have given them edge over RSO in their performance as flow improvers in depressing the pour point and reducing the viscosities of the crude oil samples, as shown in Table 5, for all the samples testes. It was also observed from the table that TEA displayed stronger flow improving ability than RSO for all the crude oil samples, except C, at low temperatures (15-25 °C) between 0.1% and 0.2% of doping. Of course TEA also contains some hydroxyl groups, its high viscosity comes to play when added in much quantity to the crude oil samples when it increases the viscosity of the crude oil sample rather than reducing it. However, further doping of the crude oil samples with RSO in almost all the cases reduced the viscosity of the sample beyond what TEA could do at 0.2% concentration. Performance of TEA on the crude oil samples is in agreement with the findings of previous researchers on its ability as flow improver (Popoola et al., 2015; Taiwo et al., 2009, 2012). In all the samples tested, JSO and CSO performed as better flow improvers than TEA at low temperatures (15-25 °C). Results of the investigation of the effects of the seed oil additives on yield value of sample C shows that, as the concentration of the additive introduced into the crude oil sample increases, the yield value reduces at the temperature of 15 °C considered (Table 6).
Table 6 Effects of seed oil additives on the yield value of sample C at 15°C.
| Concentration | Yield values (Pa) | ||
|---|---|---|---|
| RSO | JSO | CSO | |
| 0.0 | 16.104 | 16.104 | 16.104 |
| 0.1 | 7.4439 | 3.4068 | 3.4824 |
| 0.2 | 2.4075 | 1.031 | 1.0687 |
| 0.3 | 0.9341 | 0.8051 | 0.4622 |
| 0.4 | 1.1252 | 0.7366 | 0.7667 |
This gives credence to the findings of Soni and Bharambe (2006) on waxy crude oil. It was, however, observed that the yield value increases slightly after adding RSO and CSO beyond 0.3%.
3.5. Impact on wax deposition potential of crude oil samples
The result of wax deposition tendencies of the crude oil within the temperature range of 5-30 °C are shown in Table 7. The results showed that sample A was all solid at temperature 15 °C, sample B all solid at 5 °C, sample C all solid at 20 °C and sample D all solid at 10 °C. These behaviors are in agreement with the earlier observations regarding the pour points of the pure crude oil samples (Table 2). However, sample A displayed 24.2% wax deposition tendency at 20 °C, sample B displayed 15.3% at 10 °C, sample C displayed 30.5% at 25 °C and sample D displayed 8.3% at 15 °C. These values were the highest deposition observed for the pure crude oil samples at temperatures tested. The investigation of the effects of additives on wax deposition tendencies of the crude oil samples was carried out and reported for the temperatures at which the sample displayed highest wax deposition tendencies (Table 8). The results of the effects of the additives as wax deposition inhibitors in crude oil samples revealed that CSO performed best for crude oil samples A, C and D relative to other additives investigated while JSO performed best for sample B and followed by other samples (Table 8). It was further observed that TEA performed better than CSO as wax deposition inhibitor for sample B at the temperature considered while xylene displayed least performance in all the crude oil samples considered. The paraffin inhibition efficiencies of RSO on the crude oil samples are above average. These results confirmed the earlier observations that the seed oils possess the ability to create barrier to the formation of the interlocking crystal wax network and thus hinder their deposition.
Table 7 Wax deposition tendencies of undoped crude oil samples.
| Sample | Organic deposit (g/g) | |||||
|---|---|---|---|---|---|---|
| 5 °C | 10 °C | 15 °C | 20 °C | 25 °C | 30 °C | |
| A | All solid | All solid | All solid | 0.242 | 0.137 | 0.072 |
| B | All solid | 0.153 | 0.114 | 0.082 | 0.055 | 0.039 |
| C | All solid | All solid | All solid | All solid | 0.305 | 0.247 |
| D | All solid | All solid | 0.083 | 0.062 | 0.037 | 0.015 |
Table 8 Effect of additives as wax deposition inhibitors in crude oil samples at specific temperatures with 0.1% (v/v) doping.
| Sample | Wax deposition (g/g) (PIE, %) | |||||
|---|---|---|---|---|---|---|
| Control | Xylene | TEA | RSO | JSO | CSO | |
| A @ 20 °C | 0.242 | 0.105 (56.6) | 0.082 (66.1) | 0.089 (63.2) | 0.066 (72.7) | 0.054 (77.7) |
| B @ 10 °C | 0.153 | 0.057 (62.7) | 0.044 (71.2) | 0.051 (66.7) | 0.043 (71.9) | 0.050 (67.3) |
| C @ 25 °C | 0.305 | 0.133 (56.4) | 0.111 (63.6) | 0.107 (64.9) | 0.092 (69.8) | 0.091 (70.2) |
| D @ 15 °C | 0.083 | 0.029 (65.1) | 0.025 (69.9) | 0.025 (69.9) | 0.022 (73.5) | 0.021 (74.7) |
4. Conclusions
The ability of natural seed oil to act as flow improver, pour point depressant and wax deposition inhibition on waxy crude oil were investigated in this study. It could be concluded that natural seed oil obtained from agricultural sources such as rubber seed, Jatropha seed and castor seed could be used as flow improver and pour point depressant for Nigerian waxy crude oil. Jatropha and castor seed oils could depress the pour point more than the previously investigated triethanolamine. The active component of the seed oils which were involved in the interaction with the higher hydrocarbons in the crude oil is oleic acid, its derivative (ricinoleic acid) and oleate esters. These interactions brought about pour point depression and wax deposition inhibition, among others. JSO and CSO are capable of depressing the pour point up to about 17 °C; they also reduce the viscosity of the waxy crude oil appreciably within 0.1-0.3% (v/v) dosing concentration. Also, the seed oils could inhibit wax deposition in the crude oil at low temperature. Castor seed oil could exhibit as high as 77.7% paraffin inhibition efficiency and jatropha seed oil could exhibit PIE of 73.5%. Though crude oil from different sources tends to have different unique properties, the seed oils were able to display positive impacts on the flow ability of all the various crude oil samples tested having different hydrocarbon composition. Thus, their application as flow improver will cover a wide range of crude oil fields.

