


 nueva página del texto (beta)
 Inglés (pdf)
 Artículo en XML
 Referencias del artículo
 Enviar artículo por email
 Citado por SciELO
  Similares en
SciELO
Similares en
SciELO 
 Permalink
1. Introduction
The longitudinal and transversal forces on the tire-road interface largely influence vehicle dynamics (Rajamani, 2006). For this reason, a good number of studies have been conducted to propose mathematical models that describe these forces. A family of models is derived from empirical studies that use pseudostatic relationships for the tire-road forces. Some of the most notable examples of this kind of models are the so called "magic formula" (Bakker, Nyborg, & Pacejka, 1987) and the models reported in Burckhardt (1993) and Kiencke (1993). Other approach, based on the physics of the friction phenomena, resort to dynamic friction models to describe the tire-road force interaction. The Lu-Gre dynamic friction model (Canudas, Olsson, Åstrom, & Lischin-sky, 1995) has received particular attention in applications for traction control because it is relatively simple and yet it describes most of the nonlinear phenomena experimentally observed in friction.
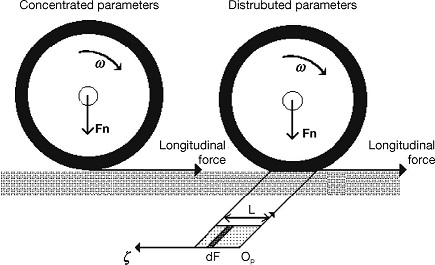
From an experimental point of view, there are several test beds used to analyze tire-road interaction (see Ginn & Marlowe, 1967; Ginn et al., 1962; Bird & Martin, 1973; Carrillo, 2004, and I.T.V., 2006, for example). As it can be appreciated in Figure 1, that illustrates some of the typical installations, in all cases there is independent control of the tire and the rolling surface. By independently controlling the speeds of the two degrees of freedom, all possible longitudinal slips can be obtained. If force sensors are incorporated, once velocities reach a steady state, it is possible to measure the force of the tire-road interaction for each value of the longitudinal slip. Based on these measurements, force vs. slip or friction coeffcient vs. slip curves, similar to those shown in Figure 2, can be obtained. It is from these curves that most of the pseudo-static models are derived.


Pseudo-static models give only information of the total tire-road force. To analyze the force distribution in the contact patch, some authors use sensors in two manners. In the first one, sensors are placed on the tire resulting in the so called "smart tires" (Coleri et al., 2009; Castillo, Blanca, Cabrera, & Simón, 2006; Yilmazoglu, Brandt, Sigmund, Genc, & Hartnagel, 2001). In the second case, sensors are placed below the rolling surface in such a way that normal forces in the contact area can be measured (Rose & Guenther, 2009; Muller, Uchanski, & Hedrick, 2003; Ho, Dao, & Hirai, 2011). Sensors on the tire are normally piezo-electric and therefore have limitations on their maximum size that oblige to use networks of sensor to fully cover the contact area. Sensors placed bellow the rolling surface can use piezoelectric or optical sensors and also consist in arrays of discrete sensors. Based on measurements obtained from these sensors, conclusions regarding the distribution of forces can be obtained. Recently, Zhang and Yi (2012) found that the shape of the force in the contact patch has a bimodal distribution and that force in the perimeter of the contact area is larger than inside it.
The use of LuGre model to describe the tire-road force was first introduced in Canudas and Tsiotras (1999). There are two families of LuGre models: lumped parameters and distributed parameters. Using this last one, in Tsiotras, Velenis, & Sorine (2004), a trapezoidal shape for the force distribution in the tire-road contact patch was proposed to carry out the force analysis. Distributed parameters LuGre models are difficult to use for traction-braking control purposes due to its complexity. For this reason, lumped parameters LuGre models are used instead. The formulation of these models is based on the assumption of an average behavior of forces in the contact patch area. There is, however, little experimental evidence on this average behavior of forces in the contact area and its relation with the LuGre model.
In this paper a test bed is designed and built with two initial goals: a) analyzing the shape of the contact forces at the tireroad interface, and b) validating the assumption on average force behavior for lumped parameters LuGre models. The test bed will also be used for experimenting with traction-braking control algorithms. To achieve all these goals, a different design to those used in the literature was proposed as shown in Figure 3, where it can be noticed that only the degree of freedom related with the wheel is actuated by a directly coupled motor. The other degree of freedom, the rolling surface, in this case a cylinder that represents both the pavement and the vehicle inertia, it is not actuated. Its motion occurs only by the force transmitted by the tire-cylinder interface. This configuration yields an under-actuated system that, from a mechanical point of view, has an equivalent behavior of a tire-road dynamic system, as will be shown later. Another differences of this test bed with other previously designed are the type and the location of sensors. Taking advantage of their relative large size, strain gages were selected as force sensors and were directly adhered on the rolling surface. Measurements of the strain gages are processed by a wireless system as will be described later.

The paper is organized as follows. Section 2 describes the mechanical design of the test bed, while section 3 contains a review of the LuGre dynamic friction model. In section 4, the strain gages measurement system is described and section 5 explains the model for the shape of longitudinal and lateral forces distribution. Section 6 presents examples of the experimental results that are discussed in section 7. Finally, section 8 presents the conclusions and directions for future work.
2. Mechanical Design of the Test Bed
The test bed design is based in a quarter vehicle model, similar to that used in Kiencke and Daiss (1994), Liu and Sun (1995), and Yi, Alvarez, Claeys, Horowitz, & Canudas de Wit (2001) given by:
 1
1
where m is the vehicle mass, v the longitudinal velocity, F x the tire-road traction-braking force and F ax the aerodynamic dragging force, that can be expressed as:
 2
2
with C ax the aerodynamic coeffcient, that depends on the effective exposed longitudinal area, air density and vehicle shape. The tire-road force is given by:
 3
3
where μ is the tire-road friction coefficient and
 4
4
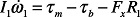
where ẇ1 is the angular acceleration, I 1 is the tire inertia, τm is the driving torque, is the braking torque, τb and R 1 is the effective tire radius.
The test bed designed to obtain data for the analysis on the tire-road contact forces consists on a roller and a tire. The roller represents the road as well as the weight of the vehicle, as seen in Figure 4, where I 2 is the inertia of the roller, I 1is the inertia of the tire, R 2 is the ratio of the roller, R 1 is the ratio of the tire and F n is the normal force. The roller axis of rotation is free to move in the vertical direction to guarantee that the tire is subjected to the full roller weight. The main reasons for using this design is its simplicity and the analogy with the dynamic model of the quarter vehicle.

The type of tire used is 4.5/10.0-5 DR10 and has the same basic characteristics as a conventional vehicle tire. The roller is made with high density polyethylene and its radius was chosen to make the contact between tire and roller as flat as possible. To choose the servomotor that moves the setup it is necessary to know the maximum required torque. For this purpose the relation between radius R 1 and R 2, velocities ω 1 and ω 2 and torque τ1 and τ2 was used.
Defining
 5
5
and assuming steady state, i.e., ω 1 R 1 = ω 2 R 2, Torques can be related to tire-road friction force by F = τ 1 R 1 and F = τ 2 R 2. The relation between torque and inertia in the tire is given by:
 6
6
The radius of the selected wheel is R 1 = 0.12 [m] and the roller radius is R 2 = 0.36 [m]. Maximum longitudinal speed is fixed for the tire at v t = 13 [m/s] and the maximum value for α1 is set to 35.83 [rad/seg2]. Replacing values on Eq. (6), yields:
 7
7
With this value, Yaskawa SGMPH servomotor, with specifications shown in Table 1, was selected. Servomotor dimensions are shown in Table 2, according to Figure 5. Once the necessary data is known, a CAD software was used for the test bed design (see Figure 3).
Table 1 Parameters of the technical data.
| Parameter | Value | Unit |
|---|---|---|
| Voltage | 200 | [V] |
| Amperage | 15 | [A] |
| Torque | 4.77 | [Nm] |
| Rated output | 1500(2.01) | [W (hp)] |

3. LuGre Dynamic Friction Models
The LuGre model is a dynamic friction model that can be used to describe the tire-road contact forces (Canudas & Tsiotras, 1999). In this model, it is assumed that the contact on the tire-road surface occurs through microscopic elastic bristles, following a brush analog. When a tangential force is applied, bristles deflect as a spring until sliding occurs. There are two forms for this model:
1. Distributed parameters, where the contact between surfaces is assumed to occur in a region or patch and the model represents the friction force at each differential element of area in the patch. Total force is calculated by integrating all the differential elements of force along the area of the contact patch.
2. Concentrated or lumped parameters, where an average or uniform behavior for all the elements in the contact patch is assumed. The total force is represented by a scalar quantity that is equivalent to the integration of differential forces in the contact patch for the distributed form. Figure 6 illustrates these two representations.
Distributed parameter models are of the form:
 8
8
 9
9
 10
10
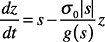
where δF(ξ,t) is the differential friction force at the longitudinal coordinate ζ along the contact patch and time t , δz(ζ,t) is internal state reflecting the deflection of bristles, s is relative velocity and δF is the differential of the normal force. Parameters σ0(ζ),σ1(ζ), and σ2(ζ), are expressed per unit length and represent the stiffness and damping at position. It is assumed that the contact area is constant and the normal force is evenly distributed along the contact patch that has length L , i.e.,
Function g(s,ζ) is of form:
 11
11
that is a model to represent the "Stribeck effect," that describes the transition from a static friction force Fs(ζ) to a Coulomb friction coefficient Fc(ζ), depending on s and vs(ζ) the "Stribeck" velocity (Canudas & Tsiotras, 1999).
There are some other friction models with distributed parameters (Dugoff, Fancher, & Segel, 1969; Tielking & Mital, 1974; Dugoff, Fancher, & Segel, 1970; Rajamani, 2006), which consider the existence of variations of the contact area or footprint between the tire and the road, that are not considered here.
The lumped form of the LuGre model is given by:
 12
12
 13
13
where F is the tire-road friction force, z is an internal state representing the average deflection of the bristles in the contact area and s the relative speed of motion between the surfaces, tire and road. Parameters σ 0 and σ 1 represent the average stiffness and damping of the internal state z , while σ 2 is the average viscous friction coefficient between surfaces moving at relative speed s . Finally, function g (s ) is of form:
 14
14
that is a model to represent the average "Stribeck effect," describing the transition from an average static friction force F s to an average Coulomb friction coefficient F c , as a function of s and v s the average "Stribeck" velocity (Canudas & Tsiotras, 1999).
There are two issues related with the LuGre model. The first one is related with the form of the force distribution at the contact patch. This point has been studied in Deur, Asgari, & Hrovat (2001) and Velenis, Tsiotras, & Canudas-de-Wit (2002), where assuming constant parameters σ i along the patch, calculations were made to find a trapezoidal distribution of force, similar to what is shown in Figure 7. There is not, to authors knowledge, experimental evidence that corroborates this analysis. The second issue is related to the validity of the lumped parameters form of the LuGre model. The main goals of this paper are to perform experimental work related to these two issues. The hypothesis to prove is that it is possible to utilize a dynamic friction model with lumped parameters as a good substitute for a distributed parameters models.

4. Strain Gages Measurement System
As the main purpose of this paper is to analyze the forces on the contact area between the tire and the road, it was decided to design a system with strain gages to perform this task. Strain gages are designed to measure stress or tension on concrete and other solid materials, because they can detect elongations and contractions by means of their elasto-electric properties (Ortiz et al., 2008). Strain gages were adhered to the high density polyethylene roller, longitudinally and diagonally, as shown in Figure 8.

4.1. Signal Conditioning
The circuit that was used to condition the strain gages consists on a Wheatstone Bridge, with the strain gage laid in one of the arms. In the amplification stages, two high-gain differential amplifiers for each gage and a non-inverting amplifier to amplify the output voltage were used. Amplifier gains were chosen to make the output voltage to be in the range from 0 to 5 [V] (see Figure 9).

4.2. Strain Gages Foot-print
As a first step, the area covered by the contact between the strain gages and the tire was calculated. Different weights on the tire were used to produce different normal forces and the voltage in the gages was measured (Fig. 10). The area of the contact patch was obtained using carbon copy paper and using image processing ImageJ software, the average contact area was 0.0005 [m2].

4.3. Strain Gages Frequency Response
To decide if strain gages were suitable for the task of measuring the force distribution in the contact patch, one gage was adhered to a metallic strip which was later placed on an electrodynamic stimulator to get its frequency response. With frequencies from 20 [Hz] to 1300 [Hz], sinusoidal and square functions were programmed on the electrodynamic stimulator in order to obtain the response for the gages, that can be viewed on the Bode plot of Figure 11 where the transfer function is approximated by:
 15
15

From the obtained results shown in Figure 11, it is clear that it is possible to use these strain gages with input frequencies smaller than 1.3 x 10³ [rad/s] as the overshoot on the Bode plot indicates a resonant peak at 200 [Hz]. For inputs with f >200 [Hz], the output signal of the gage has a 180° phase-shifting. In this case, 200 [Hz] is well above as the maximum speed that the roller will have, that is equivalent to 8.5 [Hz].
4.4. Wireless Communication Diagram
Once the strain gages signals were conditioned, their measurements needed to be transmitted for analysis. For this purpose, a system that consists of a microcontroller and data acquisition card was used. As the roller will be in continuous motion and not slip rings were desired, wireless communication was necessary. A Wi-Fi module and a router were used in a LAN with a single Internet IP address. The Wi-Fi module and router follow the 802.11b communication protocol and can handle data at a rate of 54 Mbps. The strain gage signals are processed by a microcontroller and send by a serial peripheral interface (SPI) to the Wi-Fi module and later received by the router, that is connected to a personal computer. Data acquisition process is done through a client-server software architecture, where the client is an application developed in JAVA language and the server is the microcontroller. Data received by the client is stored in a database for further analysis and interpretation.
4.5. Encoders for Synchronization of Gages Measurements
To precisely know the position of the gages relative to the tire, incremental encoders were placed on the axis of the roller and of the tire. These encoders allow to know when the tire passes over the gages. For synchronization, a fixed initial position signal is sent by the encoders to allow reset of the counters in the microcontroller.
5. Longitudinal/Lateral Force Distribution
The goal of placing longitudinal and transversal of strain gages is to investigate the distribution of forces in the tire-road area of contact with the intention to confirm the shape of this distribution and to prove that for traction/control purposes lumped parameters models capture all the basic features of tire-road friction forces. The placement of the strain gages 1-6 (Fig. 8) was decided with the following rationale. Gages in the longitudinal direction, 1-3, are intended to investigate the longitudinal force and how this force changes at different positions of the transversal direction of the tire (Fig. 12A). Gages in the diagonal direction, 4-6, measure continuous changes of the force in both the longitudinal and transversal directions (Fig. 12B). By analyzing the force patterns in the complete set of strain gages, conclusions about the force distribution can be reached.

As expected, it was found in the experiments that the distributed longitudinal and lateral forces along the contact patch are not uniform along the contact area; the shape corresponds to a polygon which resembles a trapezium, as illustrated in Figure 13, where transition points are appropriately marked. Figure 14 represents the transition points in the shape of the distribution force against the strain gage position, for gages 1-3. A similar distribution for gages 4-6 is portrayed in Figure 15.
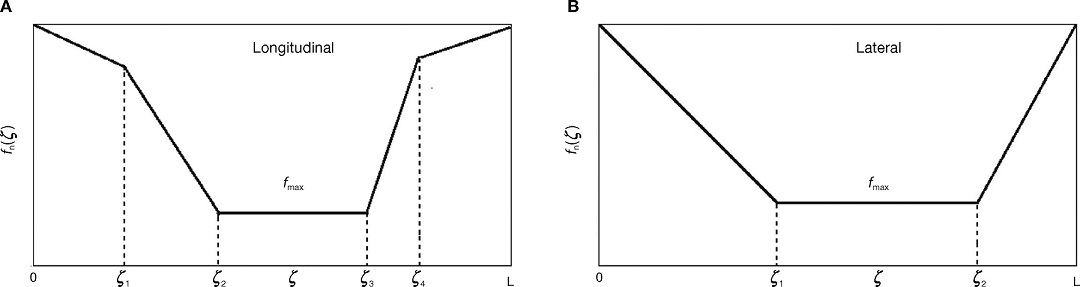


Considering Figure 13, the function f n that describes the longitudinal force along the patch position ζ can be approximated by piecewise functions as:
 16
16
with f max the maximum value of the longitudinal force, ζ 1 , ζ 2 , ζ 3 , and ζ 4 are the coordinates indicated in Figure 13A and:

For the lateral case, force distribution f n is approximated by:
 17
17
where transitions points correspond to Figure 13B and:


The role of these transition points will be detailed in the following sections.
6. Experimental Results
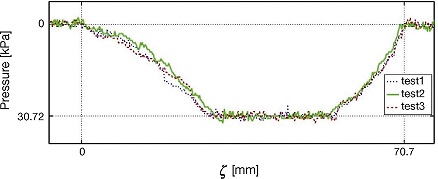
In this section the results of the experiments in the test bed equipped with the strain gages are described. All the strain gages were of the same length, 100 [mm], and have the same specifications. The normal load was kept constant and the tire was inflated to 208.8 [kPa]. The first set of results was performed with the idea of showing the repeatability of the tests. In this case, the plot in Figure 16 shows the force recorded in strain gage 1 for three different experiments executed under the same conditions of velocity. As it can be appreciated, the three experiments yielded the same results with small variations due to sensor noise.

The second set of results is shown in Figure 17, that contains the force plots for three experiments performed at different speeds. Note that, as reported in Burckhardt (1993) and Olmos and Alvarez (2005), force decreases with speed, however, the basic shape of the force distribution is similar for all speeds.

For analysis purposes, in Figure 18 the measurements of force distribution in the contact patch of gage 1 are divided into segments ζ 0 , ζ 1 , ..., ζ 6 . In segments ζ 0 and ζ 6 there is no tire-gage contact. Region ζ 1 is a transition where the tire begins its contact with the gage, that is not completely under the tire. For segment ζ 2 tire is in contact with the gage, however the portion of the tire making contact is composed by a compressed and a flat zone. The intermediate segment ζ 3 corresponds to full tire-roller contact. Segments ζ 4 and ζ 5 revert the behavior of regions ζ 2 and ζ 1 respectively.

Figures 19 and 20 show the behavior of gages 2 and 3, respectively. As in the case of gage 1, segments are indicated in the figure for the different types of strain gage-roller behavior.


For the gages placed in diagonal form, experiments were repeated. Figure 21 shows three tests under the same conditions for gage 4. Note that there is repeatability and that the shape of the pattern resembles the shape in Figure 13B.
This shape is different for this gage to that of the longitudinally placed strain gages. This figure shows a more linear behavior at the beginning of the contact of the tire with the gage, that is also valid for the end of the contact.
Figure 22 contains three plots of experiments with different velocities for gage 4, the observed behavior is similar to that in Figure 17, force decreases with speed. Figure 23 shows the distribution of force in the tire-road contact patch for the gage 4. This simpler pattern requires to divide the measured signal in five segments, ζ 0 , ζ 1 , ..., ζ 4 . No contact tire-gages occurs in segments ζ 0 and ζ 6 , while segment ζ 1 is a transition zone where the tire is rolling into the gages and a compression process is also happening. Segment ζ 2 is related with full tire-gage contact and, finally, segment ζ 3 reverts the process of region ζ 1 . Segments for strain gages 5 and 6 are shown in Figure 24 and Figure 25, respectively.


7. Discussion of Results
7.1. Effect of the Roller Curvature
The first point to analyze is the effect of the curvature of the roller in the length of the contact patch L that, using Figures 18-20, can be established by:
 18
18
depending if full contact, average contact or any contact is considered. From Figures 18 -20 , the value of L can be approximated to 25, 43, 61 [mm], for the three. The use of the roller introduces curvature in the contact zone, however, as the length of the contact patch is small relative to the perimeter of the roller as 2πR2=235.5mm [mm], the average error that is introduced in the radius of contact by the curved contact of the roller is 0.06, 0.18, 0.35%, respectively, for the three lengths under consideration. These are very small values and therefore the behavior of the curved tire-roller contact can be appropriately approximated as a flat contact one.
7.2. Shape of the Contact Zone
If regions of no contact of partial tire-gage contact are discarded, that is regions, ζ 0, ζ1, ζ5 and ζ 6 in Figures 23 -25 , the following conclusions can be derived.
Trapezoidal shape: The shape of the region detected by the longitudinal strain gages and marked by region ζ 2 , ζ 3 , and ζ 4 in Figures 18 -20 is similar to Figure 7 reported in Velenis et al. (2002).
Compression and decompression zones: There is a difference in the slope of the curves that form the trapezium. Figure 7 shows that the slope of region ζ 2 is larger than the slope of region ζ 4 . Experiments indicate the contrary, i.e. that the slope in region of compression ζ 2 , when the tire is entering into the strain gage, is smaller than that of the region of decompression ζ 4 , when the tire is leaving the strain gage.
Lateral compression: The regularity on the slope of regions ζ 2 and ζ 3 for strain gages 4, 5 and 6 shown in Figures 23 -25 indicates that the compression of the tires in the lateral sense is negligible with respect to the compression in the longitudinal sense.
Size of the patch: The extension of the full contact patch, as derived from the experiments, is rectangular with an area of approximately 25 [mm] long × 18 [mm] wide and grows to 61 [mm] long × 50 [mm] wide, if partial contact is considered.
For the used tire, that has R 1 = 133.8 [mm] of effective radius and W 1 = 100 [mm] of effective width, this is equivalent to 0.18R 1 ×0.18W 1 and 0.45R 1 ×0.5W 1 , respectively.
7.3. Lumped Parameters Models
The experimental results indicate that, based on the measurement at the strain gages, the friction force at the tire-roller interface is constant when full contact takes place (that corresponds to region ζ 3 in Fig. 18-20). This, in turn, implies that the lumped parameter model is a good approximation to calculate this friction force. It can be expected that the σ 1 parameters of the model in Eqs. 12-13 vary with time, when conditions in the road change. For this purpose, real time identification schemes for the parameters, as those suggested in Olmos and Alvarez (2005) can be used.
8. Conclusions
An experimental setup for analysis of the tire-road contact area was designed and constructed. This test bed is a new design proposal to directly measure the forces at the tire-road contact patch in longitudinal and lateral directions. A novel methodology to analyze the tire-road contact patch was developed. The measurement system is based on strain gages, a microcontroller and a wireless communication system. This system allowed to understand and analyze the tire-road force measurements at the contact area. Finally, experimental results confirmed the trapezoidal shape of the force distribution along the contact patch in the longitudinal direction, although with different slopes for the trapezium of those reported in the literature. The results also showed that lumped parameter LuGre dynamic friction models can correctly approximate the total force in the tire-road contact area.

