


 nueva página del texto (beta)
 Inglés (pdf)
 Artículo en XML
 Referencias del artículo
 Enviar artículo por email
 Citado por SciELO
  Similares en
SciELO
Similares en
SciELO 
 Permalink
1. Introduction
The emergence of the COVID-19 pandemic has brought an increase in the reception of remittances during 2020 for Mexico. In this work we observe that during 2020 Mexico received more than 42,624 million dollars in remittances, coinciding with the arrival of the COVID 19 pandemic, which represents a quarterly average in nominal terms, 652% more than in 1995, 397% more than in 2000, 83% more than in 2010, and 11% more than in 2019, since the remittances of 1995, 2000, 2010 and 2019 amounted to 5,667, 8,572, 23,313 and 38,457 million dollars (Banxico, 2021a).
At the beginning of the arrival of COVID-19, it was considered that the economic contraction generated in the United States through the increase in unemployment in that country, would negatively affect remittances from Mexico, however we observe an aggressive countercyclical policy to reduce unemployment in that country, which has allowed migrants to maintain their income and remittances (Valdivia, Mendoza, Quintana, Salas and Lozano, 2020).
The literature on the motivations to send remittances suggests at least three different approaches to understand why remittances are sent (Elbadawi and Rocha, 1992); the first is grouped within the Endogenous Migration perspective, which considers that the sending of family remittances is an endogenous variable in the migration decision process, along with the length of stay, savings and others; likewise, it values the family relationships and socio-economic aspects of migrants, giving greater weight to the characteristics of migrants and their families, which explains the sending of remittances from an altruistic approach. A second group of explanations, generate results relatively similar to the altruistic approach but are based on risk sharing (Lucas and Stark, 1985). The third group addresses the sending of remittances from the perspective of Portfolio Optimization, in which only the self-interest of migrants motivates the sending of remittances, regardless of their decision to emigrate and the conditions of their family. Macroeconomic-financial variables are more important, especially in terms of investment risk and return considerations (Islas and Moreno, 2011).
To our knowledge, there is no empirical evidence to show the impact of the advent of the COVID-19 pandemic on remittances from the United States to Mexico. This article analyzes the role that the pandemic has had on remittances using a monthly time series from January 2014 through May 2021. The article identifies that the COVID-19 generated a structural break in the reception of remittances, altering both the short and long run relations that remittances held with different variables like the US GDP and Mexico’s GDP. Using Orthogonalized Impulse Response Functions (OIRF’s), our analysis shows that before the COVID 19 pandemic there was evidence in favor of the altruistic, the risk sharing and the self-interested hypothesis to send remittances. The evidence during the COVID 19 pandemic is that remittances became more a necessity reducing the importance of the investment motive and that of pure altruism, leading to an increase in the risk sharing motive.
The rest of the paper is organized as follows. The second section presents a review of some background information on the arrival of the pandemic and the theoretical and empirical literature on the determinants of remittances. The third briefly shows the methodology and presents the variables used in the empirical analysis. The fourth presents the results of the analysis and discusses them with respect to the contributions of previous studies, and the fifth concludes.
2. Theoretical and empirical background
With the arrival of the COVID-19 pandemic, a collapse in remittances from Mexicans was predicted due to the suspension of economic activities in the United States and its impact on unemployment and income of Americans (Valdivia et al., 2020). However, the reality was different, since remittances increased significantly during 2020, because Mexicans have not only managed to keep their jobs, but also the amount of money they sent to their families increased by a percentage close to 11 percent in 2020 compared to 2019 in nominal terms (Banxico, 2020), which contrasts with the decrease in remittances in other labor-exporting countries1.
Among the causes of the increase in remittances from Mexican migrants in the United States despite the emergence of the pandemic, the following are mentioned: i) the 36% depreciation of the Mexican peso against the US dollar during the COVID-19 crisis, since a stronger dollar provides immigrants with additional incentives to send more resources back home, because it can generate more remittances with greater purchasing power in the country of origin (Mandelman and Vilán, 2020), ii) Stimulus programs of economic benefits in the United States, specially the CARES Act (Coronavirus Aid, Relief, and Economic Security Act) that had an amount of more than 2 billion dollars, and which included transfers to 83% of the unemployed Latino population, which allows to ensure that the majority of the Mexican population should have been recipients of the stimulus payment, guaranteeing the sending of remittances even in the COVID-19 pandemic (Domínguez and Miranda, 2021) and iii) the employment of Mexican migrants in activities considered essential to the US economy such as the primary sector, the construction industry, commerce and manufacturing, which were some of the economic activities that were soon opened in that country (Domínguez and Miranda, 2021).
Mandelman and Vilá (2020) also add within the factors that may explain the increase in remittances to Mexico even with the pandemic to the following: 1) industries such as agriculture, including meat and poultry from the United States, are large employers of immigrants and clearly, these are jobs that were not negatively affected by the pandemic and in any case, these industries expanded during the period, 2) although American restaurants stopped receiving customers, there was a considerable increase in “take out” alternatives, so instead of being employed as waiters and waitresses, Mexican immigrants were typically working inside kitchens, and 3) American households that were forced to stay indoors found a particular liking for home improvement and landscaping, sectors that are also disproportionately served by Mexican immigrants.
For their part, Ramírez and Lozano (2021) point out some factors related to the labor participation of Mexican migrants, which put their health at risk but contributed to the increase in remittances, such as the significant number of them who continued to work, despite of being afraid of catching the virus, since most of them are employed in informal and precarious jobs in the United States, so they do not have job benefits and hardly have the opportunity to be absent from work; as well as the fact that they constitute the majority of the workforce employed in the agricultural sector, thus helping to keep supermarkets stocked with fruits and vegetables amid the health crisis caused by COVID-19 that paralyzed several states in the United States, although 45% of them do not have health insurance, as many are hired informally and those who are not unionized lack the necessary information about the dangers of the virus, and similarly, those who work in the field of personal services, especially in the preparation, sale and distribution of food, 47% do not have medical insurance.
On the other hand, in a study on the receiving federative entities of the remittance-sending states during the pandemic, (Banxico, 2020) highlights that despite the emergence of COVID-19 in the United States and the fall of more than 10% of the total employment and employment of Mexican migrants in particular in that country during the period from January to May 2020, there are factors that allowed the increase in remittances in Mexico, such as the higher proportion of documented Mexican immigrants in the United States, and with it, the lower probability of a drop in their remittances to Mexico, which suggests the possibility of a greater receipt of unemployment benefits for this population group. However, it also points out factors that could negatively affect the sending of remittances from the United States to Mexico, such as the degree of affectation caused by the COVID-19 pandemic in the different states of the United States, as well as the contraction of the employment in economic activities that predominantly hire Mexican immigrants, such as construction and lodging and food preparation services.
For its part, the Mexico 2021 Migration and Remittances Yearbook indicates that the COVID-19 crisis negatively impacted the United States labor market and that the unemployment rate of the Mexican migrant population went from 6.6% in March 2020 to 17.1 % in April 2020, but that despite the above, a factor that could increase the reception of remittances in Mexico is the high labor participation of Mexican migrants in essential economic sectors of that country, estimating that almost 20% of the jobs in agriculture, almost 12% of manufacturing jobs, more than 6% of wholesale trade jobs, 4.4% of chemical, plastic and rubber manufacturing jobs, 1.3% of hospital jobs and 2% of work in other health services in the United States was carried out by the Mexican migrant population (BBVA-SGCONAPO, 2021).
Likewise, the previous document adds some factors related to health that seem to explain the resistance of remittances from the United States to Mexico, such as the access of Mexican migrants to health services in that country, since in 2020 only 34% of them did not have coverage of public or private health services, although in contrast, 77.2% of them had some degree of overweight or obesity in the same year and 13.6% had been diagnosed as borderline diabetic or prediabetic between 2017 and 2018; while in 2020, the total Mexican population served by the Ventanillas de Salud program was 3,060,946, and that as of January 4, 2021, 3,384 deaths of Mexicans due to COVID-19 had been registered in the United States (BBVA-SGCONAPO, 2021).
With regard to the theoretical determinants of remittances, because the most common motivation for remittances for migrants is to support the family members who are left behind, wife, children, parents and members of larger family and social circles, the majority of theoretical approaches address remittances as a result of the altruism of migrants, although more recently the migrant's self-interest has been considered as the main reason for sending remittances (Islas and Moreno, 2011; Rapoport and Docquier, 2005).
For example, Rapaport and Docquier (2005) mention that a mixture of individualistic motives of migrants, such as altruism, exchange, strategic motives and inheritances, as well as family agreements, such as insurance, investment and loan repayment, explain the probability and size of remittances2. Other authors such as Andreoni (1989) 3 consider that the factors that determine the sending of remittances constitute impure altruism, while for Lucas and Stark (1985))4 remittances are determined by enlightened selfishness.
In order to carry out empirical analysis on the determinants of the flow of remittances, these in recent times have been classified by Elbadawi and Rocha (1992) in two groups; those that support the idea that family ties affect the flow of remittances and is called the Endogenous Migration perspective, which considers the sending of remittances as an endogenous variable in the migration decision process, in addition to assessing family relationships and socioeconomic aspects of migrants, giving greater weight to the characteristics of migrants and their families, in which altruism is a central resource that directly explains the sending of remittances. Under this approach, the ability to remit is directly linked to the salary received in the host country and the saving behavior of the migrant, among other factors. But most importantly, if altruism is the main reason for sending remittances, remittances would behave more like a normal good, i.e., when income raises remittances would tend to grow.
In one type of model derived from this approach, the migrant is seen as the traditional macroeconomic agent that maximizes intertemporal utility to generate a savings-consumption trajectory both in their place of origin and destination (Djajic, 1989; Djajic and Milbourne, 1988). But in other types of models under this approach, which maintain the endogeneity of the migration decision, but treat remittances as a contractual agreement between the migrant and his family, the terms of which are defined by the bargaining power of the parties, and which it constitutes a risk-sharing arrangement that compensates for the lack of insurance markets in developing countries, particularly in rural areas, by guaranteeing income in difficult times and offering an improved risk-return framework (Lucas and Stark, 1985, Stark and Katz, 1988). The risk sharing argument has important implications, since an increase in income in the receiving country would reduce the need for remittances. Consequently, we decided to split in this paper this first approach into two: one called pure altruism, will reveal itself if remittances are a normal good, and a second one called the risk sharing motive would reveal itself if income at the sending country and income at the receiving country have different effects on remittances.
The second approach in Elbadawi and Rocha (1992), which for us constitutes a third explanation for remittances, is called Portfolio Optimization and considers that remittances are only a transfer of savings from one place to another, in which only the self-interest of migrants motivates the sending of money, regardless of the idea of migrating and of the conditions of their family, and that the migrants decide where to house their savings and maximize their utility by determining their personal consumption and the amount allocated to financial instruments both in the country of origin and in the host country, the macroeconomic-financial variables being more relevant as the decision to remit is dependent on risk and return on investment (Islas and Moreno, 2011).
Models derived from this approach focus on relative rates of return, relative prices, and uncertainty as basic determinants in the decision to remit (Swamy, 1981; Miranda, 1988).
Following what was proposed by Elbadawi and Rocha (1992), Islas and Moreno (2011) made a synthesis of the Endogenous Migration and Portfolio Optimization perspectives, forming two components of remittances: (i) required and (ii) desired (or voluntary), establishing that the Endogenous Migration perspective explains the existence and behavior of the first component and takes into account the situation of the migrant's family, through variables such as differences in income, savings and expectations between the countries of origin and host, the stock of migrants, the length of stay, while the Portfolio Optimization perspective explains the second component and takes into account mainly financial variables, such as the interest rate differential between the home and host countries, the domestic inflation rate, and the exchange rate differential.
On the other hand, in order to determine whether the macroeconomic conditions of the migrant's countries of origin and host should be included within the determinants of remittances, Vargas-Silva and Huang (2005) developed an intertemporal model that explicitly expresses the relationship between the flow of family remittances and the macroeconomic conditions of both countries, assuming that remittances are sent in the first period and that the migrant returns to their country of origin in the second period. They assume that the utility of the migrant in the first period depends on his consumption in the host country and the consumption of his family in the country of origin, which in turn depends on the economic conditions of the country of origin, while the income of the migrant it depends on the economic conditions of the host country, concluding that the improvement of the economic conditions of the host country causes an increase in remittances; that is, the migrant sends more remittances because their economic condition improves, and that in the same way, if the migrant is sending money for altruistic reasons and the conditions of the country of origin improve, then they send less money because their family is in better conditions without remittances. Likewise, by increasing the return on savings in the host country, the migrant could increase their savings and thereby decrease their remittances, or they could decrease their savings since the increased return would allow them to save less and thereby increase their remittances, concluding that the empirical analysis of remittances should include the macroeconomic variables of the migrant's country of origin, as well as those of the host country.
Regarding the results of empirical studies on the subject carried out under the Endogenous Migration and Portfolio Optimization approaches, Islas and Moreno (2011) point out that the results reported by the literature are not robust, mainly due to differences in the preferences of migrants, relationships between macroeconomic variables and remittances that vary according to the importance of the altruistic effect and implicit contracts, presence of non-robust signs in the indicators of income, inflation, interest rates and exchange rates of the place of origin, possible endogeneity of economic growth that could affect the results of the relationship between remittances and indicators of domestic production, as well such as the use of samples from different countries, regions and temporalities, among other causes, which is addressed in our article by estimating the impact of the COVID 19 pandemic on remittances as well as the interactions between the COVID 19 pandemic and some control variables on remittances
The inconsistency of the results of the empirical studies on the subject is shown when we observe the determinants of the type of endogenous migration of remittances that Swamy (1981), Solimano (2001), Giuliano and Ruiz Arrauz (2005) and Islas and Moreno (2011) find that remittances are positively related to economic conditions and the GDP of the remittance-receiving country, while El-Sakka and Mcnabb (1999), Castillo (2001), Faini (1994) and Islas and Moreno (2011), Aydas, Neyapti and Ozca (2005) and Gupta (2005), find that remittances are negatively related to economic activity and wages in the remittance-receiving country. On the other hand, Elbadawi and Rocha (1992), Castillo (2001), Aydas, Neyapti and Ozca (2005), Gupta (2005), Vargas Silva and Huang and (2006), Mouhoub, Oudinet and Ozca (2008) and Swamy (1981) find a positive relationship between the economic situation of the host country and remittances.
Such inconsistency is also observed in the determinants of the type of portfolio optimization, Faini (1994) finds that the real exchange rate is positively related to remittances, while El-Sakka, and Mcnabb (1999), Castillo (2001) find that remittances are negatively related to the real exchange rate. On the other hand, Islas and Moreno (2011) and El-Sakka and McNabb (1999) find a negative and statistically significant relationship between remittances and the interest rate differential, while Aydas, Neyapti and Ozca (2005) find a positive relationship between the interest rate differential and remittances.
3. Methodology
We start by proposing a linear model between remittances (
Where the factors related to the endogenous migration perspective are
The sign of the parameter
The sign for
In the case of the sign for
The expected sign for
In the case of
In the case of
To study the time-break that COVID-19 imposes in the equation, we start by looking at a potential shift in the constant of the linear model, which is obtained using a dummy variable that takes the value of 1 for all months of 2020 after February, as well as for the first five months of 2021, and takes the value of zero in every other month.
Equation (2) however, can be estimated with bias in the presence of cointegration, which would occur if the variables are I(1) and if at least one linear combination of them is I(0) (Engle & Granger, 1987; Castillo, 2001). We apply the augmented test of Dickey-Fuller to test for the existence of unit roots in each of the series analyzed.5
Moreover, if the series are I(1) the existence of time-breaks could be confused with the existence of a unit root, which would require a test for time breaks that would take into account the potential existence of unit roots (Phillips and Perron, 1988; Mendoza-González & Villagra-Piña, 2021). Because of this, we apply the test of Clemente, Montañes and Reyes (1998) which test for the existence of time breaks in the presence of unit roots and structural breaks. Likewise, we apply the test of Wagner and Weid (2017) that allows to monitor for changes in the cointegration relationships.
Given the results for the existence of I(1) series and at least one potential cointegration relationship, we apply the Vector Error Correction (VEC) methodology to estimate the relationship between the variables proposed including the estimation of the cointegration equations. The Vec estimated is given by:
Where
We also estimated the Orthogonalized Impulse Response Function (OIRF) for the period excluding the COVID 19 months and for the period including the COVID 19 months. We could not estimate the VEC for only the months where COVID 19 took place because of insufficient data points, consequently we settled for showing what the inclusion of the COVID 19 months generates on the estimated IRF’s.6
4. Data
The series used are monthly and use information from 2014 and onward up to May 2021 the last month with complete information for all variables. We have information before 2014 for the different variables, however, exploratory analysis showed us that a structural change took place after 2009 and for the series of remittances a break was also detected in mid 2013. Consequently, we chose to focus after December 2013.
The monthly data for Remittances is presented in millions of dollars and comes from Banxico (2021a); the data for Mexico’s GDP is proxied using the Economic Activity General Index (IGAE, for its acronym in Spanish) and comes from INEGI (2021a); the data for the GDP of the US is proxied by an index provided by the Federal Reserve Economic Data (FRED) from the Federal Reserve Bank of St. Louis Bank (FRED, 2021). The data for Mexico’s wages is the monthly index for real minimum wages that comes from Banco de Mexico (Banxico, 2021b), while the data for the wages of the US are the average hourly wage earnings that are provided by the Bureau of Labor Statistics (BLS, 2021a). The average monthly Federal Funds rate comes from Banco de México (Banxico, 2021c), while Mexico’s 28 days average interbank interest rate comes from Banco de México (Banxico, 2021d). The nominal exchange rate comes from Banco de México (Banxico, 2021e), while the consumer prices index for Mexico is obtained from INEGI (2021b) and the consumer price index for the US comes from the Bureau of Labor Statistics (BLS, 2021b). The transformations to real figures were carried out based on the prices for January 2019 for both Mexico and the United States.
Graph 1 shows the evolution of remittances in real terms for the period 1995-2021, transformed from monthly to quarterly data. Between 1995 and 2021, the trend in the flow of remittances, in real terms, has been positive. It had a period of stability in the 1990s, while at the beginning of the new century it increased considerably, although a significant increase in volatility is also observed. The continuous growth of remittances during the period under study has been exposed in works such as that of (Islas and Moreno, 2011), which indicates an average of 3,000 million dollars in the early nineties, an average of about 6,000 million dollars in 1998, and the overcoming of the 10,000 million dollars barrier in the first semester of 2006. In our work we observe that during 2020 Mexico received more than 40,000 million dollars, coinciding with the arrival of the COVID pandemic19, which represents a quarterly average in real terms, 600% more than in 1995, 300% more than in 2000, 61% more than in 2010, and 10% more than in 2019.
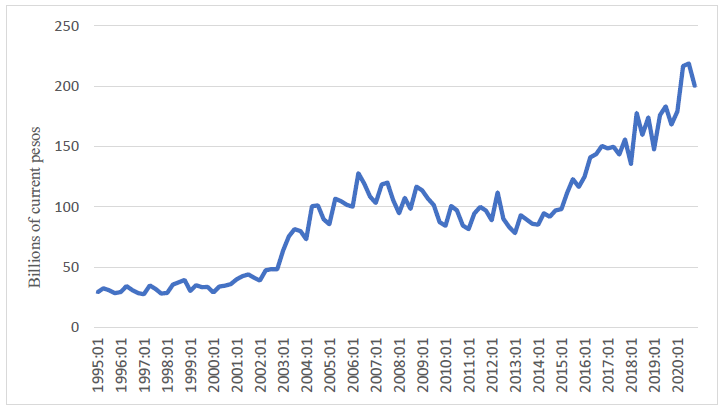
The above behavior indicates the need to differentiate the data because it is clearly non-stationary. Formal tests are carried out in the next section that will show that the monthly data becomes stationary using the first difference, and /or the first difference of the 12th seasonal difference.
Table 1 briefly describes the mean values of the series included in the model, each variable measured in its first monthly log difference, which approximates month to month percent changes. Table 1 clearly shows how dramatic the Covid 19 period was for remittances since it presents a growth of about 2% per month, when for the 2014-2019 period the growth was approximately .6%. For the entire period studied, remittances grew at .8%. These results are preliminary since different econometric challenges need to be corrected before a final verdict can be expressed.
Table 1 Mean Values for Selected Variables
| All | 2014-2019 | 2020-2021 | ||
| D.Remittances | Mean | 0.008 | 0.006 | 0.019 |
| S.E. | 0.116 | 0.104 | 0.162 | |
| N | 89 | 72 | 17 | |
| D.US GDP | Mean | 0.004 | 0.01 | -0.022 |
| S.E. | 0.188 | 0.19 | 0.181 | |
| N | 89 | 72 | 17 | |
| D.MX GDP | Mean | -0.002 | -0.002 | -0.004 |
| S.E. | 0.04 | 0.032 | 0.066 | |
| N | 89 | 72 | 17 | |
| Exchange rate | Mean | 0.005 | 0.005 | 0.003 |
| S.E. | 0.033 | 0.027 | 0.053 | |
| N | 89 | 72 | 17 | |
| lnterest Rate Differential | Mean | 0.002 | 0.007 | -0.022 |
| S.E. | 0.035 | 0.03 | 0.044 | |
| N | 89 | 72 | 17 | |
| US Wage | Mean | 0.001 | 0.001 | 0.001 |
| S.E. | 0.007 | 0.003 | 0.015 | |
| N | 89 | 72 | 17 | |
| MX Wage | Mean | 0.006 | 0.003 | 0.015 |
| S.E. | 0.032 | 0.024 | 0.053 | |
| N | 89 | 72 | 17 |
Source: Own calculations based on data from INEGI (2021a, 2021b), FRED (2021), BLS (2021a, 2021b), Banxico (2021a, 2021b, 2021c, 2021d, 2021e)
Table 1 also shows that the GDP of US increased .01% per month in the 2014-2019 period, while it declined .02% during the 2020-2021 period. In the case of Mexico, the GDP contracted -.2% previous to the Covid 19 period and it contracted -.4% during the Covid 19 period. The exchange rate depreciated .5% during the pre Covid 19 period and depreciated .3% during the Covid 19 period. The interest rate differential grew .7% previous to the Covid 19 period and contracted -2.2% during the Covid 19 period. The US wage grew in real terms .1% both before and after the Covid 19 period. Mexico’s real wage grew .3% previous to the COVID 19 period and grew 1.5% during the Covid 19 period.
5. Results for the Linear Model
The results for the linear estimations are shown in Table 2. The R squared of the equation shows that our simple linear model can explain 81% of the variation observed in remittances for the first differenced data, while it explains 53% of the variation for the first difference of the seasonally differenced data.
Table 2 Linear Models for Remittances
| First Difference | FD of Seasonally differenced |
|
| US GDP | 0.04 | 0.02 |
| -0.03 | -0.02 | |
| MX GDP | 0.98*** | 1.08*** |
| -0.2 | -0.19 | |
| Nominal Exchange Rate | 1.10*** | 1.17*** |
| -0.16 | -0.13 | |
| Interest Rate Differential | -0.1 | -0.08 |
| -0.08 | -0.07 | |
| US wage | -4.14** | -4.09*** |
| -1.24 | -0.96 | |
| MX wage | 0.17 | 0.51 |
| -0.23 | -0.26 | |
| Covid 19 | 0.03 | 0.01 |
| -0.02 | -0.02 | |
| Constant | -0.07*** | 0.02 |
| -0.01 | -0.02 | |
| R_squared | 0.81 | 0.53 |
| N | 182 | 181 |
***Significant at 1%, **Significant at 5%
A 1% increase in Mexico’s GDP increases remittances between .98% and 1.08%, which agrees with the investment hypothesis. Comparing the results found in this paper with those found in other empirical studies, we find that they agree with those of Swamy (1981), Solimano (2001), and Giuliano and Ruiz Arrauz (2005), all of which found a positive relation between remittances and the GDP of the remittance-receiving country. They contrast with those of El-Sakka and Mcnabb (1999), Castillo (2001), Faini (1994), Islas and Moreno (2011), Aydas et al (2005) and Gupta (2005), which find a negative relationship between GDP and remittances.
A 1% increase in US’ GDP increases remittances between .02% and .04%, but it is not statistically significant. The positive sign coincides with the results of Elbadawi and Rocha (1992), Castillo (2001), Aydas et al (2005), Gupta (2005), Vargas Silva y Huang (2006), Mouhoub et al (2008) and Swamy (1981).
A one percent increase in the Nominal Exchange Rate increases remittances between 1.1.% and 1.17% percent. This result indicates that the portfolio motive to send remittances is also present. Our results also agree in sign with those of Faini (1994). However, they do not agree with El-Sakka and Mcnabb (1999), and Castillo (2001), because those authors found a negative relation between remittances and the real exchange rate.
The Interest rate differential is not statistically significant. This result does not agree with those of Islas and Moreno (2011), and El-Sakka and Mcnabb (1999), since they find a negative and statistically significant relationship between remittances and the interest rate differential. Our results also do not agree with those of Aydas et al (2005), that find a positive relationship between the differential of interest rates and remittances.
A 1% increase in the US wage reduces between 4.09% and 4.14% remittances. Since an increase in the US wage, keeping other things equal, increases the US-Mexico wage differential and this is linked positively to migration (Cuecuecha, Fuentes-Mayorga & McLeod, 2021), an increase in the US wage reduces remittances, perhaps because new migrants need to pay their migratory costs when they have recently arrived at the US.
An increase in the Mexican real wage does not changes remittances. The sign obtained is positive which is consistent with the idea that individuals are investing in Mexico.
Table 2 also shows that the coefficient for COVID 19 is not statistically significant. This result needs to be taken with caution for the reasons given before. We now proceed to test for the existence of stationarity and cointegration in the data.
6. Results of Unit Root and Cointegration tests
As explained before, Model (2) may be biased if there exists at least one cointegration relation between the variables in vector
Table 3 Results for Augmented Dickey Fuller Tests, all variables in log units
| Level | 1st Difference | 12-month
seasonal difference & 1st Difference |
|
| Remittances | -1.7 | -8.33 | -11.55 |
| [0.43] | [0.0] | [0.0] | |
| US GDP | -2.72 | -10.43 | -10.4 |
| [.07] | [0.0] | [0.0] | |
| MX GDP | -1.56 | -10.55 | -5.11 |
| [.50] | [0.0] | [0.0] | |
| Nominal Exchange Rate | -0.96 | -7.93 | -7.1 |
| [.76] | [0.0] | [0.0] | |
| Interest Rate Differential | -2.76 | -4.63 | -4.04 |
| [.06] | [0.0] | [0.0] | |
| US wage | -0.77 | -8.15 | -7.2 |
| [.82] | [0.0] | [0.0] | |
| MX wage | 1.64 | -8.86 | -10.1 |
| [.99] | [0.0] | [0.0] | |
| N | 182 | 181 | 169 |
P-values in brackets
Table 4 presents tests that allow to determine the existence of cointegration relations among the variables that form vector
Table 4a Johansen tests for cointegration for first difference of log unit
| Trend: constant | Number of obs = 89 | ||||
| Sample: 2014m1 - 2021m5 | Lags = 4 | ||||
| Max. Rank | Parms. | LL | Eigenvalue | Trace statistic |
5% critical value |
| 0 | 154 | 1368.2834 | . | 176.4608 | 124.24 |
| 1 | 167 | 1402.5976 | 0.5375 | 107.8324 | 94.15 |
| 2 | 178 | 1424.4635 | 0.38821 | 64.1007* | 68.52 |
| 3 | 187 | 1439.0543 | 0.27955 | 34.9191 | 47.21 |
| 4 | 194 | 1447.4397 | 0.17175 | 18.1482 | 29.68 |
| 5 | 199 | 1452.7231 | 0.11195 | 7.5815 | 15.41 |
| 6 | 202 | 1456.5133 | 0.08165 | 0.001 | 3.76 |
| 7 | 203 | 1456.5138 | 0.00001 | ||
*Cut off point.
Table 4b Johansen Test of Cointegration for first difference of seasonally differenced log unit data
| Trend: constant | Number of obs = 89 | ||||
| Sample: 2014m1-2021m5 | Lags = 4 | ||||
| Max rank | Parms | LL | Eigenvalue | Trace statistics |
5% critical value |
| 0 | 154 | 1343.88 | . | 180.11 | 146.76 |
| 1 | 168 | 1373.04 | 0.481 | 121.78 | 114.9 |
| 2 | 180 | 1395.62 | 0.398 | 76.64* | 87.31 |
| 3 | 190 | 1408.56 | 0.252 | 50.74 | 62.99 |
| 4 | 198 | 1419.02 | 0.209 | 29.83 | 42.44 |
| 5 | 204 | 1426.04 | 0.146 | 15.8 | 25.32 |
| 6 | 208 | 1431.02 | 0.106 | 5.82 | 12.25 |
| 7 | 210 | 1433.94 | 0.063 | ||
*Cut off point.
7. Results for tests of structural break
The procedure of Clemente, Montañes and Reyes (CMR) (1998) tests whether there is a unit root under an unknown structural break, that is identified optimally. The structural break is modelled either as an additive outlier or as an innovational outlier, while one and up to two optimal breaks may be allowed in estimation. The test was performed over the data in first difference of log units. Table 5 shows that the CMR test detects structural breaks for periods post Covid 19 in two out of four tests, however, the structural breaks are not statistically significant at the 5% level. In the case of the data in the first difference of the seasonally difference of log units, the CMR test detects structural breaks in two out of four tests, this time the breaks are significant at the 10% level.
Table 5 Tests for structural break, all data in log units
| Test | Data set | T-Stat | Optimal breaks |
Additive Outlier |
Innovational Outlier |
| Clemente-Montañes-Reyes (1998) | First difference | -0.17 | 2018m1, 2018m5 |
No | Yes |
| FD of Seasonal 12th difference | 2.27** | 2020m2, 2020m6 |
No | Yes | |
| Clemente-Montañes-Reyes (1998) | First difference | 1.35 | 2018m4 | No | Yes |
| FD of Seasonal 12th difference | 1.83* | 2020m2 | No | Yes | |
| Clemente-Montañes-Reyes (1998) | First difference | 1.28 | 2019m1, 2020m1 |
Yes | No |
| FD of Seasonal 12th difference | 0.51 | 2016m9, 2020m1 |
Yes | No | |
| Clemente-Montañes-Reyes (1998) | First difference | 0.55 | 2020m12 | Yes | No |
| FD of Seasonal 12th difference | 0.47 | 2020m1 | Yes | No | |
| Hms | |||||
| Wagner-Wied (2017) | First difference | 0.3945a | 2020m4 | NA | NA |
| FD of Seasonal 12th difference | 0.2379a | 2020m4 | NA | NA | |
*10 % significance, **5% significance, a Greater than an estimated value of .22 for the Hms statistic obtained from Table I from Wagner & Wied (2017)
The test of Wagner and Wied (2017) monitor the cointegration relation that exists during a period where structural breaks are suspected to have occurred. The test is performed also over the data in first difference and for the first difference of the seasonal difference of log units. The tests attempt to monitor if a change in the cointegration relation is detected, once the sum of the squared of the estimated residuals diverge above the long run variance, which is estimated for a period where no structural break is assumed to occur. We use as the comparison point the period between 2014 and below 2020. Exploratory analysis detected potential structural breaks during 2013 and we decided to focus attention in the post 2013 period. The Wagner-Wied test shows that the structural break took place in 2020m4. These results add to the evidence obtained from the CMR tests that a structural break took place during the Covid 19 period.
8. Results for estimated VEC models
Given the above results, we proceed to estimate two different VEC systems, one for the pre-COVID 19 period and a second one including the COVID 19 period. Ideally, a different VEC could have been estimated for the Covid 19 period, however, there are not enough observations at this moment to attempt such estimation. All variables are used as the first difference or as the first difference of seasonally differenced data in log units.
Table 6 shows the coefficients for the different VEC estimations for the remittances equation. Four estimations are performed, for the first difference data and Pre Covid 19 period, the FD of the seasonally differenced data and Pre Covid 19 period, the first difference data including the Covid 19 period, and the FD of the seasonally differenced data including the Covid 19 period.8
Table 6 Coefficients for the Remittances equation in VEC estimations, log units data
| Pre Covid 19 | Including Covid 19 | |||
| First Difference |
12th Seasonal Difference |
First Difference |
12th Seasonal Difference |
|
| Coint. Eq. 1 | -1.24*** | -2.02*** | -1.43*** | -1.08*** |
| -0.37 | -0.52 | -0.27 | -0.23 | |
| Coint. Eq. 2 | 0.32** | -0.07 | 0.19** | -0.06*** |
| -0.12 | -0.06 | -0.06 | -0.02 | |
| LD.Remittances | -0.28 | 0.85* | -0.05 | 0.59* |
| -0.35 | -0.42 | -0.23 | -0.28 | |
| L2D.Remittances | -0.35 | 0.34 | -0.13 | 0.36 |
| -0.28 | -0.32 | -0.19 | -0.27 | |
| L3D.Remittances | -0.02 | -0.02 | 0.08 | 0.19 |
| -0.17 | -0.21 | -0.12 | -0.18 | |
| LD.USGDP | -0.24* | 0.11 | -0.18** | 0.08 |
| -0.11 | -0.06 | -0.07 | -0.04 | |
| L2D.USGDP | -0.11 | 0.06 | -0.11 | 0.08* |
| -0.08 | -0.06 | -0.06 | -0.04 | |
| L3D.USGDP | 0.02 | 0.01 | 0.01 | 0.06 |
| -0.05 | -0.05 | -0.04 | -0.04 | |
| LD.MXGDP | 3.01* | 5.40*** | 3.91*** | -0.87* |
| -1.32 | -1.55 | -0.87 | -0.44 | |
| L2D.MXGDP | 2.46** | 4.11** | 2.97*** | 0.1 |
| -0.95 | -1.38 | -0.7 | -0.45 | |
| L3D.MXGDP | 0.54 | 1.57 | 0.58 | -0.08 |
| -0.59 | -0.89 | -0.47 | -0.39 | |
| LD.NominalER | 0.35 | -1.26* | 0.66 | -1.24*** |
| -0.51 | -0.54 | -0.38 | -0.34 | |
| L2D.NominalER | 0.19 | 0.26 | 0.74 | 0.47 |
| -0.42 | -0.41 | -0.38 | -0.36 | |
| L3D.NominalER | -0.38 | -0.04 | 0.24 | -0.31 |
| -0.45 | -0.42 | -0.37 | -0.35 | |
| LD.InterestRD | -0.07 | -0.28 | 0.3 | -0.19 |
| -0.36 | -0.25 | -0.29 | -0.19 | |
| L2D.InterestRD | -0.32 | 0.03 | 0.11 | 0.05 |
| -0.4 | -0.26 | -0.34 | -0.21 | |
| L3D.InterestRD | -0.38 | -0.17 | -0.08 | -0.11 |
| -0.35 | -0.27 | -0.29 | -0.21 | |
| LD.USWage | 0.76 | 3.09 | 13.63*** | -2.18 |
| -4.11 | -3 | -3.07 | -1.78 | |
| L2D.USWage | -1.99 | 3.21 | 10.20*** | -0.63 |
| -4.22 | -3.25 | -2.65 | -1.99 | |
| L3D.USWage | -6.71 | 5.58 | 3.52 | 0.48 |
| -3.74 | -3.37 | -1.92 | -1.91 | |
| LD.MXWage | 0.49 | -0.16 | 0.17 | -0.2 |
| -0.51 | -0.43 | -0.3 | -0.41 | |
| L2D.MXWage | 0.43 | -0.15 | 0.86* | -0.1 |
| -0.52 | -0.44 | -0.36 | -0.4 | |
| L3D.MXWage | 0.11 | -0.1 | 0.4 | -0.48 |
| -0.39 | -0.39 | -0.31 | -0.35 | |
| R2 | 88% | 62% | 90% | 66% |
| N | 72 | 72 | 89 | 89 |
| AIC | -29.33 | -30.78 | -26.44 | -27.19 |
| SBIC | -23.7 | -20.15 | -21.4 | -22.21 |
*Significant at 10%, **Significant at 5%, *** Significant at 1%.
Table 6 presents the results for the remittances equation from the four estimated VECs. The first column shows that the two cointegration equations are statistically significant. Also, the first column presents the short run parameters where it is found a negative relation between the US GDP and remittances, which contrasts with our previous result in the linear model where no relation was found. The short run parameters for Mexico’s GDP are positive and significant, which confirms our previous result in the linear model. The nominal exchange rate is found to be non-statistically significant which also contrasts with the linear model where a positive relation was found. We also find that the coefficients for the US wage are not statistically significant which contrasts with our linear model where a negative relationship was found. So basically, this negative relationship was substituted by the negative relationship found between remittances and the US GDP.
The second column presents the results for the first difference of the seasonally differenced data. Only the first cointegration equation is statistically significant. Past values of remittances are statistically significant and positive, which is indicative of dynamic effects perhaps due to social networks effects or due to reductions in costs of remittance reception. The US GDP is not statistically significant. The Mexican GDP is statistically significant again. The nominal exchange rate is found negative and statistically significant, which coincides with the linear OLS model. No other variable is found statistically significant. It is important to notice that the AIC and SBIC show smaller numbers for this 12th differenced data model, so it implies that the seasonally differenced data is better represented by the model, than the first differenced data.
The third column shows the results for the first differenced data including the Covid 19 period. The two cointegration equations continue to be statistically significant. The US GDP and the Mexico GDP continue to be statistically significant. However, now the US wage and the Mexico wage become positive and statistically significant. These results show changes in the short run parameters of the remittances equation.
The fourth column shows the results for the first difference of the seasonally differenced data. The two cointegration equations are now statistically significant, which contrasts with what was found in the Pre Covid data. The US GDP is found positive and statistically significant, which contrast with the results Pre Covid, when no relation was found. The Mexico GDP is found negative and statistically significant, which contrast with the pre Covid data, where it was found positive. The nominal exchange rate is found negative and significant, which coincides with the pre Covid data. No other coefficient is found statistically significant which contrasts with the pre Covid data where the US and Mexico wage were found significant. The AIC and the SBIC show smaller numbers for this model, versus the first differenced data. These results imply that our preferred results are those obtained with the seasonally differenced data.
Table 7 presents the results for the long run coefficients for the two cointegration equations, only for the FD of the seasonally differenced data for the Pre Covid period and the data including the Covid period. The coefficient for the Mexican GDP goes from positive to negative in the first cointegration equation between the Pre Covid and the data including the Covid period. The coefficient for the nominal exchange rate goes from non-significant to positive in the second cointegration equation, between the pre Covid and the data including the Covid period. The coefficient for the interest rate now goes from negative to non-significant in the first cointegration equation between the Pre Covid and the data including the Covid period. The coefficient for the Mexico wage goes from non-significant to negative and significant in the first cointegration equation. These results demonstrate that there were changes both in the short run parameters and the long run parameters.
Table 7 Cointegration Equations, First difference of the seasonally differenced data in log units
| Pre Covid 19 | Including Covid 19 | |||
| Eq. 1 | Eq. 2 | Eq. 1 | Eq. 2 | |
| D.MXGDP | 3.13*** | 0.29 | -0.72** | -0.35 |
| [0.49] | [4.75] | [0.32] | [4.68] | |
| D.NominalER | -0.74*** | 0.53 | -0.32** | 10.85*** |
| [0.12] | [1.11] | [0.15] | [2.26] | |
| D.InterestRD | -0.03** | -0.32** | -0.01 | -1.35*** |
| [0.01] | [0.13] | [0.04] | [0.53] | |
| D.USWage | 1.67*** | -11.98** | 2.93* | -104.33*** |
| [0.56] | [5.38] | [1.62] | [23.74] | |
| D.MXWage | -0.02 | -3.37*** | -0.86*** | 9.44*** |
| [0.09] | [0.86] | [0.23] | [3.37] | |
| X2 | 117.5*** | 75.4*** | 117.5*** | 75.4*** |
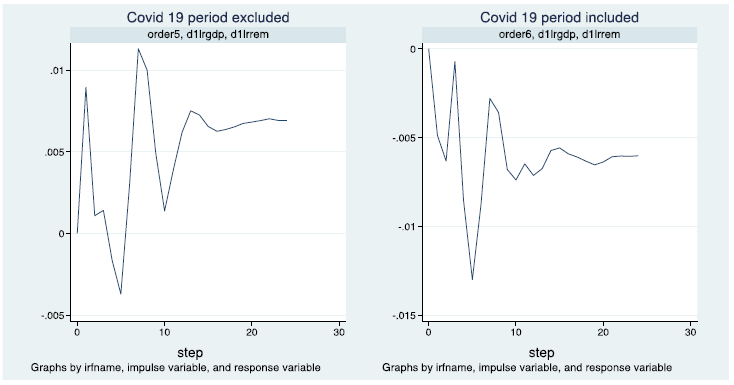
We now show the Orthogonalized Impulse Response Functions (OIRF) for the equation of the remittances. We want to explore what are the implications of the Covid 19 period for predicted innovations in the different variables of the model, so we will present the OIRF for pre Covid period and the data including the Covid period.
Graph 2 shows the OIRF for the expected response in the reception of remittances to one innovation occurring in US GDP. The Graph clearly shows that in the Pre-Covid 19 period remittances were a normal good, while they become an inferior good during the pandemic. This probably shows that providing remittances during the pandemic became a necessity and it was no longer a luxury good that senders could afford.
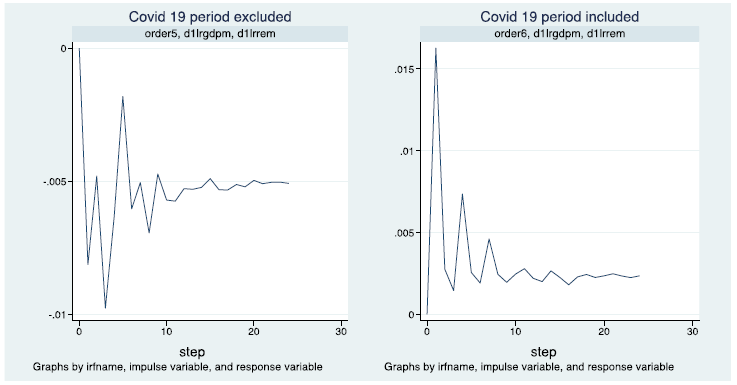
Graph 3 shows that the relation between remittances and Mexico’s GDP changed due to the pandemic. Before the pandemic, a positive innovation in Mexico’s GDP would increase remittances, showing the investment motive. Post pandemic, a positive innovation in Mexico’s GDP would reduce remittances, showing the logic of the risk sharing argument.
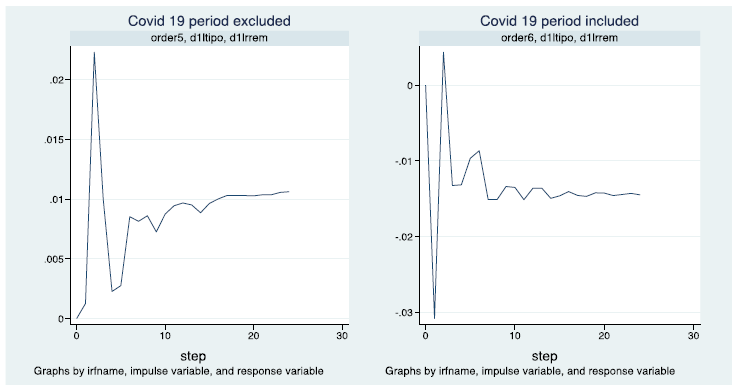
Graph 4 shows that the response to one innovation in the exchange rate went from positive to negative. When the sign was positive, this showed the logic of the investment argument, while when a negative sign is observed the logic of the risk sharing argument, i.e. when the purchasing power of remittances in pesos raises there is less need to send remittances. Notice that the altruistic hypothesis would probably imply also a positive sign of the exchange rate.
Graph 5 presents the response to one innovation in the interest rate differential. The sign goes from positive to negative. Notice that the positive sign is consistent with the portfolio motive, while a negative sign is consistent with a risk sharing argument, complemented with incentives: if household members in Mexico save, an increase in the interest rate would increase the return to the their savings and they will require less remittances, but if the household members in Mexico are indebted, then a reduction in remittances would punish household members for the contracted debts.

Graph 6 shows the response to innovations in the US wage. While the sign remains negative, it becomes smaller in the Covid 19 period. This result may indicate two things: first, that altruistic consumption is not proportional to the wage per hour and perhaps it is a fixed amount and consequently declining on the wage per hour; second, it may indicate that during the Covid 19 period sending remittances becomes a necessity depending less on the preferences of the sender, and consequently becomes a response converging towards a negative number, which is consistent with what was found in the relation between the US GDP and remittances.

Graph 7 presents how remittances respond to innovations in Mexico’s wage. It is negative and bigger during the period previous to the Covid 19. The sign is consistent with the idea of the risk sharing argument. The reduction in the sign, probably shows that the behavior of wages in Mexico became less important, probably because less households that receive remittances have less members working in Mexico.

In general, the results manifest the reduction of the investment motive, as well as the reduction in the altruistic motive and a raising importance of the risk sharing argument, since, in general, coefficients tended to show responses that would show reductions in remittances when there is less need for them and increases in remittances when there is more economic need for them.
9. Conclusions, recommendations, and final considerations
With the arrival of the COVID-19 pandemic, a collapse in remittances from Mexicans was predicted due to the suspension of economic activities in the United States and its impact on unemployment and income of Americans; however, the reality was different, since remittances increased significantly during 2020, because Mexicans have not only managed to keep their jobs, but also the amount of money they sent to their families increased.
This paper seeks to show the impact of the Covid19 pandemic on remittances from the United States to Mexico. Our results provide evidence that the COVID-19 pandemic changed the long run and the short run relations that remittances held with the different variables that explained them. Before the Covid 19 pandemic, there is evidence in favor of the altruistic motivation to send remittances, as well as for the investment and risk sharing motives. During the Covid 19 pandemic, there is evidence that remittances have become more a necessity relying less on the preferences of individuals and reducing the investment motivations. Consequently, there is evidence in favor that the risk sharing argument is dominating the dynamics of the flow of remittances.
A first limitation of our results is that they do not show what occurs for each remittance corridor that exists between Mexico and the United States, since they may present heterogeneous behaviors. However, while the data for Mexico is disaggregated by Mexican state, the reception of remittances is aggregated from all origins, which does not allow to separate out between remittance corridors. This heterogeneity may be important because of the differences in occupations, migratory status, and time of residence that Mexicans may have, which most likely varies according to the US region where they reside.
A second limitation of this study is that it does not control for the number of Mexicans that reside in the US. This was done mainly because of lack of data since a reliable source for monthly information on the Mexicans that reside in the US does not exist. Our only options for annual data are the March Current Population Survey, which realizes an oversample of the US population and can find Mexican immigrants, and the American Community Survey, which also provides an annual estimation of the Mexico born population residing in the US. An option could be the use of interpolated data using both the monthly CPS and the American Community Survey, however, we considered that a monthly estimation of the Mexico born population residing in the US was outside the scope of this paper.
These results also manifest the need for further research to better understand why there is evidence of lower incentives for sending remittances for investment and altruistic reasons, also to understand the effects that the increase for remittances due to risk sharing reasons could generate, including if such changes may be explained by changes in the characteristics of the individuals that send remittances, or for changes in the characteristics of the individuals that receive remittances. Similarly, whether these changes in the motivations to send remittances may affect the usage of remittances, as well as the consequences for income distribution within the household, between households, within and between regions.
Further analyses are also needed to fully comprehend the scale of the pandemic and its effects on migration, household’s expenditures and household’s portfolio choices.

