


 nova página do texto(beta)
 Inglês (pdf)
 Artigo em XML
 Referências do artigo
 Enviar este artigo por email
 Citado por SciELO
  Similares em
SciELO
Similares em
SciELO 
 Permalink
1. Introduction
Sustainability has become a macrotrend for organizations worldwide since the UN Global Compact initiative was launched in 2000 in an attempt to encourage businesses to adopt sustainable and socially responsible policies, and to report on their implementation. Two years later, the World Summit on Sustainable Development held in Johannesburg set out key strategies to try to achieve the Sustainable Development Goals (SDGs), encouraging firms to measure and manage their sustainable performance. Hence, the term sustainable firm provides coherence between a firm’s value and its Corporate Social Responsibility (CSR), integrating internal factors and taking into consideration all of a firm’s stakeholders when designing business strategies (Cruz, 2018), as opposed to the conventional shareholder-oriented management.
Although CSR refers to an organization’s responsibility for the impacts of its activities on the society and the environment, but it also focuses on a firm’s value generation. On the other hand, sustainable value generation consists of three dimensions: economic, social and environmental, known as Elkington's dimensions in the Triple Bottom Line (TBL) model (Elkington, 2006). The firm is therefore conceived as an agent that generates economic value, altogether with social and environmental value by aligning the interests of stakeholders. Profit maximization is no longer the predominant aim, but it rather converges with social and environmental goals to generate corporate efficiency. Sustainable value is a way of managing and measuring the sustainability performance of firms. In this paper, the term “sustainable value” is used alternatively to ESG ratings.
To date, a large amount of empirical literature has examined corporate efficiency to measure its impact on the profitability of sustainable firms (Alonso-Armeida, Rodríguez, Aimer, & Abreu, 2012; Arteaga, & Ponce de León, 2018; Botero, Garnica & Soto, 2013; Drucker, 1984; De la Torre, Galeana & Aguilasocho, 2015; Friedman, 1970; Ki-Hoom & Reza, 2011; Porter & Kramer, 2011). However, given the wide range of efficiency metrics, it makes it difficult to determine a general relationship regarding this issue and using a single metric fails to capture potential CSR implications (Xie, Nozawa, Yagi, Fujii & Managi, 2019). A second group of studies evaluated corporate efficiency in terms of sustainability, creating local, regional or international rankings (Sánchez, Parra & Udi, 2014) in order to identify the most sustainable firms. Whereas a third group examined efficiency in terms of market value and financial factors (Walker, Zhang & Yu, 2016; Xie et al., 2019). A last group developed models for measuring CSR performance (Wood, 2010; Cruz, 2018). However, most of these studies focus on the firm´s strategies to increase their profits, without considering the generation of sustainable value for the company.
Thus, the objective of this research is to determine corporate efficiency by empirically analyzing sustainable value indicators (ESG scores) based on profitability. For a firm, it is essential to know the value of such indicators in order to provide corporate decision making actors with information that allows the implementation of sustainable and competitive strategies to meet the organization’s internal goals and to get listed on the sustainability indexes of any given Stock Exchange.
Moreover, socially responsible investment has increased dramatically worldwide in the past decades (Xie et al., 2019) and investors with intrinsic social preferences are more likely to hold socially responsible funds, rather than conventional funds of higher financial performance (Riedl & Smeets, 2017). So, investors now demand tools that allow them to select companies that in the long term, invest on risk management to face the challenges of sustainability. Also, for any given profitability level, stakeholders may be able to decide what firms they want to support, based on the ESG activities such firms perform.
What we propose is that, if companies standardize their management processes through corporate governance, they will become more sustainable efficient. This work seeks to prove, by a DEA analysis, that corporate governance indicator is the ESG indicator that mainly strengthens the efficiency of large sustainable firms in Mexico.
We have contributed to the existing literature in two aspects. First, we found that the indicator that has the greatest impact on sustainable value generation, is corporate governance. When a company generates sustainable value, it follows enviromental, social and corporate governance practices that can be rated by ESG agencies. Second, the innovation of using profitability as input of the DEA model allows to compare firms’ efficiency, regardless of the sector they belong to.
This paper proceeds as follows. Section 2 presents a systematized review of the existing literature on CSR conceptual references, followed by a review of both the TBL and DEA methodologies. Section 3 explains the methodological considerations of the research and the efficiency model of firms that underpins this work. Section 4 presents the empirical results and discussion. Section 5 presents the conclusions and final considerations of the research.
2. Literature review
2.1. Corporate Social Responsibility
Corporate Social Responsibility (CSR) was formally defined when Bowen (1953) stated that firms do not only sell goods and products, but also "social goods". So, firms must follow desirable lines of action in terms of the society’s objectives and values. Carroll (1979), on the other hand, suggested that the motivation to follow such lines of actions was not measurable, so he chose the term "profitability” instead. Carroll used a four-level structure of basic responsibilities to society -economic, legal, ethical and discretionary- to build his CSR model (1979). From that date to present, the concept of CSR has evolved and its dimensions have increased. However, the social and environmental dimensions prevail, as stated in the Green Book’s definition, where Corporate Social Responsibility (CSR) is defined as “a concept whereby companies integrate social and environmental concerns in their business operations and in their interaction with their stakeholders on a voluntary basis, as they are increasingly aware that responsible behavior leads to sustainable business success” (European Commission, 2001).
Garriga and Melé (2004) grouped CSR theories into four categories: 1) instrumental theories, in which the corporation is seen only as an instrument for wealth creation, and its social activities are only a means to achieve economic results; 2) political theories, concerned with the power of corporations in society and a responsible use of this power in the political arena; 3) integrative theories, focused on the satisfaction of social demands by corporations; and 4) ethical theories, based on ethical responsibilities of corporations to society. Even though numerous efforts have been made to integrate these four dimensions, no consensus has been reached yet. Dahlsrud (2008) used frequency counts and found that CSR existing definitions were congruent and developed five dimensions of CSR (environmental, social, economic, stakeholder and voluntariness). Therefore, the author concluded that the main difficulty in implementing the CSR in firms was not so much about how CSR was defined, as about understanding that CSR is the result of a social construction in a specific context and how such a context must be taken into account for the development of business strategies (Dahlsrud, 2008). Furthermore, according to the theory of well-being, CSR is defined as the obligation of a company to meet the externalities created by market shares (Sethi & Sama, 1998).
For Drucker (1993), business responsibility to society was to find valid solutions to basic social problems that fitted their share. However, for Friedman (1970), the creator of the monetarist theory, there is one and only one social responsibility of business: to use its resources and engage in activities designed to increase its profits. Friedman stated that getting good results was the first responsibility of business, before it could perform any other responsibility. Following this reasoning, a large number of businesses still envision their policies towards generating economic value, before assuming any other responsibilities, such as social and environmental. Nevertheless, businesses are aware now that they must be responsible for all the impacts their decisions and actions have on society and the environment (ISO 26000, 2011).
It is in the 21st century when the economic dimension takes on a relevant role in CSR concepts. According to Wood (2010), financial performance (FP) is directly related to CSR, and to measure that performance she proposed a Corporate Social Performance Model (CSP). Wood recognized some measurement issues, but concluded that a good performance in CSR indicators, results in better financial outcomes for a business, whereas poor performance will most likely cause it financial damage. On the one hand, there is a reasonably well-established relationship between CSR and FP (Wood, 2010). Such relationship is positive, but weak (Margolis & Walsh, 2001; Orlitzky, 2003).
For Porter and Kramer (2011) CSR is a differential source of competitive advantage that has already meant economic benefits for large companies, since using bad environmental, social and corporate practices have resulted in serious economic biases. Also, adopting CSR disclosure practices by several communicational channels has influence over financial performance and corporate reputation, while promoting strong relationships with partners (Valenzuela, Jara-Bertin & Villegas, 2015).
Similarly, Walker, Zhang and Yu (2016) studied large companies belonging to the US CompStat and found that increases in CSR were directly related to firms’ performance, improving their profitability, efficiency and market value. Moreover, Heufemann’s (2013) study of the financial-accounting performance of a group of companies that incorporated sustainability practices into their businesses along the period 1992-2010 showed that markets are aware of the fact that companies which integrate sustainability practices into their business strategies are better prepared to thrive in uncertain market conditions. In Mexico fims listed on the Mexican Stock Exchange showed a positive relationship between financial perfomance (measured by the financial variables ROE, ROA, earnings per share, and Tobin’s Q ratio) and the CSR certification (Alonso-Almeida et al., 2010). Nevertheless, a study of the efficiency of sustainable investment practices in Mexico for companies listed on the Sustainable Index, proved that firms that hold a CSR certification report only a slightly better return on short term investment versus other firms of the same sector that do not hold a CSR certification (De la Torre et al., 2015). Despite the fact that the relationship between CSR and financial performance has been a stream of research largely studied, results are not conclusive.
In contrast, the approach proposed in this study is to determine to what extend profitability leads to the generation of sustainable value and which indicators might have the greatest relevance on corporate efficiency.
2.2. Sustainable value: valuation of companies using the triple bottom line
Given the technological, economic and financial advances demands for companies to constantly adapt at and innovate, firms must ensure that their organizational goals add value and provide long term sustainable results.
In recent decades, a trend to generate sustainable value has been observed among world class companies, as a value aggregation strategy. Sustainable value is defined as the process to determine, use and exchange qualities by business management in a triple results account (Cruz, 2018). Triple bottom line (TBL) is as a framework for measuring and reporting the performance of a company on 3 dimensions a framework that recommends companies to engage on social and environmental concerns just as much as they do on profits, introducing performance at three levels: social, economic and environmental (Elkington, 2006). Sustainability strategies range from voluntarily participation in sustainable activities, to integrating ESG policies and activities in a firm’s strategic plan.
TBL Sustainability Reports link the agenda of sustainable development to large firms’ business opportunities worldwide and are mainly built to better understand and analyze environmental, social and corporate governance risks. Such analyses are committed to the principles of the UN Global Compact initiative and to the Sustainable Development Goals (SDGs), the objectives of sustainable development, shifting the focus on traditional competitiveness strategies and market analysis, to strategies where companies integrate stakeholders and the triple bottom line (Elkington, 2006; Keinert, 2008; Raufflet, 2012).
There are other methodologies for assessing compliance with sustainability practices that companies communicate through sustainability reports, which are legitimized by international institutional and business initiatives to promote the adoption of sound principles of corporate social responsibility. These reports are based on information transparency and formal standards for their implementation. Large sustainable companies, for instance, use the Global Reporting Initiative methodology (GRI, 2015) to comply with parameters established by several Stock Exchanges. In order to propose a framework to evaluate sustainable value of companies other internationally recognized methodologies were reviewed, such as the ISO 26000 (2011), SDG Compass (2014) and P5 from GPM Global (2017). Figure 1 shows and the three dimensions and components of our proposed evaluation framework.
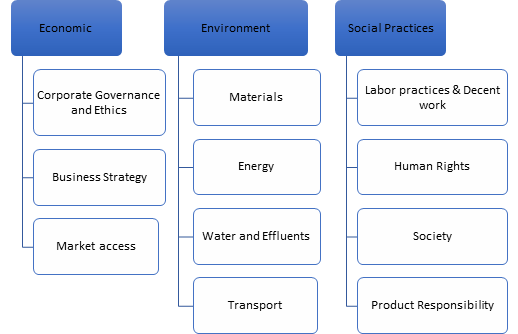
Source: Authors, based on ISO 26000 (2011), SDG Compass (2014), P5 from GPM Global (2017) and GRI G4 (2015).
Figure 1 Dimensions of sustainable value, according to the TBL approach
In Mexico, companies listed on the Mexican Stock Exchange and the ones that qualify to belong to the Sustainable Index use TBL reporting. The Sustainable Index groups companies that have proven high performance in terms of their sustainable value, based on environmental, social and corporate government criteria. By doing so, these companies demonstrate the degree of commitment and actions taken towards sustainability (BMV, 2018). All these companies conform the sample used in this research.
2.3 Theory of Efficiency and Data Envelopment Analysis (DEA)
The theory of efficiency started out in 1951 with Koopmans and Debreu´s studies related to the use of business resources and the analysis of production. Later, Farrell (1957) successfully measured productive efficiency to measure the efficiency of the business function. According to Farrell (1957), efficiency measurement is not absolute, but relative, and the results is expressed as an observed deviation from efficient units (Gómez-Monge, 2012). Farrell divided the efficiency into two components: technical and allocative, and global effiency is equal to the product of these two components. Technical efficiency shows the capacity of a production unit to obtain the maximum number of achievable products (outputs) from a set of factors (inputs) used in the process. Whereas allocative efficiency is the level of output where the price of a good or service is equal to the marginal cost of production (Navarro, Gómez-Monge and Torres, 2016). Farrell's initial model specifically measures production efficiency. However, when analyzing a production process with a structure of multiple inputs and outputs, it is not possible to determine an optimal efficiency point. This is why the Data Envelopment Analysis (DEA) approach introduced by Charnes, Cooper and Rhodes (1978) is used to to measure sustainable efficiency, since this multicriteria method measures the relative efficiency of decision-making units (DMUs) that are characterized by multiple inputs and outputs. It is based on linear programming for the estimation of efficient frontiers and its results rely heavily on the set of criteria used in the analysis. Therefore, one of the most important stages in the DEA is the selection of criteria.
Data Envelopment Analysis (DEA) is a non-parametric method since it does not require a functional relationship between inputs and outputs. Figure 2 shows a DEA graphic representation, with the efficient DMUs located within the envelopment surface. Each firm’s efficiency score is calculated relative to an efficiency frontier. Firms located on the efficiency frontier have an efficiency score of 1 (or 100%). Firms operating beneath the frontier are considered inefficient, with a score inferior to 1 (or 100%) and hence have the capacity to improve future performance. This tool is used for benchmarking, since firms located on the frontier serve as benchmarks to inefficient firms. These benchmarks (i.e. real firms with real data) are associated with best practices (Huguenin, 2012). Hence, the efficient DMUs may lead to a “best practice frontier”.
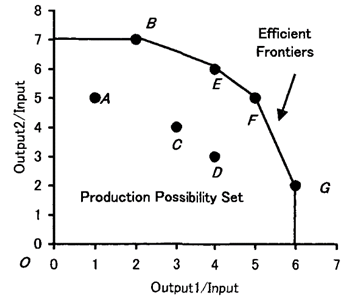
Source: Data Envelopment Analysis by Cooper, Seiford and Tone (2006)
Figure 2 DEA efficiency model graphic
Charnes and others (1978) classifies DEA models according to:
the type of efficiency measure they provide: in radial and non-radial;
the orientation of the model: input-oriented or output-oriented;
the type of scale performance that characterizes production technology: constant returns to scale or variable.
Models with radial efficiency measures are used to analyze the effect of input and output. In DEA, we have two measures of efficiency with different characteristics; radial and non-radial. Historically, the radial models, represented by the CCR model (named after its authors: Charmes, Cooper and Rhodes) assume convexity, strong free disposal of inputs and outputs, and constant returns to scale. In the input-oriented case, the CCR deals mainly with proportionate reduction of input resources. In contrast, the non-radial models put aside the assumption of proportionate contraction in inputs and aim at obtaining the maximum rate of reduction in inputs that may discard varying proportions of the original input resources (Avkiran, Tone & Tsutsui, 2008).
Input-oriented DEA models minimize input for a given level of output. This indicates how much a firm can decrease its input while remaining at the frontier of production possibilities for a given (fixed) level of output. A DMU is not considered efficient if it is possible for it to decrease any input without altering its outputs. On the other hand, output-oriented models maximize output for a given level of input, remaining within the frontier of production possibilities.
Types of DEA which address varying returns to scale, evaluate the efficiency of a set of DMUs as Constant, Increasing, or Decreasing returns to scale. Constant returns to scale (CRS) occur when outputs increase proportionally to growth of used inputs. A DMU is said to operate at increasing returns to scale (IRS) if a proportionate increase in all of its inputs results in a greater than proportionate increase in its outputs (economies of scale). Conversely, a unit is said to operate at decreasing returns to scale (DRS) if a proportionate increase in all of its inputs results in a less than proportionate increase in its outputs (diseconomies of scale).
The basic output-input oriented CCR DEA model which provides radial measurement (Charnes et al., 1984) is as follows:
Subject to
where:
This model considers that all variables must be positive values, with a population of n productive units (DMUs), each unit produces s outputs while consuming m inputs. The dependent variable, is y, and x is the independent variable (Vincova, 2005). Likewise, this model seeks to determine the most efficient unit (or units) that will serve as benchmarks to inefficient units (lambdas). It also allows to determine the input factors that maximize the outputs of the inefficient units from the identified gaps (slacks) between the efficiency frontier and the DMU.
We decided to use a basic CCR input-oriented DEA model with constant returns to scale because it allows a proportionate reduction of input resources while maximizing outputs. In our case we aim at generating maximum sustainable value from minimum levels of profitability. By keeping profitability values constant, firms can be standardized and results of sustainable levels may be then compared, regardless of the sector the company belongs to.
DEA model has been intensively used to calculate efficiencies in very different fields, both in theoretical and empirical works. DEA was used to measure corporate sustainability for the specific case of a Korean company (Ki-Hoom & Reza, 2011); also, corporate efficiency was empirically measured on the basis of ESG scores against ROA and Tobin's Q ratios (Xie et al., 2019). In both studies, models for assessing corporate efficiency were designed to determine how sustainable value practices (ESG) are related to corporate efficiency. The former study determined efficiency with indicators from fundamental analysis data, and the latter with a combination of results derived from technical, fundamental analysis and ESG value estimates.
Due to the lack of a standardized measurement that takes into account all the efforts businesses make to generate sustainable value, we intend to achieve a standardized estimation of corporate efficiency of sustainable firms in Mexico with the objective of identifying the efficiency factors with the strongest weight.
3. Methodology
To estimate corporate efficiency, we applied DEA, a multivariable estimation method widely used to evaluate the efficiency of firms and utilities (Xie et al., 2019). We applied the input‐oriented model by minimizing inputs, as shown in Equation (1), where xi denotes inputs, including ROA, ROE and ROS and yr denotes outputs, namely ESG scores.
Profitability ratios (ROA, ROE, ROS) for each firm were calculated using financial statements. ESG scores were taken from Yahoo! Finance. The selected DMUs used similar parameters to measure the inputs for generating equal or similar outputs.
3.1 Sample, hypothesis and variables
The selected sample for this study, consisted of 18 domestic and foreign firms listed on the Mexican Stock Exchange and which qualify to be part of the Sustainable Index and their correspondent 72 Annual Sustainability Reports for the 2014-2017 period. These firms provide public information on their social, environmental and corporate governance (ESG) performance through the Yahoo! Finance website with data provided by Sustainalytics, Inc.1 Table 1 shows the list of the 18 companies studied.
The hypothesis presented in this research is as follows: Corporate governance has the strongest weight when determining corporate efficiency, since it becomes a transversal axis to regulate its business strategies.
Table 1 CSR firms listed on the Sustainable Index of Mexican Stock Exchange
| Nº | List issuers | Company name | Sector |
|---|---|---|---|
| 1 | AC | Arca Continental, SAB de CV | Consumer Staples |
| 2 | ALFA | Alfa, SAB de CV | Industrial |
| 3 | AMX | America Mobil, SAB de CV | Telecom |
| 4 | BIMBO | Bimbo, SAB de CV | Consumer Staples |
| 5 | CEMEX | Cementos Mexicanoss, SAB de CV | Materials |
| 6 | FEMSA | Fomento Economico Mexicano, SAB de CV | Consumer Staples |
| 7 | GFNORTE | Grupo Financiero Banorte, SAB de CV | Financial |
| 8 | GMEXICO | Grupo Mexico, SAB de CV | Materials |
| 9 | KIMBER | Kimberly Clark de Mexico, SAB de CV | Consumer Staples |
| 10 | MEXCHEM | Mexchem de Mexico, SAB de CV | Industrial |
| 11 | PE&OLES | Industrias Peñoles, SAB de CV | Materials |
| 12 | SAN. MX | Grupo Financiero Santander, SAB de CV | Financial |
| 13 | TLEVISA | Grupo Televisa, SAB de CV | Telecom |
| 14 | WALMEX | Walmart de Mexico, SAB de CV | Basic-Consumer Discretionary |
| 15 | LIVERPOL* | El Puerto de Liverpool, SAB de CV | Non-basic Consumer Discretionary |
| 16 | GCARSO* | Grupo Carso, SAB de CV | Industrial |
| 17 | GFINBURO* | Grupo Financiero Inbursa, SAB de CV | Financial |
| 18 | GRUMA* | Gruma, SAB de CV | Consumer Staples |
Source: Authors, from BMV data over the period 2014- 2017.
* Firms that do not belong to the Sustainable Index, but do have ESG scores.
Variables
Based on the research hypothesis, the dependent variable was sustainable value and the independent variable was profitability, as Figure 3 shows.
Independent Variable
Financial ratios ROE, ROA and ROS were used in order to determine a firm’s profitability, as shown in Table 2. Calculated values are shown in Table 4.
Table 2 Performance indicators of the independent variable
| Variable | Ratio | Formula (indicator) |
|---|---|---|
| Profitability | Return on equity (ROE) |
|
| Return on assets (ROA) |
|
|
| Return on sales (ROS) |
|
Source: Authors, based on García (2015)
Dependent Variable
The dependent variable was Sustainable Value, and its performance indicators were: Corporate Governance (G), Environmental Performance (E) and Social Performance (S). The conceptual definitions are shown in Table 3. Calculated values are shown in Table 5.
Table 3 Dimensions of the Dependent Variable: Conceptual Definitions
| Variable | Indicator | Conceptual Definition |
|---|---|---|
| Sustainable Value | Corporate Governance (G) | It is a mechanism that regulates relationships between shareholders, directors and the management team of a company, through the definition and separation of strategic, operational, surveillance and managerial roles. |
| Environmental Performance (E) | It refers to the natural environment in which an organization operates, and includes the company's impacts related to supplies and products. It focuses on: biodiversity, transport, the impact of products and services on the environment, as well as environmental compliance and expenditure. | |
| Social Performance (S) | It refers to the impact a company has on the social systems where it operates. This category includes: work and decent work practices, human rights, community and product responsibility. |
Source: Authors, based on Aguiñaga (2011), ISO 26000 (2011), GRI (2018).

Table 4 Input variables: Profitability indicators of Sustainable Index firms
| List Issuer | 2014 | 2015 | 2016 | 2017 | ||||||||
|---|---|---|---|---|---|---|---|---|---|---|---|---|
| ROA | ROE | ROS | ROA | ROE | ROS | ROA | ROE | ROS | ROA | ROE | ROS | |
| AC | 8% | 15% | 11% | 6% | 15% | 10% | 7% | 14% | 10% | 7% | 11% | 12% |
| ALPFA | -1% | -3% | -1% | 1% | 5% | 1% | 1% | 2% | 1% | -1% | -2% | -1% |
| AMX | 4% | 20% | 6% | 3% | 23% | 4% | 1% | 4% | 1% | 2% | 12% | 3% |
| BIMBO | 2% | 7% | 2% | 3% | 10% | 3% | 3% | 9% | 3% | 2% | 7% | 2% |
| CEMEX | -1% | -5% | -3% | 0% | 1% | 1% | 3% | 8% | 6% | 3% | 8% | 6% |
| FEMSA | 6% | 10% | 9% | 6% | 10% | 7% | 5% | 9% | 7% | 6% | 11% | 8% |
| GFNORTE | 1% | 12% | 2% | 1% | 12% | 19% | 2% | 14% | 19% | 2% | 16% | 27% |
| GMEXICO | 8% | 15% | 22% | 5% | 9% | 12% | 5% | 9% | 13% | 6% | 11% | 16% |
| KIMBER | 12% | 51% | 12% | 14% | 64% | 13% | 12% | 68% | 13% | 10% | 66% | 11% |
| MEXCHEM | 1% | 3% | 2% | 2% | 4% | 2% | 3% | 6% | 4% | 2% | 6% | 4% |
| PENOLES | 1% | 2% | 2% | -1% | -1% | -1% | 4% | 7% | 7% | 7% | 12% | 13% |
| SAN. MX | 1% | 13% | 25% | 1% | 13% | 22% | 1% | 15% | 20% | 1% | 15% | 18% |
| TLEVISA | 4% | 10% | 11% | 4% | 12% | 14% | 2% | 6% | 6% | 2% | 7% | 7% |
| WALMEX | 12% | 20% | 7% | 10% | 17% | 5% | 12% | 20% | 6% | 14% | 25% | 7% |
| LIVERPOL | 7% | 12% | 10% | 8% | 13% | 10% | 7% | 12% | 8% | 6% | 11% | 8% |
| GCARSO | 7% | 11% | 8% | 7% | 10% | 7% | 9% | 13% | 11% | 8% | 12% | 11% |
| GFINBURO | 5% | 19% | 49% | 3% | 11% | 30% | 2% | 11% | 32% | 4% | 15% | 32% |
| GRUMAB | 11% | 25% | 9% | 2% | 6% | 2% | 11% | 24% | 9% | 10% | 24% | 9% |
Source: Authors, according to 2014, 2015, 2016 and 2017 financial statements. Retrieved in December 2018 from the BMV website.
Since DEA model restrictions consider that all variables must be positive, negative profitability results (inputs) were disabled. That was the case for Alfa in 2014 and 2017, Cemex in 2014 and Peñoles in 2015, whose negative results were due exclusively to company economic strategies or to market causes.
Table 5 Output Variables: Sustainable Value indicators of Sustainable Index firms
| List Issuers | 2014 | 2015 | 2016 | 2017 | ||||||||
|---|---|---|---|---|---|---|---|---|---|---|---|---|
| E | S | G | E | S | G | E | S | G | E | S | G | |
| AC | 61 | 70 | 74 | 62 | 79 | 74 | 70 | 78 | 76 | 72 | 78 | 76 |
| ALFA | 42 | 51 | 83 | 37 | 52 | 90 | 38 | 49 | 90 | 42 | 44 | 93 |
| AMX | 52 | 46 | 56 | 52 | 47 | 57 | 57 | 40 | 60 | 59 | 50 | 64 |
| BIMBO | 51 | 51 | 65 | 67 | 59 | 67 | 67 | 57 | 67 | 72 | 60 | 63 |
| CEMEX | 73 | 72 | 86 | 73 | 72 | 82 | 68 | 65 | 84 | 76 | 65 | 97 |
| FEMSA | 65 | 68 | 72 | 62 | 68 | 72 | 61 | 67 | 72 | 61 | 67 | 70 |
| GFNORTE | 43 | 61 | 53 | 62 | 69 | 66 | 61 | 68 | 68 | 61 | 68 | 68 |
| GMEXICO | 27 | 24 | 44 | 48 | 61 | 54 | 52 | 62 | 59 | 52 | 62 | 56 |
| KIMBER | 68 | 54 | 71 | 70 | 54 | 71 | 52 | 52 | 71 | 68 | 52 | 71 |
| MEXCHEM | 55 | 68 | 78 | 69 | 71 | 79 | 69 | 59 | 79 | 71 | 64 | 81 |
| PENOLES | 60 | 55 | 75 | 60 | 55 | 75 | 60 | 52 | 75 | 55 | 65 | 74 |
| SAN. MX | 68 | 62 | 67 | 67 | 63 | 66 | 70 | 67 | 63 | 71 | 73 | 62 |
| TLEVISA | 40 | 41 | 52 | 42 | 43 | 57 | 47 | 40 | 60 | 45 | 42 | 69 |
| WALMEX | 78 | 70 | 52 | 71 | 54 | 56 | 71 | 66 | 58 | 79 | 70 | 58 |
| LIVERPOL | 34 | 48 | 54 | 34 | 48 | 54 | 34 | 45 | 54 | 34 | 45 | 54 |
| GCARSO | 32 | 40 | 57 | 41 | 40 | 57 | 41 | 37 | 57 | 47 | 46 | 63 |
| GFINBURO | 32 | 56 | 38 | 32 | 56 | 39 | 32 | 55 | 41 | 32 | 55 | 41 |
| GRUMAB | 50 | 55 | 78 | 48 | 55 | 79 | 69 | 59 | 79 | 47 | 47 | 63 |
Source: Authors, according to Sustainalytics Inc. for the 2014- 2017 period. Retrieved in December 2018 from the Yahoo Finance website.
4. Results and discussion
Table 6 shows technical efficiency for firms over the period 2014-2017. The most efficient firms (in bold) were as followss: Alpha in 2015 and 2016; América Móvil in 2016; Bimbo in 2017; Cemex in 2015; Mexchem in 2014 and 2017; Peñoles in 2014; and Santander in 2014, 2016 and 2017. In terms of profitability, all these companies reached the maximum sustainable value efficiency. Due to the DEA model restriction for positive values, not all companies participated in every year calculations. In 2014, only 16 companies were evaluated, 18 firms in 2016, and 17 firms in 2015 and 2017, respectively.
Table 6 Technical efficiency of Sustainable Index companies
| Station | 2014 | 2015 | 2016 | 2017 |
|---|---|---|---|---|
| Efficiency | Efficiency | Efficiency | Efficiency | |
| AC | 19.75% | 10.97% | 26.32% | 66.48% |
| ALFA | 100% | 100% | ||
| AMX | 28.89% | 17.81% | 100% | 88.89% |
| BIMBO | 87.01% | 30.59% | 47.02% | 100% |
| CEMEX | 100% | 51.13% | 89.81% | |
| FEMSA | 26.10% | 13.49% | 35.67% | 57.10% |
| GFNORTE | 89.71% | 7.99% | 60.80% | 69.27% |
| GMEXICO | 7.82% | 9.41% | 30.41% | 52.84% |
| KIMBER | 18.89% | 7.38% | 9.51% | 21.91% |
| MEXCHEM | 100% | 49.31% | 60.53% | 100% |
| PENOLES | 100% | 45.11% | 50.78% | |
| SAN. MX | 100% | 7.06% | 100% | 100% |
| TLEVISA | 17.15% | 5.79% | 49.47% | 83.34% |
| WALMEX | 37.14% | 19.45% | 24.78% | 33.33% |
| LIVERPOL | 15.95% | 6.67% | 15.31% | 38.35% |
| GCARSO | 18.45% | 9.83% | 16.60% | 38.89% |
| GFINBURO | 16.47% | 7.07% | 51.07% | 39.78% |
| GRUMAB | 22.22% | 45.93% | 17.29% | 26.11% |
Source: Authors, using DEAOS Software, processed on April 7, 2019
Additionaly, an annual vertical analysis for each of the four years of the analyzed period was performed (Table 6). For 2014, it can be observed that out of the 16 companies subject to evaluation that year, the firms with the highest efficiency values were Mexchem, Peñoles and Santander. Inefficient companies, grouped by Stock Exchange sectors, should have increased their social, environmental and corporate governance performance scores according to the following percentages:
1. Industrial sector: Grupo Carso by 82%. Materials: Grupo México by 92%. Consumer staples: Arca Continental by 80%, Bimbo by 13%, Femsa by 74%, Gruma-Maseca by 78%, and Kimberly Clark by 81%. Telecom: América Móvil by 71%, Televisa 83%. Financial: Grupo Financiero Banorte by 10%, and Grupo Financiero Inbursa by 84%. Basic and non-basic consumer discretionary: Walmart 63%, and Liverpool by 84%. These results are shown in Figure 4.

Source: Authors, using DEAOS Software, processed on April 7, 2019
Figure 4 Sustainable inefficiency of the firms in 2014
In 2015 only two companies reached perfect efficiency, Alfa and Cemex. That was a difficult year for most companies in Mexico in terms of profitability, especially for those in the financial sector, which showed the lowest efficiency results. In order to meet the highest sustainable efficiency, such firms should have increased their ESG performance scores according to the following percentages:
2. Industrial: Mexchem by 51%, and Grupo Carso by 90%. Materials: Grupo México by 91%. Consumer staples: Arca Continental by 89%, Bimbo by 69%, Femsa by 87%, Gruma by 54%, and Kimberly Clark by 93%. Telecom: America Móvil 82% , and Televisa by 84%. Financial: Grupo Financiero Banorte by 92%, Santander in its worst year, by 93%, and Grupo Financiero Inbursa by 93%. Basic and non-basic consumer discretionary: Wal-Mart by 81% and Liverpool by 93%. These results are shown in Figure 5.

Source: Authors, using DEAOS Software, processed on April 7, 2019
Figure 5 Sustainable inefficiency firms of 2015
In 2016, the three companies with perfect sustainable efficiency were Alfa, Santander and America Móvil. The remaining 13 companies should have increased their ESG performance scores according to the following percentages:
3. Industrial: Mexchem by 39%, and Grupo Carso by 83%. Materials: Cemex by 49%, Grupo México by 70%, and Peñoles by 55%. Consumer staples: Arca Continental by 74%, Bimbo by 53%, Femsa by 64%, Gruma by 83%, and Kimberly by 90%. Telecom: Televisa by 71%. Finacial: GF Banorte by 39%, and GF Inbursa by 49%. Basic and non-basic consumer discretionary: Walmart by 75% and Liverpool by 85%. These results are shown in Figure 6.
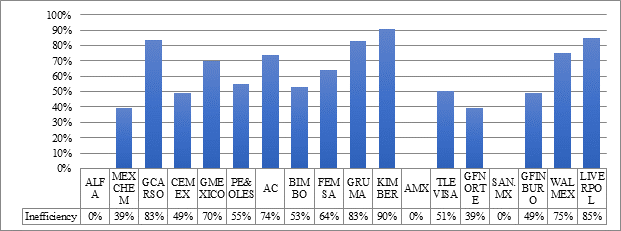
Source: Authors, using DEAOS Software, processed on April 7, 2019
Figure 6 Sustainable inefficiency firms in 2016
Lastly, in 2017 the firms with perfect efficiency were Mexchem, Bimbo and Santander. The remaining 12 companies should have increased their sustainable value levels by the following percentages:
4. Industrial: Grupo Carso by 61%. Materials: Cemex by 10%, Grupo México by 47%, and Peñoles by 49%. Consumer staples: Arca Continental by 33%, Femsa by 43%, Gruma by 74%, and Kimberly Clark by 78%. Telecom: América Móvil by 11%, and Televisa by 17%. Financial: Grupo Financiero Banorte by 31% and Grupo Financiero Inbursa by 60%. Basic and non-basic consumer discretionary: Walmart by 67% and Liverpool by 62%. These results are shown in Figure 7.

Source: Authors, using DEAOS Software, processed on April 7, 2019
Figure 7 Sustainable inefficiency firms of 2017
It should be noted that Kimberly, Grupo Carso, Liverpool, Grupo Financiero Inbursa and Gruma did not invest enough to strenghthen ESG practices to reach higher sustainable efficiency values. For Grupo Carso, Liverpool and GF Inbursa, such investment would have meant the opportunity to belong to sustainable indexes, and in the future, it could even the chance reach new markets and international investors.
Table 7 shows the seven most efficient companies of the study in the corresponding year. It can be highlighted that five firms consistently got the highest score on the Corporate Governance. On the other hand, Santander (2014, 2016 and 2017) and Bimbo (2017) reached their highest score on Environmental practices.
Table 7 Sustainable value (ESG) scores of the most efficient companies.
| Station | Sector | 2014 | 2015 | 2016 | 2017 | ||||||||
|---|---|---|---|---|---|---|---|---|---|---|---|---|---|
| E | S | G | E | S | G | E | S | G | E | S | G | ||
| Alpha | Industrial | 37 | 52 | 90 | 38 | 49 | 90 | ||||||
| Amx | Telecom | 57 | 40 | 60 | |||||||||
| Bimbo | Consumer Staples | 72 | 60 | 63 | |||||||||
| Cemex | Materials | 73 | 72 | 82 | |||||||||
| MEXCHEM | Industrial | 55 | 68 | 78 | 71 | 64 | 81 | ||||||
| Peñoles | Materials | 60 | 55 | 75 | |||||||||
| Santander | Financial | 68 | 62 | 67 | 70 | 67 | 63 | 71 | 73 | 62 | |||
Source: Authors, based on Sustainalytics Inc. for the 2014- 2017 period. Retrieved in November 2018 from the Yahoo Finance website.
5.3. Lambdas and slacks
As DEA benchmarks DMUs, it is a powerful decision analysis tool to improve management practices, indicating sources of inefficiency, and determining the overall situation on different dimensions. After identifying inefficient DMUs, lambda values were generated to indicate the coefficient that a specific DMU must benchmark for each of the reference units. In an input-oriented model, slacks consist of the excess in one of the input variables (profitability), that should be reduced in order to generate improvements in the output variables (ESG scores). A slack value indicates the points below the efficiency frontier a specific DMU has, and therefore, the gap that has to be fulfilled.
Table 8 shows accumulated lambdas and slacks for sustainable firms for the years 2014- 2017. Companies with perfect efficiency were Mexchem, Peñoles, Grupo Financiero Santander, Alfa, Cemex, América Movil and Bimbo. Despite being a company that attained perfect efficiency for three years, Santander was not a benchmarking reference, since its sustainable strategies were not the most effective to be imitated by other companies.
Our findings indicate that the two companies to benchmark were Alfa, with 18.91 points, and Mexchem, with 16.81 points, both in the industrial sector. Alpha is a firm that manages a diversified business portfolio which includes the several industries: food, polyester fabrics, automobile parts, information and communication technologies, hydrocarbons. Mexchem plays a leading role in the production of PVC in the chemical industry it supplies. Both fims are recognized for their investments in sustainability and in the search for solutions that generate value not only for the company, but for all of the stakeholders.
Table 8 Accumulated Lambdas and Slacks of sustainable firms for the period 2014-2017
| LAMBDAS (BENCHMARKS) | SLACKS | ||||||||||||
|---|---|---|---|---|---|---|---|---|---|---|---|---|---|
| Year | mexch | peñoles | san.mex | alfa | cemex | amx | bimbo | E | S | G | ROA | ROE | ROS |
| 2014 | 6.1 | 7.8 | 1.0 | 59.0 | 40.5 | 146.3 | 9% | 32% | 7% | ||||
| 2015 | 1.5 | 13.5 | 107.1 | 62.6 | 127.1 | 10% | 14% | 3% | |||||
| 2016 | 1.7 | 17.4 | 4.4 | 16.7 | 128.1 | 727.4 | 3% | 4% | 23% | ||||
| 2017 | 10.7 | 1.7 | 4.3 | 188.3 | 58.7 | 112.8 | 12% | 12% | 29% | ||||
| Σ | 16.8 | 7.8 | 4.5 | 18.9 | 13.5 | 4.4 | 4.3 | 371.1 | 289.9 | 1,113.6 | 33% | 61% | 61% |
Source: Authors, using DEAOS Software, processed on April 7, 2019
After evaluating the degree of efficiency to be improved (Benchmarks-Lambdas), slacks are discussed as a means to enhance ESG indicators. In this sense, companies that proved inefficient must have improved their scores for environmental and social practices as well as for corporate governance in each of the individual scores resulting from DEA, and in some cases, they should have invested a part of their profits in strategies that generate sustainable value. Slack analysis shows that the least sensitive indicator was ROA, and that firms should have focused their efforts on sustainable value factors, even sacrificing some returns on sales and/or capital, to optimize their efficiency.
Table 8 also shows that the largest values for slacks were in the corporate governance variable in 2016, the year following a financial crisis that affected most of the largest firms in Mexico. It can be concluded that during that year companies were more concerned with economic issues, than with generating sustainable value. However, in the subsequent years sustainable strategies were resumed, strengthening corporate governance (G), a variable that becomes a transversal axis of CSR so that firms are in turn able to meet their social, environmental and economic goals. These results support Keinert’s (2008) claim that economic activities focused on increasing governance, will improve social and environmental goals in the long term.
Our findings also support the theory of economic value (Friedman, 1970), according to which companies are required to generate economic value if they are to attain their social and environmental goals. With this vision, CSR companies set business strategies that integrate sustainable practices into their value chain. Moreover, this strategy allows firms to contribute to the achievement of the Sustainable Development Goals (SDGs), their stakeholders’ well-being and to accomplish corporate profitability goals.
Additionally, Corporate Governance allows firms to improve their business practices and stress the importance of institutionalization of all social, environmental and economic internal processes, by standardizing and regulating them. Likewise, authors such as Jaén and Rivas (2008) and Campbell (2007) state that business strategies should be institutionalized in order to encourage and ensure responsible firm behavior. Similarly, sustainable value practices must be ensured as everyday practices, not only when companies are interested in maximizing their profits.
6. Conclusions, recommendations and final considerations
Statistical models currently used to quantify firms’ financial distress are unable to identify what areas need to be improved and determine corporate efficiency in terms of their profitability. For this study, we have used a DEA model based on previous evidence supporting the ability of DEA to set optimum performance referents.
Results show that, for firms listed on the Sustainable Index of the Mexican Stock Exchange, corporate governance is the indicator that has the greatest weight on business sustainability practices, followed by environmental and social practices. Moreover, findings reveal similarities in firms’ functionality to generate sustainable value, regardless of the economic sector they belong to. However, individual differences are observed in the strategies followed, hence ESG activities vary according to the economic sector. The information provided by this model might be useful for investors and stakeholders alike, who could base their support to firms, on the specific ESG activities of firms.
Governance activities remarkably reduce companies risks and give certainty to stakeholders, since it becomes a transversal axis of business strategies. Thus, achieving corporate governance generates efficiency and allows firms to compete in today´s global markets contributing to the sustainable development goals. Also, corporate governance and institutional practices foster the generation and monitoring of internal and external regulations, collective participation, gender equity, objective and independent business decision-making processes, without neglecting economic efficiency. This is accomplished by monitoring, controlling, systematizing and optimizing a firm’s ESG practices according to their vision, generating in turn, business resilience. To sum up, if companies standardize their management processes through corporate governance, they will strengthen institutionality and become more sustainable efficient.
We recommend a deeper analysis of individual ESG strategies that large companies in Mexico are currently incorporating into their value chain. This is required in order to evaluate their impact on the country’s development. By determining the individual ESG strategies of companies, a sustainable competitive model that might apply to other firms could be designed. Another proposed line of research is to assess the institutionality and sustainable value generation in SMEs in Mexico to evaluate their sustainable efficiency.
In addition, by adding sustainable value to business strategies, new firms are more likely to qualify to be incorporated into international Sustainable Indexes, while implementing mechanisms to prevent social, environmental and economic risks. As a final consideration, our model strengthens the evaluation of business performance, and it might be an alternative tool to fundamental analysis for assessing efficient business management.
To conclude, firms’ actions to achieve efficiency can be observed in the strategies they devise to generate value for the company, which can no longer be seen only as a means of meeting profitability goals. Instead, sustainable value is an opportunity to generate positive impacts on the environment and on the community.

