


 nova página do texto(beta)
 Inglês (pdf)
 Artigo em XML
 Referências do artigo
 Enviar este artigo por email
 Citado por SciELO
  Similares em
SciELO
Similares em
SciELO 
 Permalink
1. Introduction
The benefits of governmental investments could be very low or even null if they are geared to projects that are not suitable (Pritchett, 2000). Some studies (McKinsey Global Institute, 2013) have shown that there can be considerable economic and social gains if the selection of such investment projects is improved and existing assets are used to the best of their ability. Others have provided evidence that correlation between public investment and economic growth depends to a certain extent on the, say, quality of such investment (Gupta et. al., 2014). Thus, making better public investment decisions can help to free up resources for other important needs, to have a more favorable impact on infrastructure with the same amount of resources, and thus to enhance growth. This issue is very relevant in developing countries, like those of Latin America, characterized by having significant infrastructure gaps, of the order of various points of GDP (Sánchez et. al. 2017).
Some recent studies have focused on the task of how to close the infrastructure gaps relying less on increasing the aggregate level of investment and more on a more efficient allocation of resources (Serebrisky et. al., 2017; Suárez-Alemán, Serebrisky & Perelman, 2019). Some of these authors (Serebriky et. al., op. cit.) estimated savings equivalent to 1% of Latin America´s GDP if countries improve the efficiency of public investments. Clearly, a powerful tool to close infrastructure gaps -and thus stimulate long-term economic growth- can be a better management of investment projects.
Large infrastructure projects require a lot of planning in the pre-investment phase, including studies on technical, socioeconomic, and environmental issues. Besides, these projects normally face political challenges that range from public debate on their relevance to parliamentary work to grant them financing. Clearly an institutional and organizational framework is indispensable to better ensure that different stages in the life cycle of projects are carried out optimally.
Since every country has its own legal framework, there are notable differences in the public investment processes among countries. This creates an opportunity for making comparative studies and finding the best practices to recommend improvements for the quality of public investment management. However, there is not much literature on this topic, and there is just one index aimed at measuring that quality: The Public Investment Management Index (PIMI) by Dabla-Norris et. al. (2012). This index filled an unattended gap in the literature and works well for cross-country comparisons, but it is not replicable since most of the information used on its construction is not open to public access.
This paper solves this problem by constructing a New PIMI, based on public information, theoretically robust and with a better performance in capturing key traits of management of public investment than the original one. The main contribution of this article is this New PIMI, which can be used to better compare the quality of public investment management between countries. This is relevant because existing studies on public investment generally try to measure its impact on other variables like economic growth or private investment (see Sturm et. al, 1998; Romp & De Haan, 2007; Das, Das & Ray, 2018; Afonso & Aubin, 2019), but they never take its quality into account. With the New PIMI, it is possible to include such trait as a control variable in future studies on public investments and their macroeconomic impacts.
The remainder of this article proceeds as follows. Section 2 provides a brief literature review, while section 3 describes the original PIMI and the construction of a new one. Section 3 also elaborates on the robustness of this New PIMI under different weighting schemes. Section 4 presents the relation between PIMI and other indices related to some institutional characteristics. In this fourth section, the New PIMI is correlated against the ratio between increases in public capital and the amount of public investment, as a proxy of its efficiency. Finally, section 5 draws conclusions and topics for further research.
2. Literature review
In recent years there has been an increasing interest regarding the relationship between public investment and the quality of institutions, management, and governance. This is not surprising since institutions and state capacity play a critical role in determining whether public investments will generate productive assets, or be a waste of valuable resources. For instance, Grigoli and Mill (2014) studied the relation between institutional quality and the level of public investment and provided tentative evidence of a positive effect from the quality of governance to the quality of infrastructure. This last point was also stated by Albino-War et. al. (2014), and Baum, Mogues, and Vernier (2020), among others, and was the starting point for an International Monetary Fund´s Staff Report (2015).
With the World Bank as the main supporter institution, another part of the literature has put the emphasis on finding the best practices for public investment management. In this regard, authors like Rajaram et. al. (2010) have contributed by constructing the first diagnostic framework for assessing this management, identifying eight “must-have” features of a well-functioning public investment system: i) investment guidance, project development, and preliminary screening; ii) formal project appraisal; iii) independent review of appraisal; iv) project selection and budgeting; v) project implementation; vi) project adjustment; vii) facility operation; and viii) project evaluation. Subsequently, Rajaram et. al. (2014) built on this framework to apply it to country experiences and explain in detail some of the features aforementioned.
But the theoretical foundations of evaluation of public investment projects (and therefore of its management) can be traced back to Harberger´s (1971) three postulates1, which are the underlying assumptions of cost-benefit analysis (CBA), a mandatory requirement for the execution of investment projects in most of the countries.
Since Haberger´s contributions were made in the early seventies, it was back then when countries started to establish the evaluation of public investment projects as a legal requirement to assign them resources. In Latin America, this led to the creation of National Systems of Public Investment (NSPI), with Chile as the pioneer.
Since then, NSPI have been studied extensively from a de jure perspective. Some authors evaluated the hits and misses of the NSPI in a particular country (Ahmad y Viscarra, 2016; Fontaine, 1997; Gómez-Lobo, 2012), while others have made comparisons between different NSPI (Rojas, 2019; Perroti & Vera, 2015; Contreras, Cartes y Pacheco, 2010; Ortegón y Pacheco, 2005; Vizzio, 2000). Also, there are different classifications on NSPI and different approaches from which they are studied. Ortegón and Pacheco (op.cit.), for instance, distinguished between federal countries, in which there are intermediate levels of government with their own legal personality and the right to draft their own laws; and unitary, strongly centralized countries. The following analysis is closer to this last perspective.
3. The Public Investment Management Index (PIMI) and its new version
As Pritchett (2000) convincingly argued, when public investment is ineffective, cumulated and depreciated investment effort is not equal to capital. “A public sector steel mill may absorb billions as an ´investment´, but if it cannot produce steel it has zero value as capital” (op. cit., p. 1). This means that only a fraction (
Where
The data used in the construction of the PIMI were compiled from many different sources, with the World Bank Public Investment Management (PIMs) case studies and the World Bank Public Expenditure Reviews (PERs) as the primary source of information. However, these sources have a serious problem. As the authors stated explicitly, PIMs and PERs “relied on in-country discussion with country officials, review of published and unpublished material, and discussions with relevant stakeholders” (op. cit. 244). Thus, much of the information used for those studies and, therefore, in the construction of the index is not open to public access. Furthermore, Dabla-Norris et. al. warned that PIMs and PERs were not sufficient to score the 17 questions for every country, so they “sent a short questionnaire to World Bank public finance experts and country economists” to supplement the information. Therefore, it is impossible to replicate the PIMI unless the researcher could contact local officials and a lot of experts from organizations such as the World Bank.
Despite the above, the PIMI works well for cross-country comparisons and is fairly robust in the sense that notable changes in the weighting and aggregation do not reflect in substantial changes in the country scores and ranking. The PIMI also has the expected correlation with other variables, such as per capita GDP, and control of corruption, but it does not have the expected correlation when plotted against an objective indicator of public investment efficiency, as it will be seen in section 4 of this work. This implies that original PIMI could be substantially enhanced, which is why we build a new one in the following section.
3.1 Construction of a New PIMI: the cases of Latin America
As it was stated in the introduction to this paper, an institutional-organizational framework is needed to ensure that the processes through which public investments go through are carried out optimally. Unlike other regions in the world, many Latin American countries have formally recognized these frameworks in their laws, as National Systems of Public Investment (NSPI). Moreover, supported by the Inter-American Development Bank and the Economic Commission of Latin America and the Caribbean, they have created a “Red SNIP (NSPI Network)” in which they share their experiences. This makes Latin American countries especially comparable between them.
Since Dabla-Norris et. al. (op. cit.) did not calculate the PIMI for most of the Latin American countries, Armendáriz et. al. (2016) replicated it for these countries, using the very same 17 characteristics as the former authors, but instead of presenting them as being continuous variables, they presented them as being dichotomous.
The New PIMI presented in this paper was constructed following this idea, by taking desirable characteristics on the NSPI and adding a point to each country for each of those characteristics that are present in its case. Each characteristic could be said to be a dichotomous variable, which takes a value of one if it is present and zero otherwise. Twelve characteristics were considered that deal with the process and evaluations that investment projects go through, the faculties and duties that the NSPI authorities have, and the transparency of information on public investments. Another non-binary variable was considered, which stands for the antiquity of the NSPI as part of the legal framework (question three in table 1). Since Chile and Costa Rica created their NSPI in 1975, they now have been operable for 45 years, so this third variable takes a value of one in the cases of these two countries, zero in the cases where NSPI does not formally exist yet, and fluctuates in the interval (0,1) in the other countries, according to the age of the NSPI in each one. Then, these thirteen characteristics were grouped into four categories (legal support and experience, processes and methodologies for the pre-investment phase, planning and budgeting, and accountability and transparency) each of which was evaluated on a 100 scale based on the values obtained for the dichotomous variables that make them up.
The first one considers the existence of a legally/formally recognized NSPI and its authority, for this is important to give legal support to the system. The second category captures the technical capacities of the system to evaluate investment projects at a micro level, while the third one captures its capacity to select and prioritize projects and to plan the investments in the medium and long terms (a political and macro-level). Finally, the fourth category captures the transparency of the system and its institutional capacities to evaluate projects while they are being executed and once they are operating. Table 1 presents these characteristics and categories, which are in line with what Rajaram et. al. (2010) and the World Bank (Kim, Fallov & Groom, 2020) understand as “Must Have” features for an efficient public investment system. Moreover, characteristics presented in table 1 address, to a lesser extent, the same four stages of the public investment process considered by Dabla-Norris et. al. (op. cit).
Table 1 Desirable characteristics for public investment systems
| Legal support and experience | (1) Is the existence of the NSPI legally recognized? |
| (2) Is there a specific technical authority for investments by the central government? | |
| (3) How long has the NSPI been formally recognized? (45 years = 1, 0 if not yet recognized) | |
| Quality of pre-investment phase (technical/micro) | (4) Are there general methodologies for the ex-ante evaluation of projects? |
| (5) Are there specific-sectorial methodologies for the preparation of the projects? | |
| (6) Is there a social discount rate and other relevant shadow prices issued by the authority? | |
| Planning and budgeting (political/macro) | (7) Are there specific and well-defined criteria for the selection and prioritization of projects? |
| (8) Is there a multi-annual national plan for public investment? | |
| (9) Does the technical authority have the power to prevent the projects that it deems inappropriate from being carried out? | |
| Accountability and transparency | (10) Are ex-post evaluations mandatory for projects evaluated by the investment authority? |
| (11) Are ex-post evaluations carried out by an organization other than the one executing the project? | |
| (12) Is the information on investment projects open to public access? | |
| (13) Is it possible to count on the participation of civil society in the selection or evaluation of projects? |
Source: Authors´ elaboration
To answer the questions presented above, an extensive review of the legal framework was carried out at the national level for each one of sixteen Latin American countries. Most countries in this cohort have a specific law to control and regulate public investments, and a single website that gathers all the information regarding it, from planning to project banks and official reports. Nonetheless, there are some countries (Brazil, Colombia, El Salvador, Nicaragua, and Mexico) in which this information is dispersed within several documents and websites, but the information obtained from official sources was enough to complete table 2, where it is shown if these sixteen countries meet the desirable characteristics exposed in table 1, and the obtained score for each country in each one of the four categories. The last column shows the value of the New PIMI for each country as the unweighted average of the four categories.
Table 2 Answering the questions: the New PIMI
| Country / Question | 1 | 2 | 3 | 4 | 5 | 6 | 7 | 8 | 9 | 10 | 11 | 12 | 13 | Legal support and experience | Quality of pre-investment phase | Planning and budgeting | Accountability and transparency | New PIMI |
|---|---|---|---|---|---|---|---|---|---|---|---|---|---|---|---|---|---|---|
| Chile | 1 | 1 | 1.0 | 1 | 1 | 1 | 1 | 0 | 1 | 1 | 1 | 1 | 0 | 100 | 100 | 67 | 100 | 92 |
| Paraguay | 1 | 1 | 0.2 | 1 | 1 | 1 | 1 | 1 | 1 | 0 | 1 | 1 | 0 | 73 | 100 | 100 | 67 | 85 |
| Costa R. | 1 | 1 | 1.0 | 1 | 1 | 1 | 1 | 1 | 1 | 0 | 0 | 1 | 0 | 100 | 100 | 100 | 33 | 83 |
| Bolivia | 1 | 1 | 0.5 | 1 | 1 | 1 | 1 | 1 | 0 | 0 | 0 | 1 | 1 | 84 | 100 | 67 | 67 | 79 |
| Peru | 1 | 1 | 0.4 | 1 | 1 | 1 | 1 | 1 | 1 | 0 | 0 | 1 | 0 | 81 | 100 | 100 | 33 | 79 |
| Panama | 1 | 1 | 0.4 | 1 | 1 | 0 | 1 | 1 | 1 | 0 | 1 | 1 | 0 | 81 | 67 | 100 | 67 | 79 |
| Dom. Rep. | 1 | 1 | 0.3 | 1 | 0 | 0 | 1 | 1 | 1 | 0 | 1 | 1 | 1 | 77 | 33 | 100 | 100 | 78 |
| Colombia | 1 | 1 | 0.2 | 1 | 0 | 1 | 1 | 1 | 0 | 1 | 0 | 1 | 1 | 74 | 67 | 67 | 100 | 77 |
| Mexico | 0 | 1 | 0.0 | 1 | 1 | 1 | 1 | 0 | 0 | 0 | 1 | 1 | 1 | 34 | 100 | 33 | 100 | 67 |
| Argentina | 1 | 1 | 0.6 | 1 | 1 | 0 | 1 | 1 | 0 | 0 | 0 | 1 | 0 | 86 | 67 | 67 | 33 | 63 |
| Nicaragua | 1 | 1 | 0.4 | 1 | 1 | 1 | 0 | 1 | 0 | 0 | 0 | 1 | 0 | 81 | 100 | 33 | 33 | 62 |
| Ecuador | 1 | 1 | 0.3 | 1 | 1 | 0 | 0 | 1 | 0 | 1 | 0 | 1 | 0 | 77 | 67 | 33 | 67 | 61 |
| Uruguay | 1 | 1 | 0.2 | 1 | 1 | 1 | 0 | 0 | 0 | 0 | 1 | 1 | 0 | 73 | 100 | 0 | 67 | 60 |
| Guatemala | 1 | 1 | 0.2 | 1 | 0 | 0 | 1 | 1 | 1 | 0 | 0 | 1 | 0 | 72 | 33 | 100 | 33 | 60 |
| El Salvador | 1 | 1 | 0.7 | 1 | 1 | 0 | 0 | 1 | 0 | 0 | 0 | 1 | 0 | 89 | 67 | 33 | 33 | 56 |
| Brazil | 0 | 0 | 0.0 | 1 | 0 | 0 | 0 | 1 | 0 | 0 | 1 | 1 | 0 | 0 | 33 | 33 | 67 | 33 |
Source: Authors´ calculations based on laws and official documents (see reference list)
According to the New PIMI, Chile is the country with the highest quality on its public investment management, followed by Paraguay, Costa Rica, Bolivia, Peru, and Panama; while the worst evaluated countries are El Salvador and Brazil. This notably contrasts with the original PIMI, where Brazil was the highest-ranked of four Latin American countries, followed by Colombia, Peru, and Bolivia.
3.2 Alternative aggregating schemes
The New PIMI presented above is constructed as the unweighted average of four sub-indexes. However, it could be said that some characteristics are more important than others and that scores and rankings could substantially change if different weights are assigned for every category or sub-index. In what follows, we test how big these changes are by assigning, both discretionally and randomly, different weights to each one of the sub-indexes.
3.2.1 The discretional weighting
Four different weighting schemes were constructed, assigning a higher weight to each one of the four categories. In the first one (“legal” scheme in table 3), legal support and experience account for twice the weight of the other categories, while in the second one (“technical” scheme in table 3), the double weight is assigned to quality of the pre-investment phase. In the third one (“political” scheme in table 3), the double weight is assigned to planning and budgeting and the last scheme (“accountable” in table 3) considered a double weight for accountability and transparency.
The first column in Table 3 shows the score and ranking of the New PIMI with the original non-weighted scenario, while the other columns do the same under the four discretional-alternative weighting schemes. As can be seen, and with exception of Costa Rica in scenario D, the top three highest values for New PIMI are always composed of the same countries (Chile, Paraguay, and Costa Rica); while Brazil is always the worst-ranked country, followed by El Salvador, which has some of the lowest values for every alternative weighting. Thus, it could be said that the New PIMI is robust to alternative-discretional weighting schemes. Only Uruguay, Mexico, and Costa Rica have a score that notably changes from one weighting to another, which can be seen in the last column of Table 3, where these three countries show a standard deviation higher than 6 in their scores.
Table 3 New PIMI: Country scores and ranking unweighted and with four discretional weighting schemes (rank in parenthesis)
| Country | Unweighted | Legal | Technical | Political | Accountable | Std. Dev. |
|---|---|---|---|---|---|---|
| Chile | 92 (1) | 93 (1) | 93 (1) | 87 (2) | 93 (1) | 2.6 |
| Paraguay | 85 (2) | 83 (3) | 88 (2) | 88 (1) | 81 (4) | 3.0 |
| Costa Rica | 83 (3) | 87 (2) | 87 (3) | 87 (2) | 73 (7) | 6.1 |
| Bolivia | 79 (4) | 80 (4) | 84 (4) | 77 (7) | 77 (5) | 2.9 |
| Peru | 79 (4) | 79 (5) | 83 (5) | 83 (4) | 70 (9) | 5.3 |
| Panama | 79 (4) | 79 (5) | 76 (6) | 83 (4) | 76 (6) | 2.9 |
| Dom. Rep. | 78 (7) | 77 (7) | 69 (10) | 82 (6) | 82 (2) | 5.3 |
| Colombia | 77 (8) | 76 (8) | 75 (7) | 75 (8) | 81 (3) | 2.5 |
| Mexico | 67 (9) | 60 (15) | 73 (8) | 60 (11) | 73 (7) | 6.5 |
| Argentina | 63 (10) | 68 (9) | 64 (12) | 64 (10) | 57 (12) | 3.9 |
| Nicaragua | 62 (11) | 66 (10) | 69 (9) | 56 (12) | 56 (13) | 5.8 |
| Ecuador | 61 (12) | 64 (11) | 62 (13) | 55 (13) | 62 (10) | 3.4 |
| Uruguay | 60 (13) | 62 (12) | 68 (11) | 48 (15) | 61 (11) | 7.3 |
| Guatemala | 60 (13) | 62 (12) | 54 (15) | 68 (9) | 54 (14) | 5.9 |
| El Salvador | 56 (15) | 62 (12) | 58 (14) | 51 (14) | 51 (15) | 4.7 |
| Brazil | 33 (16) | 27 (16) | 33 (16) | 33 (16) | 40 (16) | 4.6 |
Note: See the first paragraph of this section for a definition of each of the weighting schemes
Source: Authors´ calculations.
3.2.2 The random weighting
500 different scenarios were constructed with a random weighting, using the next algorithm:
A
The next step was to solve the following expression:
Where
Table 4 New PIMI: Descriptive statistics for 500 alternative-random weighting schemes
| Country / Statistic | Max | Mean | Min | Sth. Dev. | Number of times that the country reached the three highest values | Number of times that the country reached the three lowest values |
|---|---|---|---|---|---|---|
| Argentina | 74 | 61 | 41 | 4.9 | 0 | 17 |
| Bolivia | 94 | 77 | 67 | 4.3 | 75 | 0 |
| Brazil | 58 | 33 | 13 | 6.8 | 0 | 492 |
| Chile | 100 | 91 | 74 | 4.9 | 422 | 0 |
| Colombia | 92 | 74 | 64 | 4.6 | 82 | 0 |
| Costa Rica | 100 | 83 | 48 | 8.7 | 280 | 0 |
| Dom. Rep. | 99 | 75 | 44 | 8.7 | 159 | 19 |
| Ecuador | 67 | 58 | 40 | 4.8 | 0 | 35 |
| El Salvador | 73 | 54 | 34 | 6.7 | 0 | 342 |
| Guatemala | 89 | 57 | 35 | 8.8 | 0 | 237 |
| Mexico | 98 | 70 | 41 | 9.1 | 22 | 91 |
| Nicaragua | 89 | 59 | 35 | 8.8 | 0 | 63 |
| Panama | 93 | 76 | 67 | 4.6 | 30 | 0 |
| Paraguay | 98 | 82 | 63 | 6.3 | 342 | 0 |
| Peru | 97 | 77 | 48 | 8.8 | 88 | 0 |
| Uruguay | 90 | 56 | 14 | 11.7 | 0 | 204 |
Source: Authors´ calculations
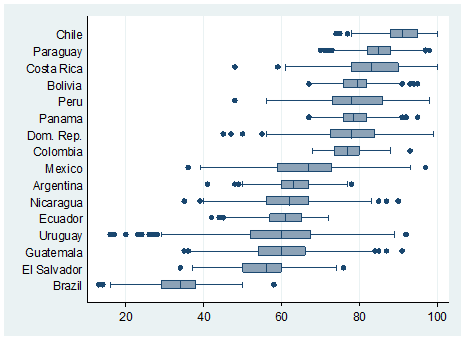
Judging by the number of times that a country reaches the top three highest values of New PIMI, it could be said that Chile remains the country with the best public investment management, followed by Paraguay, Costa Rica, and the Dominican Republic. Excluding the latter, these countries were at the top of the ranking under both the basic-unweighted scheme and the discretional ones, so, again, the New PIMI appears to be fairly robust. On the other hand, Brazil, El Salvador, Guatemala, and Uruguay remain the worst performers since they are ranked at the bottom in almost every weighting scheme. It is important to say that, judging by the mean value, the random weighting would generate the very same ranking as the unweighted PIMI. Nonetheless, this would not capture differences in the variability of scores obtained for each country. Figure 1 presents the distribution of these 500 different scores on a box plot and, as shown, some countries have outliers that are concentrated at the top of the distribution (such as Nicaragua), while outliers from other countries (like Chile) are concentrated at the bottom. In other words, the frequency distribution is different for each country, so the mean is not a good indicator to construct the ranking.
4. The relationship between the New PIMI with other selected indicators
As was stated above, the objective of Dabla-Norris et. al. (op. cit.) was to approximate to parameter
Solving for
Then,
The higher the value of this ratio, the more efficient is the public investment, in the sense that a larger portion of it incorporates into the economy as new capital stock. To compare the value of
Where
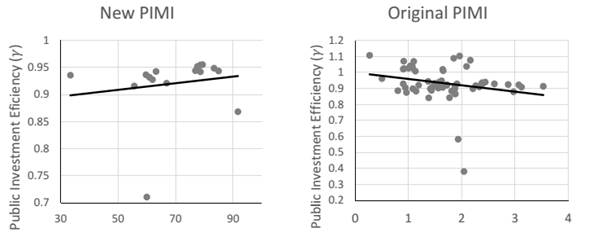
Despite the above, both the original and New PIMI have reasonable correlations against other institutional variables, such as the rule of law, government effectiveness, control of corruption, and regulatory quality. As is shown in table 5, the New PIMI fits better than the original when correlated against variables as political stability and rule of law, but fits a little worse when correlated against government effectiveness, regulatory quality, and control of corruption. However, the main difference between new and original PIMI is that the latter shows a negative correlation against the

Table 5 Spearman correlations among PIMI and New PIMI with other indices
| Index | PIMI | New PIMI |
|---|---|---|
| Public Investment Efficiency (with no consideration of depreciation) | -0.09 | 0.52 |
| Public Investment Efficiency (assuming an invariant three percent annual depreciation rate) | -0.24 | 0.15 |
| Government Effectiveness | 0.34 | 0.31 |
| Control of Corruption | 0.18 | 0.16 |
| Regulatory Quality | 0.39 | 0.26 |
| Political Stability | 0.10 | 0.16 |
| Rule of Law | 0.24 | 0.29 |
Source: Authors´ calculations based on World Governance Indicators (WGI), Dabla-Norris et. al. (2012), and IMF (2019). Institutional indices from WGI correspond to the year 1996.
5. Concluding remarks
The efficiency of public investment and its management are hard-to-measure variables. Dabla-Norris et. al. (op. cit) proxied this efficiency by constructing indices that aggregate indicators across four key stages of the investment process. These indices were then aggregated in the PIMI, which is the most widely used indicator of quality in public investment management. However, the PIMI was constructed with non-open access information and shows a correlation that deviates from the expected when plotted against a direct and objective indicator of public investment efficiency (PIE).
In this paper, we built a New PIMI that takes into account the most recognized features that literature suggests as desirable traits for an adequate public investment system, and calculate it for the cases of sixteen Latin American countries. This new index relies on public access information, which makes it easily replicable and applicable to other countries as well. A key difference between the New and the original PIMI is that the former has a much better tracking performance of the PIE.
Nonetheless, the New PIMI´s correlation with PIE has margin to be strengthened, which indicates that our new index can still be improved. Moreover, the PIE itself has limitations that need to be addressed, among them that its construction relies on very strict assumptions regarding the depreciation rate of public fixed capital stock between countries. Little is known about this variable at the aggregated level. Our results, on Latin America, lead to the main conclusion that the management of public investment in Chile, Paraguay, and Costa Rica compound the top three highest ranked in the region for almost all the alternative weighting scheme here considered. On the other hand, Brazil is by far the worst performer, followed by El Salvador, Guatemala, and Uruguay.

