


 nova página do texto(beta)
 Inglês (pdf)
 Artigo em XML
 Referências do artigo
 Enviar este artigo por email
 Citado por SciELO
  Similares em
SciELO
Similares em
SciELO 
 Permalink
1. Introduction
In the financial economic context, knowing the relationship of dependence between variables is of vital importance since it allows us to study the relationship between financial assets (Drouet and Kotz, 2001). The conventional measure of dependence in economic-financial theory is Pearson's correlation coefficient, which has played a key role in the design of financial economic theory. However, given the characteristics of nonlinearity in the series of financial assets, the use of Pearson's correlation coefficient has been gradually replaced with dependence indicators that help capture the nonlinearity of the series of financial assets.
Alternative measures of dependence, such as various models of the GARCH family (MGARCH, CCC, DCC, BECK, etc.) are popular but still rely on linearity assumptions. In this study we use copula theory, which offers economic-financial agents a powerful and flexible tool to estimate dependence between random variables, mainly because it captures patterns of nonlinear and asymptotic dependence more accurately. This is so because the type of copula proposed in this study not only allows the use of different marginal distribution functions but also estimates the extreme dependency weighting (tail dependency).
Thus, the strength and recent popularity of copula theory (Genest, Gendron, and Bourdeau-Brien, 2009) comes from its ability to capture not only the nonlinear relationships between variables but also extreme events through the tail dependency. In other words, it captures the structure of dependence in periods with extreme events (boom or crash) while allowing a better estimate (Nang, 2009).
The degree of dependence between financial assets is also paramount for investment decision makers, who provide key information to maximize profits via portfolio diversification that minimizes risk (Samuelson, 1967; Veldkamp and Van Nieuwerburgh, 2010; Bai and Green, 2010). It has been identified that assets with high positive dependence do not provide investors with the benefit of risk reduction, while assets with low dependence do provide investors with the benefit of risk reduction.
The bank capital requirements determined by the regulatory authorities require banks to have the necessary liquidity to deal with any capital contingency. Among the main sources of funds is the issuance of debt through the stock market.
In this context, there are three research questions that this paper intends to answer: Do publicly traded banks show similar behavior in their returns due to belonging to the same sector? Do the banking sectors of neighboring countries have similar behaviors in the returns of their shares? And is an investment portfolio with assets from the banking sector viable?
To answer these questions, we propose to estimate the patterns of dependence between the US banking sector and the Mexican banking sector. The intention of the article is not to analyze periods of instability (crisis); rather, the objective is to estimate the dependence between bank assets over a short period of time to identify whether there are similarities and therefore to determine whether an investment portfolio containing these assets is viable. For this, we take a representative sample of the main banks of both countries during the period 2015-2020. We use data from the closing daily stock prices from January 2, 2015, to December 31, 2020. The banks that make up our sample are JP Morgan, Bank of America, Wells Fargo, and Citi Group for the US and CitiBanamex, BBVA Mexico, Santander Mexico, and Banorte for the case of Mexico.
The estimation of dependence is made through copulas of the Archimedean family and using rolling windows of 245 days. That is, the trading days between the two countries are considered. We use copulas of the Archimedean family since through this family of copulas we can estimate not only the absolute dependence but also the tail dependence.
The rest of the article is structured as follows: After the introduction, a preamble section is presented with relevant information on the sample of US and Mexican banks covered in this study; subsequently a literature review section is presented, followed by a methodology section and then the results section. Finally, the discussion and conclusion are presented.
2. Preamble
Banks are one of the largest financial intermediaries in the world economy. By banks we commonly mean commercial banks, savings and credit associations, mutual savings banks, and credit unions. The role of banking in channeling funds from savers to borrowers with productive investment opportunities is paramount to ensuring that the economy operates efficiently, especially through services such as loans to both companies and individuals, the financing of real estate, and the management of checking accounts and savings accounts, as well as the implementation of credit and debit cards.
In this research, we focus on the banking sector in the US and Mexico. The number of banks that make up these sectors in each country is completely different; for example, the US banking sector has more than 2,000 banks, whereas Mexico's banking sector has only 50 banks, considering only multiple banking. These differences are to be expected, because in the case of the US we are dealing with a developed economy, while in the case of Mexico we have a developing economy.
Taking as a selection criterion the total assets (i.e., the size of operation), our representative sample of banks in each country comprises the following banking institutions: JP Morgan, Bank of America, Wells Fargo, and Citi Group in the US and CitiBanamex, BBVA Mexico, Santander Mexico, and Banorte in Mexico. The difference in the amount of total assets operated by the main banks of each of the countries is notable: as of 2020, the US banking sector (taking into account only its main banks) controls total assets of just over 8,714 trillion. This represents more than 40% of the total assets operated by the entire US banking sector. The Mexican banking sector (considering only its main banks) controls total assets of around 347 billion dollars. This represents just over 60% of the total assets traded by the entire Mexican banking sector.
Table 1 shows the total assets of our sample of US and Mexican banks for the period 2016 to 2020. In these five years, on average, the main US banks have more than 7,000 billion dollars in total assets, representing on average just over 44% of the total banking sector. The main Mexican banks have, on average, in these five years just over 300 billion dollars in total assets, in turn representing, on average, more than 60% of the total Mexican banking sector. Table 1 clearly indicates the importance of the sample of banks selected for this study. On the US side, the total assets of the selected banks represent almost half of the total banking sector, while in the case of Mexico’s major banks, their total assets represent almost two-thirds of the total of their banking sector.
Table 1 Total Assets of Major US and Mexican Banks (Billions of US Dollars)
| 2016 | 2017 | 2018 | 2019 | 2020 | |||||||
|---|---|---|---|---|---|---|---|---|---|---|---|
| $ | % | $ | % | $ | % | $ | % | $ | % | ||
| US Banks | JP Morgan Chase | 2,083 | 13.90 | 2,141 | 13.75 | 2,219 | 13.75 | 2,338 | 13.83 | 3,025 | 15.19 |
| Bank of America | 1,727 | 11.52 | 1,752 | 11.25 | 1,783 | 11.05 | 1,853 | 10.96 | 2,259 | 11.35 | |
| Wells Fargo | 1,677 | 11.19 | 1,747 | 11.22 | 1,689 | 10.47 | 1,713 | 10.13 | 1,768 | 8.88 | |
| Citigroup * | 1,350 | 9.01 | 1,385 | 8.90 | 1,407 | 8.72 | 1,454 | 8.60 | 1,662 | 8.35 | |
| Total of Sample | 6,837 | 45.62 | 7,025 | 45.12 | 7,098 | 43.98 | 7,358 | 43.51 | 8,714 | 43.76 | |
| Otder Banks | 8,148 | 54.37 | 8,543 | 54.88 | 9,041 | 56.02 | 9,553 | 56.49 | 11,197 | 56.24 | |
| Total Banks | 14,986 | 100 | 15,568 | 100 | 16,139 | 100 | 16,911 | 100 | 19,911 | 100 | |
| $ | % | $ | % | $ | % | $ | % | $ | % | ||
| Mexican Banks | BBVA Mexico | 93 | 22.30 | 102 | 22.47 | 105 | 21.78 | 113 | 21.69 | 123 | 21.89 |
| Santander Mexico | 66 | 15.83 | 66 | 14.54 | 69 | 14.32 | 75 | 14.40 | 93 | 16.55 | |
| CitiBanamex * | 54 | 12.95 | 58 | 12.78 | 63 | 13.07 | 65 | 12.48 | 68 | 12.10 | |
| Banorte | 50 | 11.99 | 54 | 11.89 | 60 | 12.45 | 61 | 11.71 | 63 | 11.21 | |
| Total of Sample | 263 | 63.07 | 280 | 61.67 | 297 | 61.62 | 314 | 60.27 | 347 | 61.74 | |
| Otder Banks | 154 | 36.93 | 174 | 38.33 | 185 | 38.38 | 207 | 39.73 | 215 | 38.26 | |
| Total Banks | 417 | 100 | 454 | 100 | 482 | 100 | 521 | 100 | 562 | 100 | |
Source: US Federal Reserve and Mexico’s Comisión Nacional Bancaria y de Valores.
Considering that one of the main purposes of banking is the optimal management of its assets to maximize its profits, banking seeks the highest possible returns on the loans it grants. While seeking to reduce the risk of default, this situation causes banks to make provisions for liquidity. In the search for liquidity and profit maximization, banks repeatedly seek sources of funds when issuing liabilities such as loans from other banks or companies or the issuance of debt in the stock market.
Table 2 Market Capitalization of the Major Banks of the United States and Mexico (Billions of US Dollars)
| 2016 | 2017 | 2018 | 2019 | 2020 | |||||||
|---|---|---|---|---|---|---|---|---|---|---|---|
| $ | % | $ | % | $ | % | $ | % | $ | % | ||
| US Banks | JP Morgan Chase | 307 | 31.65 | 366 | 31.61 | 320 | 35.87 | 430 | 37.99 | 388 | 42.97 |
| Bank of America | 222 | 22.89 | 304 | 26.25 | 238 | 26.68 | 311 | 27.47 | 262 | 29.01 | |
| Wells Fargo | 276 | 28.45 | 297 | 25.65 | 211 | 23.65 | 222 | 19.61 | 125 | 13.84 | |
| Citigroup * | 165 | 17.01 | 191 | 16.49 | 123 | 13.79 | 169 | 14.93 | 128 | 14.17 | |
| Total of Sample | 970 | 100 | 1,158 | 100 | 892 | 100 | 1,132 | 100 | 903 | 100 | |
| $ | % | $ | % | $ | % | $ | % | $ | % | ||
| Mexican Banks | BBVA Mexico | 44 | 64.71 | 57 | 69.51 | 35 | 61.40 | 37 | 59.68 | 33 | 58.93 |
| Santander Mexico | 10 | 14.71 | 10 | 12.20 | 8 | 14.04 | 9 | 14.52 | 7 | 12.50 | |
| Banorte | 14 | 20.59 | 15 | 18.29 | 14 | 24.56 | 16 | 25.81 | 16 | 28.57 | |
| Total of Sample | 68 | 100 | 82 | 100 | 57 | 100 | 62 | 100 | 56 | 100 | |
Source: Bloomberg.
Table 2 shows the market capitalization of the major banks in the US and Mexico in the period 2016-2020. The market capitalization is obtained by multiplying the price of each action by the number of shares issued. It can be seen that on average the market capitalization of the main US banks represents just over 1,000 billion dollars, while the main Mexican banks exhibit an average market capitalization of more than 60 billion dollars.
In summary, Tables 1 and 2 show the relevance of the sample of banks selected for this study. This is because of the amount of total assets as well as the market capitalization that our selected banks operate. Another compelling reason for our selection of banks is that these banks are listed on the stock exchanges of their respective countries. This means that these banks comply with the requirements imposed by the stock exchange, among which are a minimum number of investors and a minimum balance reported in their financial statements.
3. Literature Review
Among the studies on patterns of dependence through copulas between financial assets are various studies on stock indices, exchange rates, stocks, and bonds. We can also find studies on patterns of dependence between non-financial assets such as goods (oil prices, gold, etc.). In this research, we will focus on the study of patterns of dependence between bank shareholding assets, and for this reason, the review of the literature focuses on this topic.
Mensah and Premaratne (2014) analyze the patterns of both absolute and tail dependence in the Asian banking sector. The analysis is carried out considering 12 Asian banks during the period 2000-2012. In the estimation of the patterns of dependence, they use static copula models and copulas that vary over time. The copulas they propose are the Gaussian and Joe-Clayton copulas. The study concludes that dependence among Asian banks in developed economies is generally higher compared to Asian banks in emerging economies. They also conclude that the tail dependency is asymmetric in most of the pairs of banks analyzed, being greater on the lower side than on the top side. It highlights that dependency co-movements show significant spikes in response to the financial stress of the global economy. For their part, Liu, Cai, and Hamori (2018) study the structure of dependence between the share price of three banks in China, Beijing Bank, Ningbo Bank, and Nanjing Bank. Their study is carried out using copula models, making use of the Student's t copula, normal copula, rotated Gumbel copula, and symmetrized Joe-Clayton copulas (SJC). Their analysis is divided into two periods: one during the global financial crisis and the other during a crash in the Chinese stock market. They determine that Beijing Bank is less dependent on the other two banks and that Nanjing Bank is extremely dependent on the other two.
Some studies analyze the dependence of the banking sector taking into account credit risk. For example, Cerrato, Crosby, Kim, and Zhao (2015) analyze the asymmetric dependence and variation over time between the credit risk of global systemically important banks (G-SIBs) in the UK banking sector. This is done by using a CDS (Credit Default Swap) data set and modeling the dependence on CDS spreads using the dynamic asymmetric copula methodology. They conclude that the dynamics implemented and the asymmetries between the CDS differentials are closely associated with the probabilities of joint (or conditional) non-compliance. They report that their tail dependency analysis can serve as a leading indicator of systemic credit events. In addition, Koziol, Schell, and Eckhardt (2015) propose to implement copulas other than the Gaussian one in credit risk models, in which they analyze the impact of different copulas on the application of stress tests using supervisory data from 17 German banks. They identify that the use of Gaussian copulas in credit risk is the most appropriate option to estimate high stress effects in extreme scenarios and that otherwise when there are cases of less severe scenarios, the best estimate is provided by heavy-tailed copulas such as Clayton or t-Student copulas.
Among the works that analyze the dependence between the banking sector and in turn estimate the potential losses through the implementation of some of the metrics of Value at Risk, we have the works of Karimalis and Nomikos (2014). Using the Conditional Risk Value (CoVaR) estimate and the Conditional Expected Shortfall (CoES) estimate, this study proposes the implementation of copula to improve the estimation of potential losses of banks belonging to the STOXX Europe 600 Banks Index. This index is composed of the 46 largest banks in Europe, which are characterized by their large market capitalization, their international activity, and their representative size in their respective local markets. The dependency estimate proposed by Karimalis and Nomikos (2014) is between the performance of the financial system and the performance of the banking institution. For this, each bank is given an equal weighting of the average returns of the remaining banks which is used as a proxy for the financial system. In their study, they consider four types of copulas: The Clayton, Frank, Gumbel, and BB7 copulas, and they also propose two adjustments through the marginal distributions. They take the case of marginal Gaussians as the case of a marginal t-Student, and depending on the specific characteristics of each bank, such as the size, leverage, and beta of capital, these features contribute to systemic risk. For their part, Alqahtani, Trabelsi, Samargandi, and Shahzad (2020) analyze the structure of dependence of the tail between the banking sector of the US and the banking sector of the Gulf Cooperation Council (GCC) during the period 2010-2017. They estimate the CoVaR and identify the benefits of conditional diversification. They identify that the GCC banking sector shows a lower tail dependence on the US banking sector, facilitated by the fact that the GCC banking sector receives a higher spillover of downside risk from the US banking system. They also identify that the portfolio composed of US bank stocks and the portfolio composed of GCC bank shares provide relatively similar benefits and therefore a process of diversification with these financial assets cannot be fully considered.
There are also studies of the banking sector with the implementation of dependency metrics comparable with the copula methodology. For example, Segoviano and Goodhart (2009) propose a set of bank stability measures that takes into account dependence; for this, they combine the banking system as a portfolio of banks and infer the banking system’s multivariate density (BSMD), which incorporates linear and non-linear dependency structures between the banks of the system. They complement their analysis by implementing the Consistent Information Multivariate Density Optimizing (CIMDO) approach, which incorporates dependence estimation via copulas. They conclude that it is important to achieve greater accuracy in the upper right corner of the empirical CDF, in other words the left tail of the copula function, because there is greater relevance in estimating extreme losses of a portfolio of financial assets.
Research that incorporates contagion cannot be missed. The contagion is widely analyzed via the copula methodology. An example is the work of Adam, Banbula, and Markun (2013), who investigate the structure of dependence and contagion between financial assets of the Polish capital market and a set of foreign financial assets, among which the EURO STOXX Banks Index, a banking sub-index for the EMU banks with the largest capitalization (EU BANKS) stand out. The study shows that Polish equities, the exchange rate, and somewhat long-term sovereign bonds exhibit significant tail dependence and also finds that the symmetrical behavior of the tail characterizes most asset pairs, although they also exhibit significant asymmetries in several cases.
There are also studies that involve more sophisticated copulas and studies with censored data. Lucas, Schwaab, and Zhang (2014) develop a high-dimensional non-Gaussian model to infer risk measures for companies in the European financial sector. The model they propose is based on a generalized hyperbolic skewed-t block-equicorrelation copula which includes time-variant volatility and dependence considering asymmetry (tail dependence). They apply their model to assess the joint risk of multiple defaults by financial companies in the euro area during the 2008-2012 financial and sovereign debt crisis. They conclude that the risks measured through tail dependence during crisis episodes are more significant.
For their part, Calabrese and Osmetti (2014) propose a methodology based on a Marshall-Olkin (MO) copula to model the cross-border systemic risk between banks in Italy, Germany, and the United Kingdom in the period 1995-2012. They emphasize banks with difficulties (bank failures), taking these into account as censored samples. The contribution of the work lies in the implementation of an estimation procedure for the MO copula on censored data. They conclude that the European banks they analyzed show that the proposal to consider censored data makes it possible to avoid the possible underestimation of the risk of contagion.
Most of the papers reviewed here use the Akaike Information Criterion (AIC), the Bayesian information criterion (BIC), or both to identify which copula is the best fit.1 In this research paper, we use the AIC. Finally, we must mention that, in the case of Mexico, there is practically no literature on the estimation of dependence between bank shareholding assets, hence the importance of this research.
4. Methodology
As mentioned in previous sections, copula theory estimates patterns of dependence characterized by considering nonlinearity and asymptotic dependence. Below, we present in greater detail the theory of copulas, starting with their definition. A copula function is defined as a multivariate distribution function generated by marginal functions. Through Sklar’s theorem we know that, for every multivariate distribution function, a copula can easily be derived.2
Sklar's theorem
Let
where the copula function "
This result admits that it is permissible to choose different marginal distribution functions in the construction of the copula function and the generation of a dependency structure given by the copula function. This contrasts with the usual way of constructing multivariate distribution functions, which has the restriction that marginal distribution functions are usually of the same type. In this research paper, the returns of the banks under analysis are marginal distribution functions. To have a more refined capture of the behavior of our sample of banks, we propose smoothing through a kernel adjustment to its marginal distribution functions and then building of the copula functions.
Gaussian Kernel Marginal Distribution Function
A kernel distribution function is defined by a smoothing function and a bandwidth value that control the smoothness of the resulting density curve.3 If
where
Once the marginal distributions to be used in the copula methodology are estimated, it is necessary to establish which copula will be used in this work. Nowadays, there are a considerable number of copulas; however, the copulas proposed in this research belong to the Archimedean family. This family of copulas makes it possible to consider the asymmetry in the copula functions and to estimate not only the absolute dependence but also the extreme dependence through the tail dependence. It should be said that this family of copulas is distinguished by considering the asymmetry by giving greater weight to the estimates of the tails. This type of copula is proposed for its simplicity and for the particularity of the inclusion of extreme dependence. In the present work, we only enunciate bivariate copulas, that is, copulas generated through the interaction between only two marginal distribution functions.
Archimedean Copulas
The bivariate distribution belonging to the family of Archimedean copulas is represented as
where
The selection of a generator results in different copulas belonging to the Archimedean family. In relation to this work, only three copulas of this Archimedean family are specified: the Clayton copula, the Gumbel copula, and the Frank copula.
Clayton Copula
The bivariate copula belonging to the Clayton family is:
with generator
Gumbel Copula
The bivariate copula belonging to the Gumbel family is:
with generator
Frank Copula
The bivariate copula belonging to the Frank family is:
with generator
Estimation of Copula Parameters
There are several methodologies for estimating the parameters associated with a copula. In this work, we make use of the estimation through maximum likelihood. This estimation mechanism can be applied to any family of copulas as it obtains the estimation of the parameters of the copula through the maximization of its log-likelihood function.
The log-likelihood function is defined as:
where
Thus, given the set of marginal distributions and a copula, the log-likelihood function can be maximized by obtaining thus the maximum likelihood estimator:
Measure of Dependence by Kendall’s Tau
Kendall’s Tau
In the copulas of the Archimedean family, there is a relationship between the dependency parameter and Kendall’s Tau concordance parameter. Kendall’s Tau parameter serves as a perfected dependency parameter, since its calculation is based on ranges, as noted below.
Let
The Pearson correlation is given by:
The Kendall correlation is defined by
It is observed that Kendall's
Tail Dependence
Another dependency measure that can be obtained by copulas is the tail dependency, which estimates the dependency on periods with extreme events. The tail dependency is defined below.
Let
The coefficient of the upper tail dependence of
The coefficient of the upper tail dependence can be expressed in terms of the bivariate copula between
If this is true, then
In the same way, the coefficient of lower tail dependence of
And the coefficient of lower tail dependence expressed in terms of the bivariate copula between
If this is true, then
Regarding the copulas proposed in this work, the tail dependence of the Archimedean copulas is as follows: the Clayton copula is characterized by upper tail dependence and lower tail independence, that is,
Summary Table of Dependency Measures with Archimedean Copulas
In summary, the dependency measures to be estimated in this research are that of Kendall’
Table 3 Parameters
| Copula | Parameter | Kendall's τ |
|
|
|
|---|---|---|---|---|---|
| Archimedean | Clayton |
|
|
0 |
|
| Gumbel |
|
|
|
0 | |
| Frank |
|
|
0 | 0 | |
Source: Author’s own elaboration.
It should be noted that one of the main features of the Archimedean family copulas with respect to other copulas is that it is easy to estimate and that it weights the asymmetry in the structure of the data. In this regard, the Archimedean copula family estimates not only the absolute dependence but also the dependence of the tails of the multivariate distribution functions constructed through the copulas. It is important to mention that one of the characteristics of the distributional behavior of a financial series is its asymmetry and leptokurtosis, as it is the case of the returns of the stock prices of the main banks in the US and Mexico (see Table 4), which will serve for the analysis proposed in this research. Hence, the use of methodologies such as the one proposed in this study together with the specific use of copulas that better capture the asymmetric and leptokurtic behavior will lead to better estimates of the dependency relationship between the main banks in the US and Mexico.
5. Empirical Evidence
Since the proposed dependency analysis has an impact on the formation of investment portfolios and given that the rebalancing of an investment portfolio in practice takes place after two years on average, we propose to study the dependence between banks for a period of five years to give enough time for rebalancing of an investment portfolio to take place. To study the dependence between the main banks of the US and Mexico, we use data from the daily closing stock prices from January 2, 2015, to December 31, 2020. The data set covers eight banks. The selected US banks are JP Morgan, Bank of America, Wells Fargo, and Citi Bank, while the selected Mexican banks are CitiBanamex, BBVA Mexico, Santander Mexico, and Banorte. It should be noted that US banks are listed on the New York Stock Exchange in US dollars and the Mexican ones are listed on the Mexican Stock Exchange in Mexican pesos. The data used in this research were obtained from Yahoo Finance and Bloomberg. To homogenize the data, the stock prices of the main banks of Mexico were converted to dollars considering the corresponding exchange rate. Due to the holidays or non-working days in the stock markets of each country, the data were homogenized considering only the same days with quotation. Graph 1 shows both the prices and yields of the major US and Mexican banks.
Graph 1 shows that three of the major US banks, JP Morgan, Bank of America, and Citigroup, show relatively similar behavior in their stock prices and yields, while Wells Fargo is an exception. Regarding the main banks in Mexico, Graph 1 shows that they all exhibit different behaviors in their prices and yields during the time horizon under analysis. Similar trends among the stock market behavior of the main Mexican banks occur only sometimes. The downturn exhibited at the beginning of 2020 in all the main banks of the US and Mexico analyzed is noteworthy, as it created a cluster of volatility observed in the yields of the share prices of these banks. The fall in stock prices at the beginning of 2020 was the result of the global economic crisis caused by the SARS-CoV-2 virus, which caused the main stock markets of the world to experience collapses between the end of February and mid-March after the confirmation of the first infections of the COVID-19 virus on the American continent followed by the announcement (on March 11, 2020) made by the World Health Organization (WHO) that SARS-CoV-2 was causing a global pandemic.
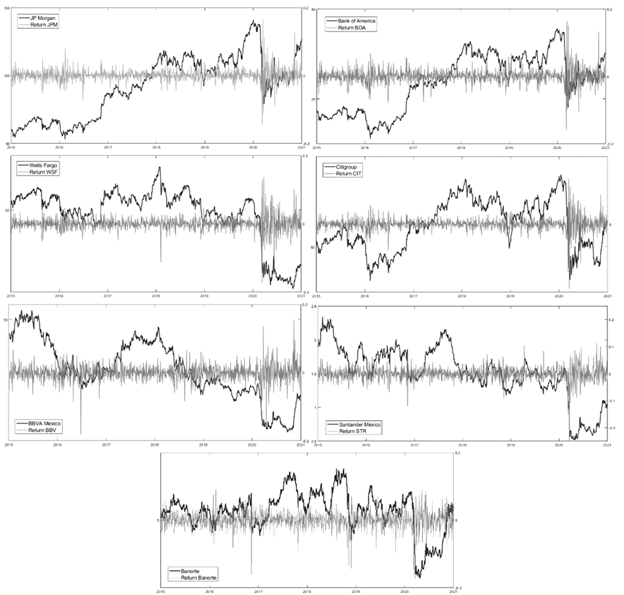
Source: Author’s own elaboration using data from Yahoo Finance and Bloomberg.
Figure 1 Price and Yields of the Main Banks of the United States and Mexico, 2015-2020
Using various descriptive statistics, Table 4 shows that the yields of stock prices of the main banks in the US and Mexico exhibit a nonlinear behavior, high kurtosis, asymmetry, and non-normality. The last statistic is corroborated through the Jarque-Bera normality test. Table 4 also shows that the banks JP Morgan and the Bank of America present positive asymmetry while the rest of the main US and Mexican banks present negative asymmetry. Due to the nonlinearity of the yields, we decided to use the Gaussian kernel adjustment prior to the estimation of the dependence through copulas. This adjustment serves to obtain marginal distribution functions adjusted through a Gaussian kernel behavior to each of the yields of the main banks analyzed. With the Gaussian kernel adjustment, each marginal function will have different Gaussian kernel parameters depending on its distributional structure.
Table 4 Descriptive Statistics of the Major Banks of the United States and Mexico, 2015-2020
| JP Morgan | Bank of America | Wells Fargo | Citigroup | BBVA Mexico | Santander Mexico | Banorte | |
|---|---|---|---|---|---|---|---|
| JPM | BOA | WSF | CIT | BBV | STR | BTE | |
| Mean | 0.0005 | 0.0004 | -0.0004 | 0.0001 | -0.0005 | -0.0004 | 0.0000 |
| Median | 0.0003 | 0.0006 | -0.0002 | 0.0002 | -0.0004 | -0.0001 | 0.0008 |
| Maximum | 0.1656 | 0.1638 | 0.1357 | 0.1654 | 0.1549 | 0.1131 | 0.0909 |
| Minimum | -0.1456 | -0.1590 | -0.1728 | -0.2375 | -0.1809 | -0.2481 | -0.1729 |
| Std. Dev. | 0.0182 | 0.0209 | 0.0195 | 0.0231 | 0.0225 | 0.0242 | 0.0249 |
| Skewness | 0.2071 | 0.1011 | -0.3657 | -0.8973 | -0.2777 | -1.0695 | -0.9924 |
| Kurtosis | 16.1662 | 12.5787 | 14.9369 | 19.9202 | 10.6574 | 14.5721 | 9.2394 |
| Jarque-Bera | 10613.66 | 5614.64 | 8748.28 | 17708.70 | 3605.39 | 8470.96 | 2622.21 |
| Probability | 0.0000 | 0.0000 | 0.0000 | 0.0000 | 0.0000 | 0.0000 | 0.0000 |
Source: Author’s own elaboration using data from Yahoo Finance and Bloomberg.
To estimate the dependence between the yields of the stock prices among the main banks of the US and Mexico, we use the following copulas of the Archimedean family: the Clayton, Gumbel, and Frank copulas. The estimation makes use of a 245-day rolling window; that is, each window (sub-series) of the main series corresponds to 245 days. Given the main series,
The estimated copula is bivariate; that is, if there are seven main banks in the US and Mexico, this leads to 21 different pairs of combinations between the banks analyzed. Since we are using three different copulas, this results in 63 estimates for each window generated. Therefore, in total we have 77,112 estimates. The main information criteria for copulas are the AIC and BIC. However, in this study only the AIC is reported because 1,224 copulas are estimated for each pair of banks. Having a large number of estimates coupled with the characteristics of the data means that estimates (amounts/percentages) generated by some other information criteria do not vary much. Therefore, we chose to report only the AIC. Table 5 summarizes the results of both the number of times that one copula obtained the best fit and the percentage that it represents with respect to the other copulas.
Table 5 Estimated AIC test by windows to determine the best copula (number and percentage obtained by each copula)
| Clayton | Frank | Gumbel | Clayton | Frank | Gumbel | Clayton | Frank | Gumbel | |||
|---|---|---|---|---|---|---|---|---|---|---|---|
| JPM-BOA | 0 | 120 | 1104 | BOA-CIT | 2 | 225 | 997 | WSF-BTE | 654 | 322 | 248 |
| BOA-JPM | 0.00% | 9.80% | 90.20% | CIT-BOA | 0.16% | 18.38% | 81.45% | BTE-WSF | 53.43% | 26.31% | 20.26% |
| JPM-WSF | 80 | 131 | 1013 | BOA-BBV | 361 | 545 | 318 | CIT-BBV | 480 | 629 | 115 |
| WSF-JPM | 6.54% | 10.70% | 82.76% | BBV-BOA | 29.49% | 44.53% | 25.98% | BBV-CIT | 39.22% | 51.39% | 9.40% |
| JPM-CIT | 0 | 252 | 972 | BOA-STR | 573 | 268 | 383 | CIT-STR | 625 | 422 | 177 |
| CIT-JPM | 0.00% | 20.59% | 79.41% | STR-BOA | 46.81% | 21.90% | 31.29% | STR-CIT | 51.06% | 34.48% | 14.46% |
| JPM-BBV | 494 | 280 | 450 | BOA-BTE | 727 | 494 | 3 | CIT-BTE | 700 | 505 | 19 |
| BBV-JPM | 40.36% | 22.88% | 36.76% | BTE-BOA | 59.40% | 40.36% | 0.25% | BTE-CIT | 57.19% | 41.26% | 1.55% |
| JPM-STR | 743 | 144 | 337 | WSF-CIT | 27 | 404 | 793 | BBV-STR | 453 | 341 | 430 |
| STR-JPM | 60.70% | 11.76% | 27.53% | CIT-WSF | 2.21% | 33.01% | 64.79% | STR-BBV | 37.01% | 27.86% | 35.13% |
| JPM-BTE | 680 | 512 | 32 | WSF-BBV | 397 | 622 | 205 | BBV-BTE | 592 | 292 | 340 |
| BTE-JPM | 55.56% | 41.83% | 2.61% | BBV-WSF | 32.43% | 50.82% | 16.75% | BTE-BBV | 48.37% | 23.86% | 27.78% |
| BOA-WSF | 24 | 249 | 951 | WSF-STR | 638 | 401 | 185 | STR-BTE | 215 | 291 | 718 |
| WSF-BOA | 1.96% | 20.34% | 77.70% | STR-WSF | 52.12% | 32.76% | 15.11% | BTE-STR | 17.57% | 23.77% | 58.66% |
Source: Own elaboration.
Table 5 reveals that the dependence between the main banks of the US and Mexico should be estimated considering the asymmetry in the left tail. This is because the copula that showed a better fit was the Clayton copula (11 of 21), which emphasizes the behavior of the left tail. This result is consistent with the analysis of yields, where most of them had a negative asymmetric behavior. It can also be seen from Table 5 that the positive asymmetry shown in Table 4 by the banks JP Morgan and the Bank of America is ratified, since the best fit is given by the Gumbel copula, which emphasizes the behavior of the right tail. The positive asymmetry can also be confirmed by the high percentage shown by the AIC test in the combination between the banks JP Morgan and the Bank of America as well as the combinations with the other US banks.
The results in Table 5 also show that the major US banks have relatively similar behaviors during the upswing (right tail of their yields), while Mexico's main banks have relatively similar behavior during the downswing (left tail of their yields). However, these downswings are not as recurrent as the upswings shown by the main US banks. This is so because of the average percentage values shown by the AIC test of the different copulas of Mexican banks.
Taking as a starting point the results in Table 5, which shows the copulas that obtained the best fit, we graph the patterns of absolute dependence and tail dependence between the yields of the stock prices of the main banks of the US and Mexico with the copulas showing the best adjustment (see Graph 2).

Source: Own elaboration.
Figure 2 Patterns of Dependence between the Main Banks of the USA and Mexico.
Graph 2 shows the high dependence that US banks have among themselves, mainly between JP Morgan and the Bank of America, which have absolute dependence parameters above 0.7 for most of the time horizon under analysis. Likewise, the absolute dependence shown by Citigroup with these two banks is around 0.7 on average, with two periods where it exceeds 0.7 in 2016 and throughout 2020. For its part, Wells Fargo has absolute dependency patterns below 0.7 for most of the horizon analyzed, although the dependency exceeds 0.7 in 2016 and throughout 2020. It should be noted that if one considers the tail dependence, it stands out that for all combinations of US banks, the copula that obtained the best fit was the Gumbel copula, which tends to give a greater weight to the right tail. This means there is a greater concentration of yields during the upswing. Graph 2 shows that the tail dependency among US banks is around 0.8, but below it at times (2017 to 2019) and above it at other times (2016 and 2020). Only the combinations of Wells Fargo versus the other US banks are below the 0.8 tail dependency.
With regard to the patterns of dependence between US and Mexican banks, Graph 2 shows that this dependence is very low. Frequently, the absolute dependence is below 0.3, especially in the period from mid-2017 to early 2020, when the average absolute dependency pattern was 0.1. Only the bank BBVA Mexico presents patterns of absolute dependence in conjunction with US banks above 0.4 at times but below 0.4 on average. Regarding the tail dependence between US and Mexican banks, the copula that obtained the greatest adjustment was the Clayton copula; only the case of the bank BBVA Mexico versus the majority of US banks obtained the best adjustment with the Frank copula. The Clayton copula gives greater weight to the left tail; in this case, the fact that the data showed a greater weight towards the left tail means that there was a greater concentration of yields in the downswing. The Frank copula does not give greater weight to any of the tails of the joint distribution, although it does give weight to both tails given the characteristics of the data.
Finally, with regard to the patterns of dependence between Mexican banks, Graph 2 reveals the low dependence that these banks show among themselves. These banks show an absolute dependency parameter below 0.3 for most of the time horizon under analysis. The patterns of absolute dependence shown between the banks Santander Mexico and Banorte are noteworthy, since at times they exceed 0.4. Considering the tail dependence, the copula that obtained the best adjustment for the combinations of BBVA Mexico versus the other Mexican banks was the Clayton copula. The exception was the combination of the banks Santander Mexico and Banorte, where the copula that gave the best adjustment was the Gumbel copula.
An important pattern to consider in Graph 2 is that from the beginning of 2020 (after the confirmation of the first COVID-19 infections), there is an increase in the dependency patterns between the yields of the major banks in the US and Mexico. For the case of US banks, the absolute dependence in 2020 is above 0.7 and the tail dependence is on average at 0.8. For the combinations of US and Mexican banks, the patterns of absolute dependence and tail dependence are on average above 0.3 and 0.5 respectively. Finally, for the case of combinations of Mexican banks, the absolute dependence is on average 0.3 and the tail dependence is 0.5.
The results referring to the patterns of dependence between the major US and Mexican banks show two essential features. First, the patterns of dependence obtained between the major US banks show a high dependence. Hence the joint selection of these US bank assets in an investment portfolio would not help to reduce risks given the similarity found between them. Second, the patterns of dependence obtained in the interaction between the main US and Mexican banks and in the interaction only between the main Mexican banks is low. Therefore, the joint selection of these bank assets in an investment portfolio would help to reduce risks given the low similarity found between these assets. It must be noted that this portfolio should contain few US assets given the high dependence found among them.
The results obtained in this research are consistent with the results reported by Mensah and Premaratne (2014), who conclude that the dependence shown among banks in developed economies is higher than that shown among banks in emerging economies. In our case, our results confirmed that the main US banks, which correspond to a developed economy, showed high dependence, while the main Mexican banks, which correspond to a developing economy, showed low dependence. The implications of this finding are discussed in the next section.
6. Discussion
Our finding that there are patterns of high dependence among banks in the US and patterns of low dependence among banks in Mexico requires some discussion. Since dependency was measured using daily stock price data from four US and three Mexican banks, the immediate question that emerges from this study is: What is the relationship between the stock prices of banks and the banking systems of the US and Mexico?
To begin answering this question, it is necessary to emphasize that the banking systems of the countries studied are quite different. Table 1 has already shown the disparity between the total assets controlled by US banks compared to Mexican banks. Table 2 shows that in terms of market capitalization there is also disparity between the two banking systems. The number of banks that operate in each country (more than 2,000 banks in the US and 50 banks in Mexico) as well as the level of penetration of the financial sector as a proportion of gross domestic product (GDP) are also quite different4.
On the other hand, if we consider that the price of a good/service (and the corresponding share price) is nothing more than a reflection of supply and demand for the good, it is possible to think that the high dependence among US banks found in this study could reflect the convergence of financial practices and regulations that tend to create a highly competitive financial market where supply and demand tend to move in the same direction. The expansion strategies that banks in developed countries have followed (e.g. strategic acquisitions as in the case of Citigroup acquiring Banamex) are examples of practices that tend to converge. According to the Bank for International Settlements (BIS, 2014, 2018), this convergence of financial practices and regulations has led banks from developed countries to seek to expand into emerging economies, fleeing from the reduced profit opportunities in the countries of origin and seeking a favorable environment in the financial regulations of emerging countries.
With tougher financial regulations as well as more competitive markets in developed countries, the banking sector in emerging countries (including Mexico) is theoretically well positioned to capture a portion of this market. In this context, it is striking that in the Mexican case there is not a high dependence between banks’ stock prices. A factor that may help explain this phenomenon is the fact that the Mexican banking system is dominated by foreign banks. This domination causes the business models of banks to be different and instead of experiencing a convergence in financial practices, there is rather a divergence between the practices of foreign banks in comparison to national banks.
Thus, the global trend identified by BIS (2014, 2018) regarding financial integration between commercial banks of emerging countries with advanced economies does not seem to occur in the case of Mexico, where foreign banks that dominate the Mexican banking market are European rather than North American. Thus, the potential benefits of financial integration (e.g., resource allocation efficiency, better availability of specialized financial services, market deepening, regional distribution of risk) are not present in the case of Mexico and we believe this is reflected in our finding on the patterns of low dependency among Mexican banks.
Interestingly, Mexico is not the only case where commercial banks’ stock prices show low dependence. For the case of Asian banks, Mensah and Premaratne (2014) found that the dependence among banks’ stock prices in developed Asian economies is higher compared to the dependence among banks in emerging Asian economies. Although more research is needed to determine whether the low dependence of banks’ stock prices in developing countries is a global phenomenon, our work contributes to expanding the empirical evidence in this direction.
The low dependency among Mexican banks may also be related to other structural challenges faced by the Mexican banking system identified by Avalos and Hernandez 2006: 1)) the low level of development of the Mexican banking system compared to the US, 2) challenges concerning the legal framework, where transparency in Mexican financial markets is low, and 3) a lack of competition in the Mexican banking sector.
Although the factors mentioned above can help us explain the low dependency among Mexican banks, the economic implications of these structural challenges also have effects that complicate the convergence between the Mexican and US banking systems. For example, Avalos and Hernandez (2006) document how, despite the dominance of foreign banks, Mexico has not enjoyed the benefits that an efficient financial intermediation normally brings, since the intermediation margins remain at relatively high levels compared to international standards, mainly damaging the promotion of productive activities.
Given the structural challenges facing the Mexican banking system identified in this section, it is not surprising that the results of monetary policy in the countries studied have different effects. An example of this is the monetary policy adopted by the US and Mexico to deal with the COVID-19 pandemic. Although the central banks agreed to reduce their interest rates to levels close to zero to keep the level of consumption and the availability of credit afloat, the levels of success obtained to reactivate the corresponding economies were different since there are big differences between the banking and financial systems in both countries. In other words, the structural challenges of the Mexican banking and financial system ended up reducing the efficiency of the Mexican monetary policy.
Finally, there are also recent studies whose methodology makes use of the copula theory where the growing integration of the Mexican capital market with the global capital market has been documented (e.g., Herrera et al. 2015; Lorenzo and Massa, 2013). However, our study reveals that when selecting companies from a certain sector (banking in our case), the relationship between the prices of their respective shares can become non-integrated. In other words, our study suggests that we could be facing an example of a compositional fallacy where what appears to be true for a set of companies from various sectors of the economy does not appear to be true for specific sectors.
7. Conclusions
In this paper, we estimated the patterns of dependence between the yields of the stock prices of the main banks of the US and Mexico: JP Morgan, Bank of America, Wells Fargo, and Citi Group were the banks studies for the US, while Citibanamex, BBVA Mexico, Santander Mexico, and Banorte were studied for the case of Mexico. The period under analysis was January 2, 2015, to December 31, 2020. The patterns of absolute dependence and tail dependence were estimated through copulas of the Archimedean family and the use of rolling windows of 245 days.
The results of this study allow us to conclude that: i) there are patterns of high dependence among the main banks in the US, ii) there are patterns of very low dependence among the main banks in the US and Mexico, and iii) there are patterns of low dependence among the main banks in Mexico. As mentioned in the discussion section, these results may be driven by the sharp differences among the banking systems in Mexico and the US. The high dependence among the main banks in the US may be explained by the convergence of financial practices and regulations that tend to create a highly competitive financial market where supply and demand tend to move in the same direction. In the case of Mexico, several structural challenges faced by the banking system and the fact that this banking system is dominated by foreign banks may be the key factors explaining the low dependence among banks in Mexico. The sharp differences among banking systems may also have effects on the efficiency of monetary policy enforced by the corresponding central banks.
Our findings also imply that the high dependency patterns obtained among major US banks limit the joint selection of these US bank equity assets in an investment portfolio. This is because the similarity found between these shareholding assets cannot contribute to the reduction of risks. On the other hand, the patterns of low dependence obtained in the interaction between the main US and Mexican banks and in the interaction only between the main Mexican banks favors the joint selection of these bank stock assets in an investment portfolio. This is because the non-similarity found between these stocks’ shares contributes to the reduction of risks. It must be mentioned that such an investment portfolio should contain few US bank equity assets due to the high dependence identified between them.
Our results also allow us to conclude that not all banks listed on a stock exchange have a similar behavior in their prices and yields just because they belong to the same sector. This conclusion is grounded in the fact that the dependence on bank stock returns is higher between banks belonging to a developed economy (US banks) compared to the dependence between banks belonging to an emerging economy (Mexican banks). Consequently, it can be deduced that merely being the banking sectors of neighboring countries does not mean they have similar behaviors in the yields of their shares.
Another implication of our results is that an investment portfolio with only assets of the banking sector should be viable. If what is sought is to minimize the risks in the investment portfolio, such a portfolio may contain any of the Mexican bank shareholder assets but few US bank shareholding assets due to the high dependence identified among them.
Finally, future research can expand the work initiated in this paper by including the banking sectors of other countries or conducting studies by economic bloc. For example, the dependence in the banking sector of the member countries of the USMCA/T-MEC or of the MILA (Mercado Integrado Latinoamericano) could be analyzed. Likewise, studies of the dependence between the banking sectors by geographical location (e.g., different continents) and developed versus emerging economies could be carried out.

