


 nueva página del texto (beta)
 Inglés (pdf)
 Artículo en XML
 Referencias del artículo
 Enviar artículo por email
 Citado por SciELO
  Similares en
SciELO
Similares en
SciELO 
 Permalink
1. Introduction
The study of the relationship between changes in oil prices and stock returns has been the main topic of several investigations (Thorbecke 2019, Sharma et al. 2018, Ben Cheikh et al. 2018). Oil is a cornerstone input for economic activity, since it represents a significant cost in a great number of productive processes and services, such as any type of transportation. Furthermore, in oil-producing countries, oil price fluctuations have a considerable impact on public finances, as government revenues are highly dependent on taxation received through oil sales. Also, in many of these nations, oil revenues finance social programs as well as infrastructure projects, therefore having a direct impact on aggregate demand. In this context, from the perspective of an investor, any strategy that seeks to mitigate portfolio risk should be sustained in a clear understanding of the interaction that exists between oil prices, firms’ performance and public finances.
Likewise, there has been a growing interest in research related to the interaction between oil and equity markets volatility as a consequence of an increasing integration of global financial markets and the implications that the latter represent for several economic agents that operate in them. Even though various conclusions have been reached related to this subject, there is a substantial divergence among them. It is worth mentioning that research on the relationship between oil prices and stock returns has concentrated mainly on developed markets, and to a lesser extent on emerging countries (Degiannakis et al. 2017). Furthermore, the literature regarding the impact of oil price fluctuations over the Stock Exchange in Mexico is relatively scarce and therefore represents an opportunity for a more in-depth study in this analysis. This would allow portfolio managers and other investors to have more tools to mitigate the market risk to which their respective strategies are exposed. Therefore, this paper focuses exclusively on the case of Mexico to improve its risk-related knowledge and contribute to investors’ decision-making processes. In particular, this investigation focuses on the response of selected sectoral stock indices volatility to oil price fluctuations, which, to the authors’ best knowledge, is an approach that has not yet been considered for the case of the Mexican Stock Exchange, although other works have focused on specific firms’ responses to oil shocks (Valdés et al. 2012).
The remaining structure of this work is as follows: Section 2 includes a brief but integrating revision of the literature concerning previous studies about the relationship between oil and stock price returns, at a global and specific Mexican market level; Section 3 describes the methodology chosen to estimate the relationship between oil prices and the returns of selected sectors of the Mexican Stock Exchange; Section 4 presents an analysis of the data used and its sources; Section 5 presents and discusses the results obtained; and, finally, Section 6 states the main conclusions found in this investigation.
2. Previous studies on the relationship between oil and stock price returns
As mentioned in the previous section, a significant amount of literature has focused on the relationship between stock markets and oil prices, although with divergent approaches and results. An example of these studies is that of Basher et al. (2012), which analyzes the simultaneous relationship between stock prices of emerging markets, their exchange rates and oil prices. With a SVAR model, these authors investigate the dynamic relationship between those three variables. One of the most important findings is that positive shocks in oil prices tend to diminish stock prices in emerging markets, as well as depreciate the US dollar against their respective currencies.
Bouoiyour et al. (2017) perform an analysis of the response of stock returns to oil price shocks, segregating by oil importing and oil exporting countries. With the implementation of a quantile regression model, the authors find that there is significant disparity in the interaction between stock returns and prices of the energy input of both groups. They conclude that oil exporting countries, such as Venezuela, Russia and Saudi Arabia, are typically more sensitive to oil shocks caused by demand-side pressures than net oil importer nations. Filis et al. (2011) address a similar approach by analyzing the dynamic correlation between oil prices and the stock exchanges of oil exporting and importing countries. In their study, the authors make use of a DCC-GARCH-GJR model that produces the interesting result that correlation increases positively when there are demand-side shocks over oil prices, although lagged correlations turned out to be negative.
In a regional approach, Degiannakis et al. (2014) study the effects of oil price fluctuations over stock market volatility in Europe with SVAR and APARCH models. Among their results, the authors find that supply-side shocks (production) of oil do not affect stock volatility, although demand-side shocks do have an effect by diminishing volatility in variable-income securities. The latter is attributed by the authors to the fact that an increase in commercial activity, which puts pressure on oil prices, translates into more consumption and investment by economic agents in European markets, which ends up favoring enterprises. Likewise, another work that performs a regional analysis is that of Arouri et al. (2011), which studies the relationship and volatility transmission mechanisms between oil prices and stock returns of the Gulf Cooperation Council (GCC) countries for the period between 2005 and 2010. This research incorporates a VAR-GARCH model that allows simultaneous transmission effects both in stock returns, oil prices, and other analyzed variables. The paper presents substantial evidence of the transmission effects between equity returns and oil prices, particularly in Bahrein, Oman and Qatar, although the direction and sign of the relationship differs among nations. On a similar basis, Gomes and Chaibi (2014) implement BEKK-type bivariate GARCH models to estimate the volatility and its transmission mechanisms between the oil prices and stock returns of 21 selected countries. This work reports the presence of a statistically significant transmission mechanism between oil price shocks and some of the analyzed markets. In a few cases, bidirectional effects are also found. For the case of Latin America, Santillán-Salgado et al. (2017) analyze the impact of oil prices on stock markets in major LATAM countries such as Argentina, Brazil, Chile, Colombia, Mexico and Peru. By implementing a random effects model with panel data, the authors’ main finding is that in the region as a whole, an increase of oil price has a positive relation with stock returns. Likewise, Rodríguez-Benavides, et al. (2019) examine the impact of international oil price volatility on the main Latin American stock market returns by estimating an autoregressive structural vector with GARCH-in-Mean Effects (SVAR-MGARCH-M) model. Their results show that oil price volatility is relevant in an immediate way in Colombia, although there is evidence of asymmetrical effects to positive and negative fluctuations of the international price of oil in all of the other major Latin American countries analyzed.
Furthermore, the impact of oil price fluctuations in different economic sectors has also been studied. For example, Demiralay and Gencer (2014) address the volatility transmission mechanisms between oil prices and stock returns of five economic sectors of an emerging market benchmark. The authors make use of the stock indices that Morgan Stanley Capital International (MSCI) estimates for the financial, energy, telecommunications, materials and industrial sectors. The methodology applied was an asymmetric VAR-GARCH model, the results of which concluded that stock return volatility is indeed affected by oil price movements; however, the magnitude of this effect varies among economic sectors. Importantly, both in the financial and energy sectors, a unidirectional and negative transmission effect from oil prices to stock returns was identified, while in the case of the industrial sector, a negative but bidirectional effect was found. In a similar approach, Sattary et al. (2014) analyze the spillover effects of oil price volatility and the returns of several sectors of Istanbul’s stock exchange with a VECH-type bivariate GARCH model. In their study, the authors find that for the aggregate stock index, as well as for the electricity and transportation sectors, there is an indirect but statistically significant relationship between oil prices and returns that is reflected in the estimated conditional covariances.
One of the most detailed works about the complex relationship between oil prices and stock exchange activity is that of Degiannakis et al. (2017), in which the authors present an integrating summary of the discussion that has been recorded about this topic in the last decades. Among the most important points that the authors highlight is that causal effects between oil and equity markets depend largely on the type of information that is utilized for the investigation, for example if aggregate indices for stock markets, sectoral indices or firm-specific data are used, or if the data concerns net oil importing or exporting countries. These conclusions are consistent with the findings of Bouoiyour et al. (2017) and of Filis et al. (2011), also mentioned in this section.
The relationship of oil prices and stock returns in Mexico has also been studied in several papers, although with relatively low frequency compared with other international cases. For example, Coronado and Rojas (2014) analyze the interaction between Mexican oil-mix prices, equity market and foreign exchange rate by implementing a non-linear co-movement approach, supported by Brooks and Hinich’s cross bi-correlation test (Brooks and Hinich, 2001). The authors find statistically significant evidence of these relationships. Similarly, Bermudez et al. (2018) study the interactions between the same variables as well as the consumer price index, but with a Vector Autoregressive framework. Even though the results show evidence of a negative effect of the price of oil over the exchange rate, the effects of oil shocks over consumer price index and stock returns are not statistically significant.
Likewise, Valdés et al. (2012) estimate a BEKK-type asymmetric bivariate GARCH model to identify the volatility transmission mechanism of oil prices and stock returns of 30 firms listed in the Mexican Stock Exchange. Through the estimation of conditional correlations and their evolution, it is concluded that for most of the period analyzed, oil price shocks are associated positively with the equity market in Mexico, although this relationship varies in time and among firms. Furthermore, Singhal et al. (2019) investigate the dynamic interaction between oil and gold international prices, Mexican peso exchange rate and aggregate returns of the Mexican Stock Exchange by adopting an Autoregressive Distributed Lag model with daily data between January 2006 and April 2018. Their results indicate that gold prices positively affect equity returns in Mexico, while oil prices have an inverse relationship with capital markets, which is contrary to the findings of Valdés et al. (2012).
In this context, it can be observed that the results of previous investigations regarding the relationship between oil prices and stock returns, either at an international, regional or country specific level, are not consistent. This can be explained by heterogeneity regarding the econometric models used, idiosyncratic factors of selected economies, and the different frequency of the data and periods analyzed. The upcoming sections will describe the methodology and data used for this investigation, followed by a discussion of the results obtained and the most important conclusions of this paper.
3. Methodology
In line with several investigations that have addressed the relationship between oil price fluctuations and stock returns, this work utilizes bivariate Generalized Autoregressive Conditional Heteroskedasticity (GARCH) models to simultaneously estimate the behavior of conditional volatility of oil prices and returns of several selected sectors of the Mexican Stock Exchange. Stock return series very often present periods in which volatility may be concentrated, so GARCH models constitute a highly useful tool in financial time series analyses to tackle this issue (Brooks, 2014). A multivariate model was selected due to its advantage of being able to show how contemporaneous shocks on the analyzed variables may be correlated to each other (Enders, 2015). This possibility is one of the reasons why multivariate GARCH models are preferred to study the interaction between oil prices and stock markets rather than univariate models (Degiannakis et al. 2017). Furthermore, it has been documented that the multivariate modelling framework leads to more relevant empirical models than univariate models (see, for example, Bauwens et al. 2006).
To analyze the relationship between oil prices and the performance of selected industrial
sectors of the Mexican Stock Exchange, stock returns and oil price variations are calculated
for each asset
Econometric theory assumes that financial time series are adequately represented by
stochastic processes with martingale1 and
Markovianity2 properties (Boffelli and Urga, 2016). These processes are memoryless
and, in efficient markets, the ex-ante price of any asset in for period
where:
Regarding the last term, the estimation of the conditional variances of oil prices and selected sectors of the Mexican Stock Exchange was performed using a diagonal VECH model (Bollerslev et al. 1988), which restricts the parameters in such a way that there are no direct transmission effects of volatility from one series to another. Nevertheless, it does allow an indirect effect through the conditional covariance equations of the studied variables. The latter contributes to a more parsimonious model, thereby avoiding an over-parametrization by significantly reducing the number of parameters to be estimated (Wei, 2019), which represents an advantage with respect to BEKK models (Enders, 2015). Furthermore, VECH model assumptions make it possible to analyze conditional correlations without assuming that they are constant (such as the case of Conditional Constant Correlation (CCC) models), so that there are no constraints regarding the relationship between stock returns and oil prices being static in time.
The bivariate VECH model representation takes the following form (Enders, 2015):
Where:
Can be expressed as:
Thus, the diagonal VECH model utilizes only the diagonal elements of
Additionally, the conditional correlation can be calculated as:
Finally, in order to estimate all the parameters
is maximized, where
4. Data description
Daily data is employed for this analysis. The selected frequency makes it possible to obtain more robust estimations from the GARCH model in comparison with the results that could be found with lower-frequency data. The sample period includes data from January 3rd, 1996, up to November 12th, 2019, for a total of 5,990 observations. This period was selected because it includes various subperiods of global financial stress, such as the 2008 subprime mortgage crisis and the dot-com bubble of 2001. The selection of this period seeks to have a wide horizon of time with episodes of financial volatility and also to correspond with the new era of a more stable Mexican economy due to deep structural changes, such as the privatization of numerous state-owned enterprises and the consolidation of the Central Bank of Mexico’s autonomy.
The variables used to measure the sectoral returns of different economic activities of the Mexican Stock Exchange (MEXBOL) were the aggregate sector indices calculated by MSCI for Mexico, which seek to capture the performance of large- and medium-capitalization listed firms within the same economic activity. Specifically, the interactions between oil price volatility and the industrial, materials, financial and consumer discretionary sectors, and the aggregate index of MEXBOL were analyzed. Figure 1 presents a general disaggregation of each selected sector’s activity according to the Global Industry Classification Standards (GICS). It is worth mentioning that index returns are in US dollars, which serves to mitigate the effects derived from exchange-rate fluctuations. Oil prices are measured as the WTI spot price, whereas the MSCI World Index was used as the exogenous variable. The source of the data was Bloomberg.
Figure 1 Selected activities contained in the MSCI indices for the industrial, materials, financial and consumer discretionary sectors. According to the Global Industry Classification Standards (GICS)
| Industrials | Materials | |
|---|---|---|
| Capital goods | Chemicals | |
| Construction and engineering | Construction materials | |
| Machinery | Containers and packaging | |
| Commercial and professional services | Metals and mining | |
| Transportation | Paper and forest products | |
| Airlines | ||
| Financials | Consumer discretionary | |
| Banking | Automobiles and their components | |
| Diversified financials | Consumer durables and apparel | |
| Insurance | Consumer services | |
| Retailing |
Source: MSCI
Table 1 presents the main descriptive statistics for each series. It also includes several diagnostic tests that make it possible to infer statistically that 1) the return series reject the null hypothesis of following a normal distribution; 2) the hypothesis of the series containing a unitary root is rejected (which is a necessary condition in order to adhere to GARCH model assumptions); and 3) each series presents evidence of ARCH effects.
Table 1 Descriptive statistics of daily returns
| MEXBOL | Industrial | Materials | Financial | Consumer discretionary | WTI | MSCI World | |
|---|---|---|---|---|---|---|---|
| Mean | 0.027 | 0.025 | 0.003 | 0.043 | 0.018 | 0.018 | 0.019 |
| Median | 0.062 | 0.076 | 0.037 | 0.046 | 0.047 | 0.082 | 0.064 |
| Maximum | 15.159 | 24.501 | 19.808 | 21.459 | 16.895 | 21.277 | 9.096 |
| Minimum | -21.759 | -20.687 | -22.011 | -26.436 | -20.899 | -16.551 | -7.325 |
| Std. Deviation | 1.719 | 1.979 | 2.198 | 2.354 | 2.023 | 2.430 | 0.973 |
| Skewness | -0.272 | -0.021 | -0.064 | -0.270 | 0.048 | 0.004 | -0.398 |
| Kurtosis | 13.862 | 15.643 | 13.828 | 11.435 | 10.121 | 7.541 | 10.608 |
| Jarque-Bera | 29517.750 | 39895.910 | 29268.240 | 17828.920 | 12656.590 | 5146.749 | 14602.940 |
| (0.0000) | (0.0000) | (0.0000) | (0.0000) | (0.0000) | (0.0000) | (0.0000) | |
| Unitary Root ADF | -70.645 | -69.175 | -69.447 | -54.367 | -71.781 | -79.304 | -54.656 |
| (0.0001) | (0.0001) | (0.0001) | (0.0001) | (0.0001) | (0.0001) | (0.0000) | |
| ARCH* Effect | 511.973 | 396.547 | 489.903 | 195.541 | 293.714 | 127.960 | 253.791 |
| (0.0000) | (0.0000) | (0.0000) | (0.0000) | (0.0000) | (0.0000) | (0.0000) | |
| Observations | 5990 | 5990 | 5990 | 5990 | 5990 | 5990 | 5990 |
P-values in parenthesis. Returns in percentages. Sample period: 01/03/1996 to 11/12/2019.
*ARCH effect estimated with 1 lag in AR (1) models.
Source: Authors’ own estimations with EViews and data retrieved from Bloomberg.
Table 2 shows the daily returns’ correlation matrix of the assets included in the analysis. It can be observed that oil price returns have a larger correlation coefficient with the materials sector (0.22), followed by MEXBOL aggregate index (0.19) and the industrial sector (0.18), whereas consumer discretionary reports the lowest degree of linear association with crude prices (0.14). All the correlation coefficients turned out to be positive.
Table 2 Correlation matrix for daily returns From January 3rd, 1996, to November 12th, 2019
| MEXBOL | Industrial | Materials | Financial | Consumer discretionary | WTI | |
|---|---|---|---|---|---|---|
| Industrial | 0.8333 | |||||
| Materials | 0.8545 | 0.7258 | ||||
| Financial | 0.7999 | 0.6915 | 0.6715 | |||
| Consumer discretionary | 0.8509 | 0.7115 | 0.6945 | 0.6677 | ||
| WTI | 0.1917 | 0.1806 | 0.2244 | 0.1573 | 0.1434 | |
| MSCI Global | 0.6746 | 0.5773 | 0.6680 | 0.5308 | 0.5929 | 0.2382 |
Source: Authors’ own estimations with EViews and data retrieved from Bloomberg
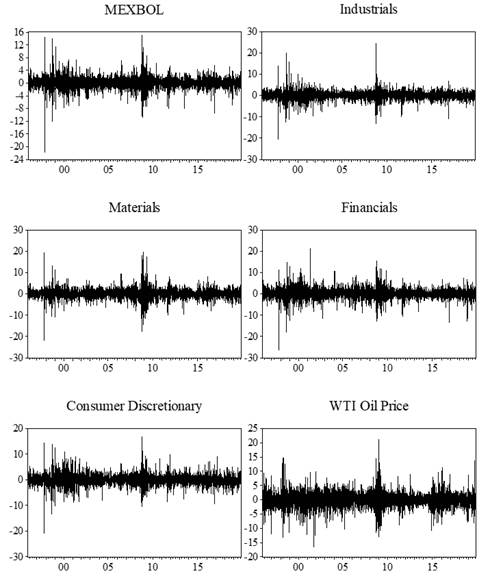
Figure 2 shows the daily returns for each series, in which volatility clusters can be observed, especially between 2009 and 2010 during the global financial crisis.
5. Discussion of results
The estimation results for the bivariate GARCH models’ parameters for each series are presented in Table 3. Given that neither the analyzed asset returns, nor the errors of the conditional mean equations followed a normal distribution3, Bollerslev-Wooldridge (or QML) standard errors were calculated in order to address this issue and obtain reliable estimators4.
In general, almost every parameter estimation was statistically significant with p values
lower than 5% and with the expected signs. The conditional variance parameters that measure
the GARCH effect,
The conditional covariance parameter estimations (i.e.
Table 3 Bivariate GARCH (1,1) model results between selected sector stock returns of the Mexican Stock Exchange and WTI oil prices
| Conditional Mean Equation | |||||
|---|---|---|---|---|---|
| Variable | MEXBOL-WTI | Industrials-WTI | Materials-WTI | Financials-WTI | Consumer-WTI |
| μ10 | 0.097764 | 0.124256 | 0.091911 | 0.110624 | 0.094917 |
| (0.0000)*** | (0.0000)*** | (0.0000)*** | (0.0000)*** | (0.0000)*** | |
| μ20 | 0.055767 | 0.059385 | 0.053867 | 0.062656 | 0.059870 |
| (0.0330)** | (0.0240)** | (0.0380)** | (0.0184)** | (0.0238)** | |
| Conditional Variance and Covariance Equations | |||||
| Variable | MEXBOL-WTI | Industrials-WTI | Materials-WTI | Financials-WTI | Consumer-WTI |
| c11 | 0.064797 | 0.103058 | 0.097941 | 0.128571 | 0.085167 |
| (0.0000)*** | (0.0000)*** | (0.0000)*** | (0.0000)*** | (0.0000)*** | |
| α11 | 0.080443 | 0.082768 | 0.072682 | 0.09241 | 0.046917 |
| (0.0000)*** | (0.0000)*** | (0.0000)*** | (0.0000)*** | (0.0000)*** | |
| β11 | 0.897073 | 0.888348 | 0.904075 | 0.887188 | 0.931075 |
| (0.0000)*** | (0.0000)*** | (0.0000)*** | (0.0000)*** | (0.0000)*** | |
| γ11 | -0.149788 | -0.203407 | -0.218613 | -0.235782 | -0.239907 |
| (0.0054)*** | (0.0021)*** | (0.0001)*** | (0.0040)*** | (0.0008)*** | |
| c31 | 0.059742 | 0.071475 | 0.062223 | 0.067566 | 0.064683 |
| (0.0000)*** | (0.0000)*** | (0.0000)*** | (0.0000)*** | (0.0000)*** | |
| α22 | 0.058234 | 0.060571 | 0.058767 | 0.059834 | 0.057391 |
| (0.0000)*** | (0.0000)*** | (0.0000)*** | (0.0000)*** | (0.0000)*** | |
| β22 | 0.933409 | 0.928643 | 0.932083 | 0.930484 | 0.933161 |
| (0.0000)*** | (0.0000)*** | (0.0000)*** | (0.0000)*** | (0.0000)*** | |
| γ31 | -0.139846 | -0.141149 | -0.140268 | -0.162283 | -0.154835 |
| (0.0024)*** | (0.0041)*** | (0.0020)*** | (0.0008)*** | (0.0012)*** | |
| c21 | 0.009246 | 0.007441 | 0.012881 | 0.013554 | 0.008360 |
| (0.0001)*** | (0.0003)*** | (0.0000)*** | (0.0004)*** | (0.0036)*** | |
| α12 | 0.025668 | 0.016116 | 0.027984 | 0.020198 | 0.023350 |
| (0.0000)** | (0.0000)*** | (0.0000)*** | (0.0000)*** | (0.0000)*** | |
| β12 | 0.96204 | 0.972010 | 0.958652 | 0.962799 | 0.961032 |
| (0.0000)*** | (0.0000)*** | (0.0000)*** | (0.0000)*** | (0.0000)*** | |
| γ21 | -0.036133 | -0.040094 | -0.054055 | -0.055218 | -0.038226 |
| (0.0837)* | (0.0564)* | (0.0121)** | (0.0212)** | (0.0892)* | |
| Log L | -23857.16 | -24756.18 | -25151.11 | -25960.14 | -25170.44 |
| AIC | 7.970338 | 8.270511 | 8.402373 | 8.672502 | 8.408828 |
| SIC | 7.985993 | 8.286165 | 8.418027 | 8.688156 | 8.424482 |
Standard errors estimated with Bollerslev-Wooldridge (QML) robust method. P-values in parenthesis. Asterisks indicate statistical significance with p<1%***, p<5%** y p<10%*. Coefficient matrices were estimated under the assumption of being undefined.
Source: Authors’ own estimations with EViews and data retrieved from Bloomberg.
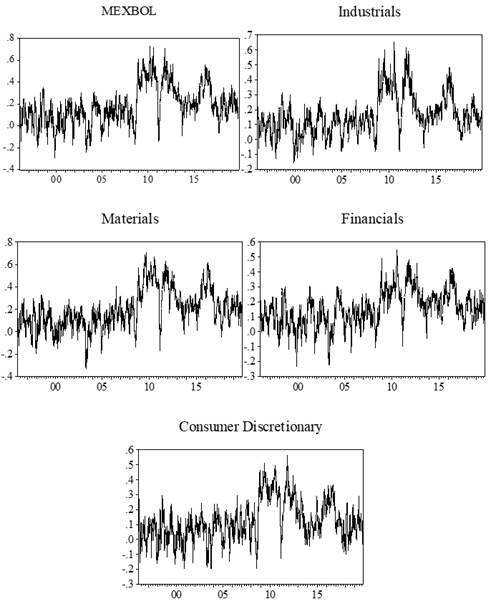
Conditional correlations between oil price fluctuations and the selected sectoral stock returns analyzed in this work are presented in Figure 3.
Source: Authors’ own estimations with EViews and data retrieved from Bloomberg.
Figure 3 Conditional correlation graphs between selected sectors of the Mexican Stock Exchange and WTI oil price, from January 3rd, 1996, to November 12th, 2019.
It must be noted that the estimated conditional correlations show a heterogeneous behavior among the distinct sectoral stock indices, but also within the same sector. Therefore conditional correlation is not constant in time and there are several periods that can be identified where the relationship between oil price fluctuations and stock returns becomes negative, but tends to turn positive and increase in episodes of financial stress, such as the Great Recession (Filis et al. 2011). Nevertheless, in most of the analyzed period, conditional correlations are positive, a result that is consistent with the findings of Valdés et al. (2012) and Degiannakis et al. (2014).
6. Conclusions
This paper analyzed the conditional variances of oil prices and diverse sectoral stock returns of the Mexican Stock Exchange, as well as the contemporaneous relationship between them, with a conditional covariance and correlation approach. Specifically, the interactions between oil prices and returns of the industrial, materials, financial, and consumer discretionary sectors were studied. The materials sector was identified as the one that showed a more intense relationship with crude prices, followed by the aggregate index of MEXBOL.
By studying the evolution of conditional correlations, it was found that, during most of the analyzed period, the relationship between oil and the selected sectoral stock returns of MEXBOL was positive and tended to intensify in financial stress episodes. In this regard, these results provide more support to the current that suggests that a price increase in oil due to demand-side shocks is accompanied by an increase in economic activity (and vice versa), which has a spillover effect on stock market performance. In this sense, the evidence reported in this work could be very useful in the processes of investment strategy planning and portfolio hedge formulation conducted by portfolio managers and other financial agents with exposures to oil and equity markets in Mexico. For instance, in periods of financial turmoil, investors with high exposure to materials related firms in Mexico could hedge their portfolio with short oil derivatives positions in order to mitigate risk. Likewise, constant monitoring of oil prices behavior could serve as an entry or exit signal of the different sectors analyzed in this work.

