


 nueva página del texto (beta)
 Inglés (pdf)
 Artículo en XML
 Referencias del artículo
 Enviar artículo por email
 Citado por SciELO
  Similares en
SciELO
Similares en
SciELO 
 Permalink
1. Introduction
Big Data analytics (BDA) is already among us, the high volume, velocity, variety, veracity and value of information that flows from different sources to the company every day represents a big challenge: how to store, to process and to profit from this huge amount of information? (Wamba et al. 2015). About storing high volume and variety of data there is a considerable story that starts with the enterprise data warehouse (EDW) for structured data and the efficient database Hadoop for the non-structured one. About processing data that comes at a high speed (velocity) several tools have come into play in the domain of Business Intelligence and Machine Learning. Concerning data veracity several systems are arising to secure data quality and governance. However, data value has remained at functional areas and specific tasks, so we are still lacking proposals to integrate Big Data activities with strategic management in such a way that we can improve the company financial performance as a whole.
BDA is a term that describes the reception, processing and managing of huge amounts of structured and unstructured information that the company receives every day through different means such as the Online Transaction Processing (OLTP) that collects the company’s transactions, the social media data, the xml data, data stored in the cloud and even real time data. According to Rezaee and Wang (2017) the BD industry of technology and services is forecasted to growth at an annual rate of 26.4% involving a total value of 41.5 billion dollars, which is about six times the growth rate of the overall information technology market. Besides, the volume of information collected every day is becoming huge, for instance Walmart collects more than 2 petabytes of data every day from its customer transactions (Rezaee and Wang, 2017).
BDA has been applied to different company domains such as supply chain management (SCM), marketing management (MM), and accounting and financial management (AFM). Nguyen et al. (2018) conducted a throughout literature review of the applications of BD into supply chain management (SCM) and found four different areas of applications: procurement, manufacturing, logistic/transportation and warehousing. In the field of MM Cao et al. (2019) studied 221 companies in the UK and found that there is a positive impact of marketing analytics into marketing decision-making and product development management. Finally, Gepp et al. (2018) analyzed the use of BDA in accounting and finance, and found that applications were narrowed to financial distress modelling, financial fraud modelling, stock market prediction and quantitative modelling, while auditing was lagging behind other research areas.
Raguseo (2018) conducted an empirical survey upon 200 French companies and found that companies that BDA enhance productivity growth because it reduces the operating costs, BDA enables the company to offer better products and services, BDA expands the company capabilities to collect and process information in a short-time frame and BDA enhances data accuracy and accessibility. As we can see, all the perceived BDA benefits are related to efficiency, product/service development and data management.
Many other authors have studied the managerial implications of the adoption of BDA into the companies. Merendino et al. (2018) conducted several in-depth interviews with directors of UK-based companies and concluded that there was a shortfall in cognitive capabilities related to BDA, and that the directors’ decision making will be improved by sharing the knowledge within their teams. Other authors have pointed out towards the mediating role of data quality (veracity) in the whole process of data collection, processing, analyzing and decision-making (Ghasemaghaei and Calic, 2019 and Janssen et al., 2017).
Given the amount, speed and variety of the data, how will companies obtain performance gains upon their analysis? Gunther et al. (2017) conducted a throughout literature review on Big Data and value realization and proposed an integral model that may be used to improve company performance. This model is based upon three factors: working with Big Data in practice, developing organizational models, and dealing with stakeholders’ interests. The first factor includes working with inductive and deductive approaches and with algorithmic and human-based intelligence (i.e. data mining); the second factor deals with how Big Data activities are integrated and promoted within the organization; and the third factor relates to governance, privacy and restrictions related to the data.
Mikalef et al. (2019) conducted a survey among 175 chief information officers and IT managers working in Greek companies and found that the way in which strategies related to Big Data are developed and executed depend upon the company size, industry, organizational structure and management support. Furthermore, they found that ethical issues related to Big Data are becoming more important.
Sivarajah et al. (2017) asserted that although aligning people, technology and organizational resources to become a data-driven company is complicated, it is possible to enhance the strategic decision making process by dividing the analytical methods in five analytics: descriptive, inquisitive, predictive, prescriptive, and pre-emptive. We use descriptive analytics to find patterns in the data or to conduct standard reports, while the use of inquisitive analytics is devoted to test for business propositions. The use of predictive analytics is directed towards forecasting data and/or determine future possibilities, while prescriptive analytics help us find the best course of action through sensitivity, simulation and/or optimization processes. Pre-emptive analytics can help us take precautionary actions so we can be prepared to any possible future.
It also seems that the ability of the company to quick improve, adapt and change processes is of upmost importance to better compete in the market (Wamba et al., 2017). This concept, coined as “process-oriented dynamic capabilities”, may range from continuous improvements towards a radical change in a process. This ability is critical in order to extract the highest benefit from Big Data activities (Kim et al., 2011). According to Kim et al. (2011) process-oriented dynamic capabilities (PODC) is the firm’s ability to improve, adapt, adjust, disrupt and so forth in order to gain, sustain or reconfigure a competitive advantage. In other words, we may think about PODC as the company’s ability to innovate with flexibility to gain, keep or reconfigure a competitive advantage. This process is the key to understand how a Company may go from explore data (Big Data) to exploit it (financial performance).
Given the previous situation, the benefits of BDA have been attached to specific tasks within certain functional areas and it is not possible to profit from BDA without an ongoing process-oriented dynamic capabilities in the company, a top-management commitment with this process and without considering the stakeholders interest. In this research, we propose an integral framework to establish a link between Big Data analytics and firm’s financial performance provided that there is a PODC and a proper leadership for the company that also takes into account the stakeholders interests in the designing of contingent strategies.
We contribute to the current literature by designing a methodology that involves consists of five (5) stages: financial modeling, prospective analysis, risk analysis that includes BDA, strategic analysis and monitoring. Furthermore, the proposed methodology is comprehensive since it allows the inclusion of various areas of the company in order to improve its financial performance represented by the KPIs and the analysis can be performed for specific areas, business units and for the whole company.
In the next section we conduct a literature review on the impact of BDA into the performance of certain tasks, and usually within the domain of functional areas. In the third section we introduce our framework for improving the company financial performance and in the fourth section we conclude
2. Literature review
In what follows we review the current literature from three perspectives: the empirical impact of BDA activities into firm’s performance, alternative proposed frameworks that relate DBA activities with firm’s performance and factors that may influence or moderate the impact of DBA activities into firm’s performance.
There have been several studies concerning the empirical impact of BDA into the performance of certain specific tasks, functional areas or even the company. However, usually there is no underlying framework, but just an empirical causality. Corte-Real et al. (2019a) stressed the value of DBA for keeping the company competitive advantage. They conducted a survey among 618 European and American companies and found that better data quality is important for a company to profit from DBA activities. Also, Caputo et al. (2019) conducted a two partial least squares analysis using 50 companies that used BDA and found that companies investing more in innovation and technology and who have more technological-specialized human resources have higher return on invested capital (ROIC).
Companies do not only require technological-specialized human resources and better data quality to profit from DBA, they also require scanning their stakeholders in the environment in order to foster innovation. Cao et al. (2019) conducted a survey among 218 UK businesses and found that BDA improves the company’s ability to scan its environment and foster innovation.
Dong and Yang (2019) used the results of a large-scale survey on information and technology usage enterprise applied to 18816 firms in Italy and found that the use of social media diversity and big data analytics increases the market performance of companies measured as companies’ total sales in the marketplace. They obtained this result by using a regression model.
Aydiner et al. (2019) using a survey questionnaire upon 235 companies in Turkey found that BDA promotes a better business process performance and this in turns leads to a better company performance measured by the company total sales in the marketplace. The business process performance was assessed using the answers linked to improvement in the business process such as “our firm is successful in gaining economies of scale”, and so forth.
In another study, Corte-Real et al. (2019b) conducted a survey among 175 European firms and confirm that BDA use, the strategic alignment between the business and information technology, and the presence of dynamic capabilities are key drivers for the company to keep its competitive advantage.
Interestingly enough, the combination of factors that may lead from BDA to a better firm performance can configure in different ways. Mikalef et al. (2019), using results of a survey to 175 Greek firms, provided evidence of four different configurations of data, process, technology, organization, people and context from which BDA may lead to a better firm performance. Hence, it is relevant to study different frameworks to organize DBA activities to lead companies to better performance.
Acito and Khatri (2014) provided a general framework for the contribution between BDA activities into the firm’s performance, this framework is based upon six factors: data, tasks, capabilities, business performance management, strategy and desirable behavior. Unfortunately no further connection between inputs and outputs was provided.
Elgendy and Elragal (2016) provided a framework called Big Data Analytics and Decisions (B-DAD) based upon four stages: intelligence, design, choice and implementation, however they didn’t provide a connection between inputs and outputs instead they provided a list of possible tools that can be used in each stage.
Shi and Wang (2018) tried to establish a connection between BDA activities and Enterprise Resource Planning (ERP). Their framework called “strategic alignment, intellectual and social capital integration, and technology integration” (SIST) is built upon three layers: the connection between BDA activities and ERP (strategic alignment), the integration of structure, process and people, and the technology integration. It is interesting that they provide a connection between BDA activities and the design of contingent strategies, but they do not provide a connection between inputs and outputs between different layers.
Bilal et al. (2019) designed a framework consisting of five BDA layers for the analysis of the profit margin of 1048 investment projects: Big Data sources, storage, analytics, applications and support. The analysis through these five layers help them to find out the wide rate of variation of profit margins between projects in different locations and across different attributes (-98
Elia et al. (2020) conducted a literature survey with 49 papers to find out Big Data value directions that are the ones in which BDA activities con contribute to improve firm’s performance. These directions were them grouped in five value dimensions: Informational value (access to information), transactional value (returns and costs), transformational value (organization capabilities, structure and process), strategic value (competitive advantage, innovation and flexibility) and infrastructural value (information technology improvement). Authors concluded that the way in which companies combine these five dimensions in the implementation of DBA activities is critical to improve firm’s performance.
What are the factors that moderate the influence of DBA activities into the firm’s performance? In other words, we may wonder whether companies must have special a set of characteristics to implement successfully DBA activities that lead to an improvement in firm’s performance. In this respect, Dubey et al. (2019) studied 256 manufacturing companies in India and found that entrepreneurial orientation is strongly associated with higher order capabilities related to DBA such as Artificial Intelligence and with operational performance.
Recently, Maroufkhani et al. (2020) studied 171 Iranian small and medium manufacturing firms and found that DBA technology adoption was influenced by complexity, uncertainty and insecurity, trialability (promising to be tried), observability, top management support, organizational readiness, and external support. Hence, all these factors can be present in companies of different sizes.
In brief alternative frameworks are usually general ones providing general tasks within the phases, value dimensions where to invest and partial links that do not derive into the company financial performance.
3. An integral framework for improving the company financial performance
Before presenting our proposed framework it is better to show the BDA process because it will be included into it. Figure 1 portraits a graphical conceptualization of the Big Data analytical process. As we can see, besides the three main sources of data for the company we have the storage databases: data warehouse (EDW) and Hadoop and Hive.
The data warehouse is usually an Enterprise Resource Planning (ERP) that stores, extracts, transforms and loads structured data coming from OLTP system for data analysis and reporting. As such, it is a core part of the Business Intelligence (BI) system. The data can be stored in subsets called “data marts” according the strategically areas of the company (marketing, accounting, finance, and so on) in order to generate executive reports that can help to make management decisions.
A Hadoop is an open source software developed as open-source by Yahoo in 2008 and currently managed by the non-profit Apache Software Foundation (ASF). This software is useful for storing and running applications on clusters of non-structured data, it could handle an infinite number of simultaneous jobs specified by the users.
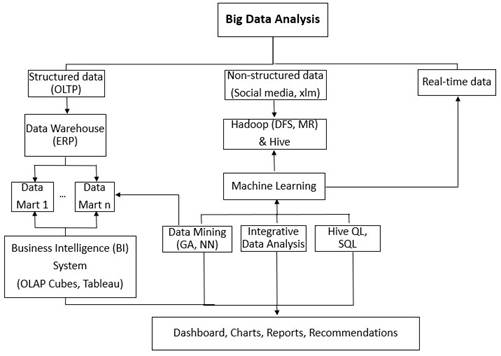
The Hadoop has two core components: The Hadoop Distributed File System (HDFS) and the MapReduce (MR). The HDFS captures data, splits the information into blocks and distributes the jobs among several nodes, so these jobs can be done simultaneously. MapReduce is a programming language that allows the solution of algorithms that can be solved in a parallel way in the presence of huge amount of information (petabytes).
Processing of structured data can be done with specific tools such as Online Analytical Processing (OLAP) Cubes, Tableau, and many others. OLAP Cubes is a computer based method that works with multidimensional array of data with the aim of finding useful patterns and Tableau is an interactive visualization tool that can help us discover relationships between variables and it also works with real-time data.
We can also use Data Mining methods in order to process structured data and unstructured data. Data Mining is a set of methods aimed to find patterns, rules and trends in a certain set of data. In the case of structured data some of the most well-known techniques are parametric and non-parametric statistical methods and optimization algorithms.
In order to process non-structured data we can also use Data Mining methods, but in a Machine Learning framework. Machine Learning is a sub-area of artificial intelligence that aims to find patterns by using algorithms such as Genetic Algorithms (GA) and Neural Networks (NN) that replicate the way human beings learn by trial and error. GA are excellent for searching in a complex database and find optimal solutions through a process inspired in selection, mutation and recombination from natural biology. A NN tries to find patterns in huge amounts of data using different layers replicating the human brain. In other words, we train the algorithm with a subset of the data and then we adjust the predictions with the remaining part of the data. Besides we can also use Hive SQ programing and integrative data analysis techniques in order to find patterns in the data with SQL well known commands and with a mixture of data such as videos, blogs, and so forth.
The final result of the analysis is usually a dashboard, series of charts, executive reports or even recommendations of what to do depending on the findings. However, rarely these findings are related to the company main strategies neither to financial key performance indicators (KPIs), but rather to on-net and off-net input and output KPIs. Hence, there is a need to establish a direct link between Big Data analysis with the company strategies and its financial KPIs.
Figure 2 shows the process that we propose to link the activity of BDA with the company financial performance. This process is an extension of the process proposed by Mongrut and Juarez (2018). Let’s suppose that we aim to increase the company financial KPI indicator called Return on Invested Capital (ROIC) using Big Data analysis, so where we should start? We must start in the certainty phase by building a Financial Model (FM) that summarizes the company different areas’ strategies and ends up in the ROIC.
In the prospective phase we design three to four mutually exclusive and jointly exhaustive scenarios using Key-Driven Forces (KDF) that are exogenous external forces in the company environment whose occurrence is highly uncertain and have a strong impact into de company operations, so the company is entirely subject to them. This prospective analysis will help managers to better prepare the company against the possible futures that may arise (to anticipate them and become flexible).
The Financial Model (FM) may have dozens of input variables, but usually only two output variables (the company’s financial KPIs, e.g. ROIC and Free Cash Flow). Our goal is to identify which input variables have higher impact in the output financial variables (KPIs) using a what-if analysis or sensitivity analysis.

Source: Own elaboration
Figure 2 Proposed methodology for linking BDA with the company financial performance
In the risk analysis phase, we identify the company Critical Variables (CV) where a critical variable (CV) could be any input variable of the Financial Model (FM) that leads a more than proportional change in the output variable (i.e. the ROIC or FCF). For instance, if we change in ± 10% each input variable in the Financial Model (FM), then a Critical Variable (CV) is the one that caused a change in the company ROIC or FCF in more than 10%.
In the risk analysis phase we also use Big Data analysis with structured and non-structured data in order to discover past patterns in the behavior of critical variables (CV) and relationships between them (i.e. data mining). We can characterize each Critical Variable (CV) with a probability distribution and also assign correlation coefficients between them. The previous characterization of Critical Variables (CV) help us calibrate the distributions’ parameters and correlations according to the scenarios we have designed. Then, we can simulate the ROIC and the FCF, estimate the expected ROIC and FCF and the company total risk (i.e. the standard deviation of the simulated ROIC) and value (i.e. the present value of expected FCF) for the next period of interest (i.e. month, quarter or year) in every scenario.
In the strategic phase we design contingent strategies depending on the scenario and assess their impact into the company ROIC and FCF (i.e. financial KPIs) by simulating each scenario again. The contingent strategies ought to be related to the company’s critical variables (CV) and the Key-Driven Forces (KDF) that were used to design the scenarios.
In the final phase we monitor the evolution of the company’s critical variables (CV), reassess new critical variables that may emerge due to unexpected relationships found in the Big Data analysis and recommend the change of a certain strategy if this is the case. This process must be repeated for the selected time period (i.e. month, quarter or year).
As we can see, this methodology allows the inclusion of marketing, logistics, human resources and other strategically area into the Financial Model (FM), so the analysis can be performed for areas, business units, or even at company level. This is particularly important because an area’s critical variable (CV) will not be necessarily the company’s critical variable (CV), but can affect the area’s KPI that in turn could be the company’s critical variable (CV).
This methodology allows to direct Big Data analysis towards characterizing value-driven variables for the company, to design contingent strategies and to assess their impact into the company’s financial KPIs in a multidimensional framework (scenario design). However, Big Data analysis also offers a series of unexpected relations between variables that arise from the huge amount of data and that represent new consumer preference, pattern or relationship. The most relevant discovered new patterns can be derived into the Design Thinking department of the company where they are in charge of making a thoughtful research of the consumer needs in order to create innovative solutions.
4. Conclusion
Our main contribution is proposing a framework that clearly establishes a link between BDA and the company’s financial performance. BDA is in the core of the analysis because this framework requires that managers have already modeled the company’s financial performance (FM), identified the company CV and identified and designed prospective scenarios with the KDF. In his way, the five different roles of BDA within the five value dimensions can be performed: descriptive (i.e. standard reports), inquisitive (i.e. about the behavior of CV), predictive (i.e. characterizing CV), prescriptive (i.e. to find the best course of action through risk analysis), and pre-emptive (i.e. to be prepared and to anticipate the future using scenarios and contingent strategies). Furthermore, there is a clear cut contribution of the specific task and/or functional area improvement into the company’s financial performance because the Financial Model helps us to do so.
This framework is also flexible and it allows us for innovation because new discoveries, patterns and relationships could be directed towards product development (i.e. design thinking) and the constant monitoring of the model may allow different forms of innovation such as to adapt or reconfigure to the new external conditions. Stakeholders’ interest could also be involved in the prospective phase and in the contingent strategic phase contributing to the dynamic capability of the company.
Finally, it is clear that we have laid out all the phases and their connections, but the particular tools to be involved can change depending on the resource capabilities of the company. There is no unique way to create value through BDA, but the highway is at place and the company may choose which car to drive.

