


 nueva página del texto (beta)
 Inglés (pdf)
 Artículo en XML
 Referencias del artículo
 Enviar artículo por email
 Citado por SciELO
  Similares en
SciELO
Similares en
SciELO 
 Permalink
1. Introduction
The renewable energies originating from inexhaustible natural sources meets two desirable requirements, respect for the environment and being fundamentally inexhaustible to obtain. That is why, development plans supported by international agencies promote de-carbonization as a key element to achieve the sustainable development goals, especially the ODS 7: Affordable, non-polluting energy and the Kyoto protocol to reduce the world´s greenhouse gases.
While renewables are superior in sustainability, have failed to win the battle of eco-efficiency over fossil energy, this is why it is decided by the ratio between the added value of what has occurred and the added environmental impact that has cost to produced it. This leads to the false dichotomy between conventional and renewable energy, because to date they have been rather complementary, energies, rather than alternatives. However, our research shows a development between 2018 and 2040 of up to 36% of higher consumption of renewable energy, reflecting that, although they accounted for only 19% of the world´s total energy by 2040, it is the most steadily developed and with significant investments from almost everyone.
This research works with energy consumption in the North American region and attempts to visualize and simulate its energy matrix using four-sided pyramids, where the base polygon is made up of four non-renewable consumption information contained in BP Statistical Review of World Energy (2019), identified how the relative consumption of each type of energy interacts, renewable and non-renewable, over a given period in North America.
2. Renewable energy reference framework
At the moment it can be said that one of the fundamental factors to consider is the ecological aspect, seeking the use of renewable energies Doych and Nayaran (2016), Omri and Nguyen (2014), Salim Hassan and Safiei (2014), Salim and Rafiq (2012), Twildell and Weir (2015), especially the fact that global problems with the use of fossil fuels, such as global warming by the increase in greenhouse gas emissions, rising temperatures, atypical storms, tornadoes, and other natural climate-related disasters (Freedman and Jaggi 2005, and Akram, Jangam and Rath 2020).
The first thing to consider is what to understand as renewable energy: “To consider renewable energy the resource must be sustainable, it must be inexhaustible and not harm the environment, and the services including the climate system, in the process. For example the biofuel production would be sustainable, because it does not increase the emission of carbon dioxide, it may not affect food safety, does not require excessive use of water and chemicals.
It will be sustainable, energy will also be economically affordable in the long rv; it also satisfies a social need and is compatible with social norms now and in the future. Indeed, a use of renewable energy is accelerated, a balance will have to maintained between the various dimensions of sustainability and development. “Its is very important to evaluate the entire life cycle of each energy cycle source, to be sure that all sustainability dimensions are met”. (Twildell and Weir, 2015, 6 citations to IPCC 2011).
It is important to consider that obtaining the energy needed for almost all human activities can be obtained from three fundamental sources, that are (Twildell and Weir, 2015):
In addition, it is established that there are five primary sources of energy that are (Twildell and Weir, 2015 and Herez ett to 2017):
The sun.
The gravitational movement and potencial of the sun, moon,and earth.
Geothermal energy, chemical reactions, and natural radioactivity.
Nuclrar Reactions.
Chemical reactions of mineral resources.
It should be noted that renewable energies derive mainly from the resources considered in fractions I, 11 and III above, pointing out that biomass and ocean warming are considered energies derived from solar energy.
Some aspects that differentiate renewable energy from conventional energies, where surely the most important thing is the utilization limit, since the first ones are infinite and the second ones are finite, along with the cost at which the former are free and the latter are becoming more expensive, although in the former the scale is smaller and the second is on a large scale, as can be seen, the differences between renewable and conventional energies are serious, but their contribution is indispensable for modern times.
If the question were raised about, what has caused this increase in the development of renewable energy in relation to conventional energies? One answer is that it has been derived fundamentally from global warming and greenhouse gas emissions, which led to an international agreement called the Kyoto Protocol that seeks to reduce this type of emissions, as indicated by Freedman and Jaggi (2005), this document It has been ratified by 84 countries, including the European Union, the United States of America, Russia, Japan and Canada.
One of the most important agreements of the countries signatory to the Kyoto Protocol is the reduction of 5% of greenhouse gases by 2012, from the level they had in 1990 (Rekvin 2001), this has had a significant impact as this has meant that the use of renewable energy has had to be expanded in order to achieve these objectives.
One of the areas that has suffered the greatest impact from the application of this obligation is the electricity sector (which is the largest producer of CO2), which is why the use of cleaner energy should be increased.
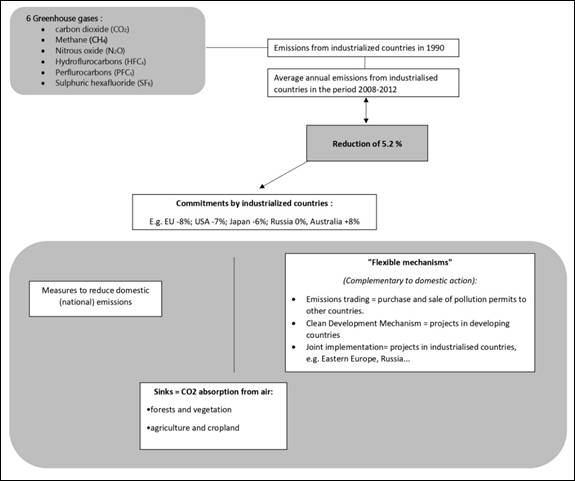
Source: own elaboration fetching information from Ceida (2020, p. 4)
Image 1 Basic elements of the Kyoto protocol
From the above picture is to emphasize that the six greenhouse gases (carbon dioxide, methane, nitrous oxide, hydrofluorocarbons, perfluorocarbon, and sulphuric hexafluoride), alongside different mechanisms for reducing domestic emissions, and flexible mechanisms for mitigating pollution, which undoubtedly leads countries to seek to be more intensive in the use of renewable energy. After talking about the importance of renewable energy, it is possible to talk about the development that this important sector is expected to have in time, for this must take into account the World Oil Outlook (2019), in which the Organization of Petroleum Exporting Countries (OPEC), make an estimate of energy demand based on 2018, but estimating demand by 2020, 2030 and 2040, for various conventional energy sources such as oil, coal, natural gas, and nuclear energy, and on the renewable energy side where you have hydropower, biomass and other renewable energies, which are presented in the following table:
Table 1 Primary energy demand by fuel type, 2018-2040
| Levels | Growth | Growth | Share of global energy demand | |||||||
|---|---|---|---|---|---|---|---|---|---|---|
| mboed/d | mboe/d | % p.a. | % | |||||||
| 2018 | 2020 | 2030 | 2040 | 2018-2040 | 2018-2040 | 2018 | 2020 | 2030 | 2040 | |
| Oil | 90.1 | 92.1 | 98.6 | 100.7 | 10.7 | 0.50 | 31.5 | 31.3 | 30.0 | 28.2 |
| Coal | 75.9 | 76.2 | 77.3 | 76.8 | 0.9 | 0.10 | 26.6 | 26.0 | 23.5 | 21.5 |
| Gas | 65.5 | 67.4 | 79.7 | 90.3 | 24.7 | 1.50 | 22.9 | 23.0 | 24.2 | 25.2 |
| Nuclear | 14.3 | 15.1 | 18.5 | 21.8 | 7.5 | 1.90 | 5.0 | 5.2 | 5.6 | 6.1 |
| Hydro | 7.3 | 7.5 | 8.9 | 10.2 | 3.0 | 1.60 | 2.5 | 2.5 | 2.7 | 2.9 |
| Biomass | 27.4 | 28.3 | 31.7 | 34.5 | 7.0 | 1.00 | 9.6 | 9.7 | 9.7 | 9.6 |
| Other renewables | 5.3 | 6.7 | 14.1 | 23.2 | 17.9 | 6.90 | 1.9 | 2.3 | 4.3 | 6.5 |
| Total | 285.8 | 293.3 | 328.8 | 357.5 | 71.7 | 1.0 | 100.0 | 100.0 | 100.0 | 100.0 |
Source: Wold Oil Outlook (2019, p. 44)
From the above table it is emphasized that the estimates to the decrease in the demand for oil, would go from 31.5% in 2018 to 28.2% in 2040 with a drop -3.3% global and coal that would go from 26.6% in 2018 to 21.5% in 2040 with a drop -5.1% overall, on the other hand if it is considered as a single concept of renewable energy to hydroelectric, biomass and other renewable energies, it is to be appreciated that in all periods they show an increase to pass in 2018 of 14%, in 2020 to 14.6%, in 2030 to 16.7% and in 2040 to 19%, which reflects an overall growth in this concept of 5%, but in percentage terms a growth close to 36% by 2040, with all types of energy being the most developed.
3. Literature review on the topic of renewable energy
The issue of renewable energy is one of the topics that has had a lot of research at international level, we can even find journals of the Journal Citation Report (JCR), specialized in the topic as "Renewable Energy". However, the present investigation, using financial economic information, using polyhedron geometry, turns out to be very novel to visualize the importance of renewable energies in North America, Bhattacharya et al. (2016, 1), “analyzes the effects of renewable energy consumption on economic growth in the 38 major renewable energy consuming countries between 1991-2012, in the world, using Ernest & Young’s Attractive Country Index for Renewable Energy, confirmed evidence of long-term dynamics between economic growth and traditional energy inputs, suggests growth in investment in renewable energy, for low carbon growth”.
Huang et al. (2020, 1) “investigates the development of renewable energy and its impact on China’s rural economy, through a panel analysis of data over the period 2003-2017, the results of the study show that investment in renewable energy, show an improvement in China’s rural economy”.
Shahnazi and Shabani (2020, 1), “researches renewable energy for the countries of the European Union in the period 1995-2016, using a panel data model, with a variable for the spatial spread of renewable energy production. The results revealed that an increase in the average production of renewable energy from neighboring countries managed to increase renewable energy in a given country, in addition it is suggested that the increase in costs and prices of research and development (R&D)natural gas, oil, and coal, the volatility of the price of gas and coal and of environmental taxes have a positive effect on the production of renewable energy”.
Sharif et al. (2020, 1) “investigate the impact of renewable and non-renewable energy consumption on Turkey’s ecological footprint, using the approach of Quantile Autoregresive Langged (QARDL) for the period 1965 (first quarter, Q1) to 2017 (last quarter, Q4). The results confirm a significant reversal to the long-term equilibrium connection between the related variables and the ecological footprint in Turkey, However, the results of economic growth and non-renewable energy have a positive impact on the short-term ecological footprint in all quartiles”.
Uzar (2020, 1) “analyses the connection between renewable energy and institutional quality in 38 countries during the period 1990-2015. Economic growth and carbon dioxide emissions are included in the model as control variables. The results show that institutional quality positively affects the consumption of renewable energy in the long term, and CO2 emissions are a positive determinant, while economic growth negatively affects the consumption of renewable energy. It concludes that institutional quality is key to solving environmental problems”.
Ike et al. (2020, 1) “analyse the impact of renewable energy consumption, energy prices and trade on emissions in the G-7 countries. The results show that renewable energy and energy prices exert a negative pressure on CO2 emissions, while commercial volume exerts a strong positive pressure on CO2 emissions. The impact of renewable energy consumption and trade is uneven across countries, with each country’s renewable energy policies having implications for environmental sustainability and the achievement of sustainable development goals”.
Gustafson et al. (2020, 1), “carry out an analysis of US policies to increase the use of renewable energy among Republican and Democratic political parties, and how these differ in their motivations. In a poll they find the Republicans' support for renewable energy is more due to cost/ economic benefit; in the case of the Democrats, the concern is more about global warming. Concluding that these partisan differences have significant implications for those seeking to adapt politics”.
Zeren and Akkuş (2020) “analyse the relationship between trade opening and renewable and non-renewable energy consumption for the main emerging countries according to Bloomberg, in the period 1980-2015. According to its findings, the use of renewable energy is the main reason for the increase in trade openness. In addition, it provides information on increasing the use of renewable energy for a long-term sustainable economy for decision makers, as well as for investors in the energy sector”.
As can be seen, renewable energies are a very topical topic, as important publications on the subject are still available, and the topics covered are very diverse and give various additional fields of study, the article on the importance of renewable energy in North America, being a novel analysis in terms of its methodology and counting with conclusions that are of great interest to the academic community and being an interesting means for public, private and social decision-making.
4. Applied methodology
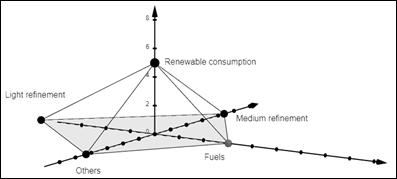
Visualization using geometry of polyhedra, quadrangular pyramids, whose base will be the polygon constituted by the area between four points (Jiang, Yuan, Li, & Wang, 2015; Chen; Li & Chen, 2011; Sohn; Cho, & Im, 2012), each representing the consumption of non-renewable energy (fuels, light refining, medium refining, others), the apex or highest point at which the faces of the pyramid converge represents renewable energy.
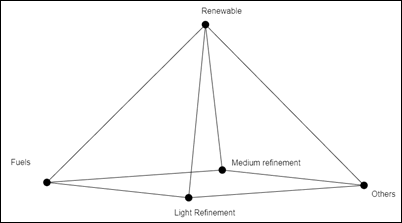
The apex and its height will be in function to the non-renewable consumption, in this way a greater height will express that the consumption of renewable energies increases what will be in function of a lower consumption of renewable energy.
On the other hand, if the consumption of non-renewable energy is increased, the height of the vertex decreases, expressing reduction in renewable energy consumption.
An initial pyramid is proposed (Scalabri & Mussato, 2019), whose values for the points of the base correspond to the consumption in thousands of barrels daily, of energies by type of refinement in 2018, in terms of height, the value corresponds to the consumption of renewable energy in the same year, equivalent to millions of barrels of oil. To achieve the driving force of each non-renewable point, a multiple regression was proposed, where the dependent variable is renewable and non-renewable independent energy. For the regression model, energy consumption data are used in annual periods from 2008 to 2018, which are presented in the following table.
Table 2 Energy consumption in North America
| Year | Light refinement | Medium refinement | Fuels | Others | Renewable Consumption |
|---|---|---|---|---|---|
| Thousands of barrels per day | Equivalent to millions of barrels with oil | ||||
| 2008 | 10,859.00 | 6,934.00 | 941.00 | 5,160.00 | 34.20 |
| 2009 | 10,839.00 | 6,281.00 | 801.00 | 5,080.00 | 39.30 |
| 2010 | 10,950.00 | 6,567.00 | 810.00 | 5,251.00 | 45.60 |
| 2011 | 10,697.00 | 6,694.00 | 745.00 | 5,248.00 | 52.50 |
| 2012 | 10,572.00 | 6,409.00 | 662.00 | 5,306.00 | 59.30 |
| 2013 | 10,778.00 | 6,519.00 | 576.00 | 5,520.00 | 69.80 |
| 2014 | 10,841.00 | 6,792.00 | 447.00 | 5,427.00 | 77.90 |
| 2015 | 11,092.00 | 6,814.00 | 418.00 | 5,547.00 | 83.60 |
| 2016 | 11,287.00 | 6,757.00 | 474.00 | 5,567.00 | 96.70 |
| 2017 | 11,229.00 | 6,927.00 | 519.00 | 5,610.00 | 108.40 |
| 2018 | 11,195.00 | 7,212.00 | 498.00 | 5,810.00 | 118.80 |
Source: own elaboration fetching data from BP Statistical Review of World Energy (2019).
In order to better visual proportion, the information in Table 3 is expressed in natural logarithms (Ramirez, 2015), as shown in Table 4.
Table 3 Energy consumption in North America expressed in natural logarithms
| Year | Light refinement | Medium refinement | Fuels | Others | Renewable consumption |
|---|---|---|---|---|---|
| Thousands of barrels per day expressed in natural logarithms | Equivalent to millions of tonnes of oil expressed in natural logarithms | ||||
| 2008 | 9.29 | 8.84 | 6.85 | 8.55 | 3.53 |
| 2009 | 9.29 | 8.75 | 6.69 | 8.53 | 3.67 |
| 2010 | 9.30 | 8.79 | 6.70 | 8.57 | 3.82 |
| 2011 | 9.28 | 8.81 | 6.61 | 8.57 | 3.96 |
| 2012 | 9.27 | 8.77 | 6.50 | 8.58 | 4.08 |
| 2013 | 9.29 | 8.78 | 6.36 | 8.62 | 4.25 |
| 2014 | 9.29 | 8.82 | 6.10 | 8.60 | 4.36 |
| 2015 | 9.31 | 8.83 | 6.04 | 8.62 | 4.43 |
| 2016 | 9.33 | 8.82 | 6.16 | 8.62 | 4.57 |
| 2017 | 9.33 | 8.84 | 6.25 | 8.63 | 4.69 |
| 2018 | 9.32 | 8.88 | 6.21 | 8.67 | 4.78 |
Source: own elaboration.
With the information contained in Table 4, the energy consumption in 2018 is represented (Image 5).
Congruence evaluations were made with variables considering the values in Table 3 With respect to the individual correlation of each independent with respect to the dependent or Renewable Consumption, in all cases there was a strong correlation, in one case, negative
Table 4 Individual correlations with renewable consumption
| Light Refinement | Medium Refinement | Fuels | Others | |
|---|---|---|---|---|
| Renewable Consumption | 65.26% | 55.62% | -89.39% | 95.71% |
Source: own elaboration.
Talking about the statisticians to evaluate the multiple model, the coefficient of correlation as those of determination, allow to establish acceptable certainty for the approach.
Table 5 Multivariable evaluation statisticians
| Multiple correlation | Coefficient of determination | Adjusted Coefficient of determination | Typical Error |
|---|---|---|---|
| 97.65% | 95.35% | 92.25% | 11.56% |
Source: own elaboration.
Considering the results appropriate to the correlation tests (see Table 5) as the adjustment and error tests (Table 6), we proceeded to structure the multiple regression (Rubio Rodríguez and Maroto, 2016) according to the next elements.
y = renewable consumption
x 1 = light refinement
x 2 = medium refinement
x 3 = fuels
x 4 = other
According to the above, the regression model in this case will be:
Considering the model (1), except in the case of b which shall be a permanent value, the other coefficients shall represent the constant value Which shall multiply the production, according to its non-renewable category, that is:
b 1 x 1 =light Refining Coefficient * light Refining
b 2 x 2 =average refining coefficient * average refining production
b 3 x 3 =fuel coefficient * fuel production
b 4 x 4 =other coefficient * production other
5. Simulation and results
In the previous section the approach was made with those of total energy consumption in North America, which includes the United States of America, Canada and Mexico, obtaining the following model:
Renewable consumption = -60.55 + 1.25x 1 - 0.7930x 2 - 0.4458x 3 + 7.3244x 4
It is necessary to emphasize that the previous results will mean the magnitude or height of the pyramids, representing renewable consumption, performing four simulations, each decreasing 5% in each of the independent variables (one at a time), remaining the others with the values reported to 2018, verifying the changes in the height of the pyramids.
Table 6 Results in energy consumption according to simulation criteria
| Concept | Renewable consumption | Light Refinement | Medium Refinement | Fuels | Others | |
|---|---|---|---|---|---|---|
| Natural algorithm | Million tons | x 1 | x 2 | x 3 | x 4 | |
| Historical consumption 2018 | 4.78 | 118.80 | 9.32 | 8.88 | 6.21 | 8.67 |
| First simulation | 4.22 | 68.23 | 8.86 | 8.88 | 6.21 | 8.67 |
| Second simulation | 5.15 | 172.73 | 9.32 | 8.44 | 6.21 | 8.67 |
| Third simulation | 4.94 | 139.77 | 9.32 | 8.88 | 5.90 | 8.67 |
| Fourth simulation | 1.60 | 4.95 | 9.32 | 8.88 | 6.21 | 8.23 |
Source: own elaboration.
Table 6 presents in its first line, the data for 2018, the second line presents the result in the consumption of renewable energy if light refining decreases, the third line shows what would be the renewable consumption but decreasing the medium refining energies, the fourth line corresponds to the renewable result if the production of fuels were to be decreased, finally the last row presents the result in the consumption of renewable energies decreasing 5% in the category of others.
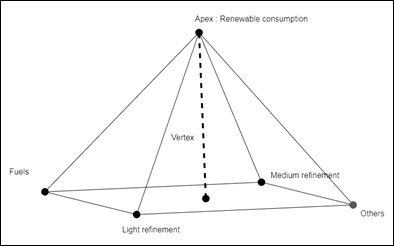
Below is the display of data, the peak of which varies depending on the result in the renewable consumption obtained by regression
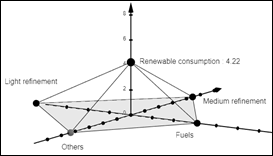
Source: own elaboration
Image 6 Light refinement reduction Consumption expressed as natural logarithm
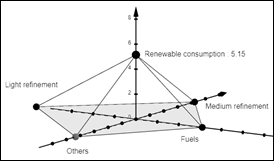
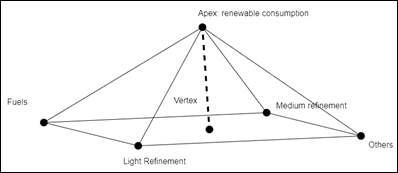
Source: own elaboration
Image 7 Medium refinement reduction Consumption expressed as natural logarithm

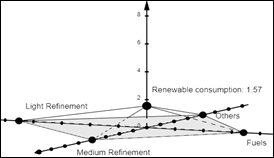
According to Images 6 and 7, reducing the consumption of energy from medium refinements and fuels would lead to increased consumption of renewable energy, in the first case the original consumption equivalent to 118.80 million tonnes with a reduction of 5% in refining means could stimulate the use of renewable energy up to the equivalent of approximately 172.73 million tonnes, while the same reduction but in fuel consumption could stimulate the equivalent of approximately 139.77 million tonnes, however, reducing the consumption of light refining products or in the category of others, would result in a reduction in the consumption of renewable energy by 68.23 and 4.95 equivalent to millions of tonnes.
Conclusions
This article makes an evaluation of the importance of renewable energies, in relation to conventional energies, highlights the five fundamental energy sources that are: A) The sun; B) the gravitational motion and potential of the sun, moon and earth; (C) geothermal energy, chemical reactions, and natural radioactivity; (D) nuclear reactions; and (E) chemical reactions of mineral resources. noting that only the first three generate renewable energy and the last two are considered conventional energy.
What fundamental differences we find between renewable and conventional energies, the most important being the infinite and finite use, the cost because the former are free and the latter are increasingly costly, another difference is the scope for its use as the former are more local and the latter are more global, in terms of equipment the former are more expensive than the latter, and in the former the environmental damage is moderate, whereas in the latter, environmental pollution is common.
One of the main agreements that has allowed the development of renewable energies, is undoubtedly the Kyoto protocol, which seeks to reduce greenhouse gases: carbon dioxide, methane, nitrous oxide, hydrofluorocarbons, Perfluorocarbon, and sulphuric hexafluoride, being one of the best ways to achieve this, the promotion of clean energy.
One of the important observations we find is that considering the data of the Wold Oil Outlook (2019), is that in 2018 renewable energies considered as such hydroelectric, biomass and other energies, represented just 14% of the world’s energy component, this amount grows by an estimate to 2040 to be 19%, which is barely 5%, however if we look at its percentage growth in renewable energy alone the growth is 36% in the same period, which tells us about the estimated development in the period 2018-2040, which shows that they are the ones with the greatest development in time.
T Although in the international literature we find a lot of studies on renewable energies, our study is of great importance because using financial economic information, using geometry of polyhedral.
It turns out to be very new to visualize the importance of renewable energy in North America. It also provides a prominent simulation tool, as it is constructed in such a way as to reflect energy consumption movements according to projected past consumption. While important variables, such as prices, resource availability and regulatory frameworks, are left aside for the time being; is a good model that allows to visualize through the pyramids the movements of energy consumption measured in millions of barrels of oil.
Our results show that with a reduction of 5% in refined media, it could stimulate the use of renewable energy up to the equivalent of approximately 172.73 million tons. While the same reduction but in fuel consumption could stimulate the approximate equivalent to 139.77 million tons, however, by seeking to decrease the consumption of light refining products or others, would lead to a reduction in renewable energy consumption by 68.23 and 4.95 million tonnes.

