


 nueva página del texto (beta)
 Inglés (pdf)
 Artículo en XML
 Referencias del artículo
 Enviar artículo por email
 Citado por SciELO
  Similares en
SciELO
Similares en
SciELO 
 Permalink
1. Introduction
Considerable attention continues being given to the study of trust in government in developed and developing countries. This interest is the result of the evidence that trust gives legitimacy to the political system, strengthens democracy, and contributesto increase economic growth (Zak and Knack, 2001).The study of political trust in Latin America has special significance given that the Latin American countries have the lowest values of trust in government of all regions in the world (Latinbarometro, 2017).
This paper presents an analysis of the determinants of trust in government in a sample of 18 Latin American countries. The paper does not present new theories on this matter, rather it has a character of “stylized facts”, given its emphasisinstudyingthe associations between trust in government and economic and social variables. The next section presents a review of selected literature; this is followed by the data and its characteristics. The associations between trust with inequality, labor market variables, taxation and political orientation are analyzed. The paper ends with a series of conclusions.
2. Review of selected literature on trust in the government
Early analysis of trust in government can be attributed to Easton (1965), who distinguished between two types of trust in government: diffuse trust, which arises from the individuals’ convictions of the intrinsic values of democracy, and specific trust,that resides in citizens’ perception of what they gain from the political process. An underlying concept in the study of trust in government is that of social capital, which was first proposed as a distinctive concept by Putman (1995), who classified it as bonding social capital, or the cohesion between an individual and his close family and groups of friends, and bridging social capital, which results from the interaction of individuals with groups not akin to their social stratum.
Clausen, Kraay and Nyiri (2011) used the replies from a sample of 49,019 persons from 90 countries and inferred that corruption had a negative impact on trust in public institutions. Other variables with negative repercussions on trust were the individuals’ age, having reached tertiary education, and access to internet and to television.
Chanley (2002) studied trust in the US federal government during the 1980-1997 period reporting that negative perceptions about the economy, scandals in Congress, and preoccupation with crime, generated the loss of trust in the federal government and in the Congress.
The World ‘Bank (2015) concluded in the case of the Middle East and North Africa countries, that the main determinants of trust in national institutions were the citizens’ satisfaction with education and health care services, but the perception of corruption in the public sector tended to lower their trust2.
Christensen and Laegreid (2002) analyzed trust in public institutions in Norway, reporting that the main determinants were satisfaction with democracy, followed by satisfaction with public services.
Kouvo (2011) reported that in the European countries trust in government increases with employment, and decreases with the sense of insecurity. Trust in government was higher in the Scandinavian countries and in Holland due to their more extensive social protection programs than those of other countries. In this respect, Easterlin (2013) has presented evidence that trust in government increases in parallel to the increase in the benefits from national social protection programs.
Blind (2006) identified the causes behind the decline of trust in the developed countries, which included deficient economic performance, corruption, political scandals, and the perception that the governments did not implement policies to create good jobs. The variables that increased trust in government were economic growth, job creation, and improved access to education, security and the combat of corruption.
In the case of Japan, Maeda and Miyahara (2003) used several surveys to identify the determinants of trust in the national government, in business and in citizens groups. Their results indicated that trust was determined by transparency and honesty in themanagement of public affairs, by the care in attending the needs of the community, and by the overlap in matters of values.
With respect to Japan and South Korea, Kim (2010) reported that trust in the government was determined by its success in conducting the economy, by the quality of public services, control of corruption, and by the existence of opportunities available to citizens to participate in public affairs.
In a study on trust in city and national governments in China, Zao and Hu (2015) reported that the principal determinants were the quality of public services, transparency of government, and opportunities to participate in government affairs. The authors added that as the education level of citizens increased, or as their age decreased, their trust in government tended to decrease.
3. Data and its characteristics
The values of trust in government corresponding to the averages of the 2007-2012 period were taken from UNDP’s Human Development Report 20133. This publication was also the source of data on the perception that the government is committed to combat poverty, and the Gini coefficient. Labor market variables and poverty rates were taken from the World Bank’s World Development Indicators; the governance indexes were taken from the World Bank’s World Governance Indicators. The data used in the estimations is presented on annex 1.
Unit roots tests were conducted to determine whether the variables were stationary. The ADF tests indicated that all variables, except trust in government and control of corruption, were not stationary at the 5 per cent level4; the ADF tests were also applied to the first difference of the variables with results showing that they were stationary and thus it was inferred that the variables were integrated of order 1. The equations were estimated using the cointegration least squares methodology (cointegration least squares) developed by Phillips and Hansen (1990), so as to take into account the non-stationarity of the variables. The methodology consists of expressing the national index oftrust in government in terms of variables that have been identified in recent literature to be associated with it. Thus, in general terms, it can be postulated that trust in government is a function of inequality, labor markets, social systems and education variables.
4. Estimation of equations
Table 1 shows results from the estimation of equations expressing trust in government in terms of economic and social variables, using cross section data from 18 Latin American countries5.
In equation 1, the independent variables is the Gini coefficient, which is an indicator of vertical inequality. The coefficient of the Gini coefficient is negative and significant at the ten percent level and the equation explains 16 per cent of the variance of trust in government. This result means that the Gini coefficient by itself explains almost one fifth of the variance of trust in government; Machado, Scartascini and Tommasi (2011) have shown that inequality is the main determinant of political conflict in the Latin American countries6.
It can be seen on equation 2 that the coefficient of the perception that the government is committed to reduce poverty is positive and significant and the equation explains 45 per cent of the variance. In equation (3) the coefficient of female self-employment is significant and negative, but that of male self-employment is negative and not significant (equation (4). The participation of women in the shadow sector (or self employment), may weaken their trust in government as women may feel “betrayed” or “frustrated” when they do not experience an improvement in their labor market status and continue in precarious labor, while men seem to be “calm” and “patient”, and do not rush to reduce their trust in government.
Equation (5) shows that the coefficient of female quality employment is positive and significant but the coefficient of male quality employment is not significant, as seen on equation (6). This indicates that having a good job stirs in women a sentiment of trust in the government, as women may feel “thankful”, whereas men feel “indifferent” towards the government when they have a good job. The case may be that men feel they are “entitled” to have good jobs, whereas women consider that having agood job is an “accomplishment”. Another explanation may be that men are more “political” inclined than women and act according to “party lines”.
The results shown in equation 2-6 denote the aspiration of women that the government will make reality their desire of having good jobs. This implies that supporting women’s economic aspirations constitutes a valuable public policy in economic terms, but it is also a good political tactic that can render important dividends in times of elections.
There is evidence of the existence of a sense of reciprocity (or “gift-exchange” model), whereby voters that feel that the government’s policies have improved their well-being and reciprocate voting to benefit the incumbent government7. Moreover, Chanley (2000) has shown that in the US the deterioration of trust in government may be an early indicator of adverse electoral outcomes to the party occupying the presidency.
In equation (7) the independent variables are the perception that the government is committed to reduce poverty and the coverage of health insurance, in percentage terms. The latter variable shows a positive coefficient which is significant at the five per cent level. In equation (8) the coefficient of the national coverage of pensions is not significant.
Other equations were estimated with including the independent variables the social expenditures per capita, education expenditures as percentage of the GDP, and World Bank governance indicators, such as those of Rule of Law and Control of Corruption, but their coefficients turned out to be insignificant. These results contrasts with those of Justino and Martorano (2018) who have shown that in the Latin American countries public sector social expenditures lessen political tensions, and that since 1980 the actual increases of these expenditures has been accompanied by negative trends in political conflicts.
Table 1 Determinants of trust in government8.
| Equation Number: | ||||
|---|---|---|---|---|
| Independent Variables: | (1) | (2) | (3) | (4) |
| Constant | 81.1337*** | 10.5489 | 4.7091 | 1.7384 |
| (23.18) | (9.03) | (6.23) | (7.26) | |
| Gini | -80.7105* | . | ||
| (46.60) | ||||
| Commitment to reduce poverty | 0.7496** | 1.0062*** | 1.00025*** | |
| (0.21) | (0.07) | (0.13) | ||
| Selfemployfem | -0.1800** | |||
| (0.08) | ||||
| Selfemplotmasc | -0.0963 | |||
| (0.14) | ||||
| R2 | 0.16 | 0.45 | 0.81 | 0.76 |
| F. statistic | 3.00 | 13.30 | 30.51 | 22.69 |
| Prob | 0.102487 | 0.002171 | 0.000008 | 0.000040 |
| Significance levels: *** 1%; **5%;*10% | ||||
Table 1 continuation. Determinants of trust in government9.
| Equation Number: | ||||
|---|---|---|---|---|
| Independent Variables: | (5) | (6) | (7) | (8) |
| Constant | -14.2314 | -6.9656 | 3.1891 | -1.7842 |
| (8.30) | (11.77) | (9.61) | (11.68) | |
| Commitment to reduce poverty | 1.0126*** | 0.9989*** | 0.6980*** | 0.7981*** |
| (0.13) | (0.15) | (0.13) | (0.20) | |
| Quality female Employment | 0.2010** | |||
| (0.09) | ||||
| Quality male Employment | 0.0840 | . | ||
| (0.13) | ||||
| Health coverage | 0.2253** | |||
| (0.08) | ||||
| Pension coverage | 0.1723 | |||
| (0.12) | ||||
| R2 | 0.82 | 0.76 | 0.63 | 0.55 |
| F | 31.50 | 22.52 | 11.13 | 8.44 |
| Prob. | 0.000006 | 0.000042 | 0.001500 | 0.004000 |
| Significance levels: *** 1%; **5%;*10% | ||||
5. National culture and trust in government
A question that may arise is whether an indicator of national culture should be included as an independent variable in the equations shown on table 1. The estimated equations have R squared of around 70 per cent in all cases, indicating that they explain high percentages of the variance of trust in government; however, it can be argued that national culture would exert an impact on trust in government.
Fatih, Kalemly-Ozcan and Sorensen (2007) resorted to indicators of social capital to represent the prevailing culture in a region or country, using as expressions of culture, measures of trust and confidence. The indicator of trust was based on the replies to the question” “Most people can be trusted”, and “I trust most people in the country”, whereas the indicators of confidence was based on the replies to the questions: “I trust the courts”, and “I trust the parliament”. Both indicators were computed from the replies in the World Values Survey. These authors presented results showing that those indicators of culture explained the capital inflows to regions of a European country, but not between countries. Tabellini (2005) used similar indicators of culture to determine the role of culture on per capita income levels of European regions. However, Tabellini’s and Fatih, Kalemly-Ozcan and Sorensen’s indicators differ from the indicator used in this paper. The indicator used in this paper is trust in government, which refers to the Executive branch.
Levitt (2015) has argued that trust in people, and interactions with fellow citizens, which can be viewed as a measure of national culture, determine people’s political attitudes. Levitt tested whether ethnic discrimination, an indicator of national culture, motivates mistrust in government in the Latin American countries, reporting that such effect is modest and is directed primarily to Congress and high courts, without significant impact on trust in the government10. Levitt (2015) reported that in the Latin American countries, people’s perception of discrimination or mistreatment in public offices leads to decreased trust in government when the incumbent President belongs to a party of “left” orientation, which is expected to represent “the people”. The experiences of ethnic minorities in the US is different: African Americans who have long been victims of discrimination report low levels of trust in government (Avery, 2006).
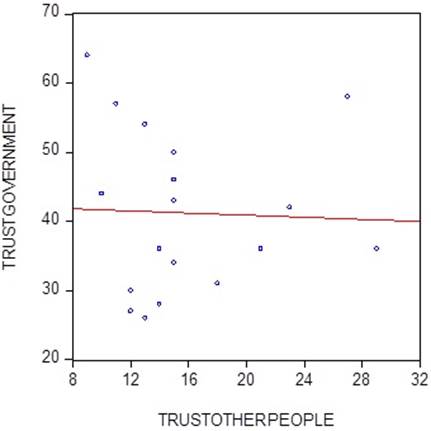
Several authors have reported that other indicators of national culture such as participation in religious activities, attendance to public events and participation in sports are determinants of trust in other people. However, in the Latin American countries there is no association between trust in other people and trust in government, as shown on graph 1.
6. Social services, inequality and trust
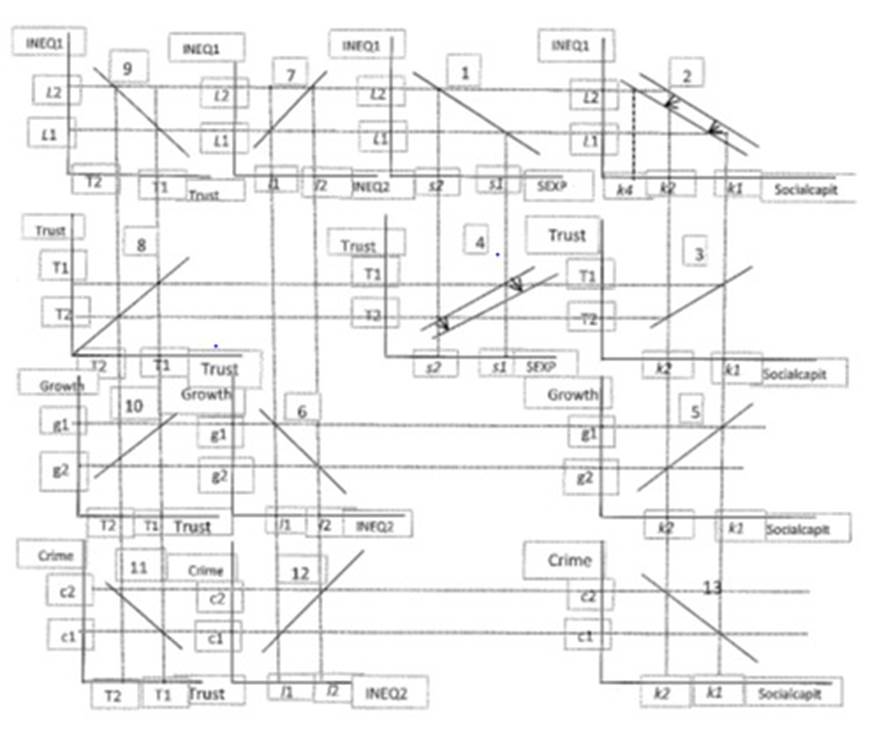
The manner in which inequality affects trust in government is analyzed on graph 2. Quadrant1 shows the negative association between inequality, INEQ1, and social expenditures, Sexp, (Caceres, 2017).Quadrant 2 depicts a negative relationship between inequality and bridging social capital, Socialcapit, (Brehm and Rehm (1997). There is evidence that bridging social capital is determined by the level of education, by being employed and by participation in church activities, and that it engenders attitudes that promote civil liberties and racial and gender equality (Growiec and Growiec, 2014). Quadrant 3 shows the positive association between social capital and trust in government, a relationship detected by several authors (Brehm and Rehm, 1997). Quadrants 1and 3 provide the basis to derive the relationship shown on quadrant 4 expressing the positive association between social expenditures and trust in government, which has been shown by several authors (World Bank, 2015). These graphs indicate when social expenditures decrease from s1 to s2, social capital and trust decrease from k1 to k2, and from T1 to T2 respectively.
Quadrant 5 presents the positive relationship between bridging social capital and economic growth, Growth, as has been reported by Beugelsdijk and Smulders (2003); the fall in social capital is conducive to a reduction in economic growth, from g1 to g2, which in turns gives rise to an additional increase in inequality from e1 to e2, as shown on quadrant 6. Using quadrants 1 and 6 a relationship is obtained on quadrant 7 which shows that the initial increase in inequality, Ineq1, has given rise to a subsequent additional increase in inequality, INEQ2. This means that an initial cut in social spending has led to a cumulative process whereby inequality reproduces itself.
Quadrant 8 shows the 45 degrees line that permits the construction of a negative relationship between inequality and trust (quadrant 9). Quadrants 6 and 8 are used to construct a positive relationship between trust in government and economic growth (quadrant 10), a relationship that has been reported by several authors (Citrin and Greene, 1986; Knack and Keefer, 1997).
Quadrant 11 shows the negative association between trust and crime, which has been reported by Chanley (2000). Using this relationship and the one shown on quadrant 6, it is possible to derive a positive association between crime and inequality (quadrant 12), as has been shown by Caceres (2017). As well, quadrant 13 shows the negative association between social capital and crime.
Graph 2 has shown that a reduction of social expenditures can give rise to persistent increases in inequality, thus undermining social capital, trust in government, economic growth, and promoting crime. In fact, Voth (2011) has shown that expansive fiscal policies lead to reductions in political tensions in the Latin American countries; this author concluded that “social peace can be bought”.
Next, the assumption is made that in a given country there emerges a sentiment of resentment in some groups of society because they perceive they do not receive a fair share of national public goods and are left behind in the availability of good jobs. Orsome members of society may perceive that ethnic minorities receive an “undeserving” attention from the government. This situation gives rise to lower tolerance of racial or economic differences, which would lower bridging social capital, which has distinct repercussions on inequality. This is represent in quadrant 2 by a downward shift of the line representing the association between bridging social capital and inequality, indicating that the original level of inequality now gives rise to lower levels of social capital by virtue of the increased social frictions. In this case a new relationship between social expenditure and trust in government is obtained on quadrant 4, which shows that to the previous levels of social expenditures there correspondents lower levels of trust. This process can be aggravated by cuts in social expenditures which would engender increased political instability or the perception that public policies are irrelevant to the preferences of the population11, which may lead to the rupture of the political process.
7. Trust and government political orientation in Latin America
Table 2 shows the 10 Latin American countries with the highest percentages of the population who believe the government is attacking the problem of poverty in the 2007-2012 period, taken from UNDP’s Human Development Report 2013. It can be seen that thehighest percentages correspond to 5 countries whose governments can be classified as “leftist”. This table also shows 10 countries with the highest ratings of trust in government; with the exception of Guatemala, Mexico and Dominican Republic, the governments of the other 7 countries can be classified as “leftist”. This suggests that in that period the “leftist” governments of Latin America received more trust from the respective populations, because the population perceived that they were committed to poverty reduction. This result cannot be interpreted as a result of “populism”, rather it exemplifies a population that is avid of good jobs, and that it is knowledgeable of the governments that are working towards that end.
Table 2 Trust in the government and perception that the government is committed to combat poverty
| Trust in government (2007-2012). Percentage points | Perception government attends poverty reduction (2007-2012). Percentage points | ||
|---|---|---|---|
| Ecuador | 64 | Venezuela RB | 60 |
| Uruguay | 58 | Ecuador | 59 |
| Nicaragua | 57 | Uruguay | 58 |
| Venezuela RB | 54 | Bolivia | 56 |
| Guatemala | 50 | Nicaragua | 53 |
| Brazil | 46 | Republic Dominic | 46 |
| Bolivia | 44 | El Salvador | 43 |
| Dominic Republic | 43 | Brazil | 43 |
| Argentina | 42 | Guatemala | 41 |
| Mexico | 36 | ||
There exists evidence that “leftist” Latin American governments, contrary to those of other orientations, implement policies that benefit the population and strengthen the state (Grassi and Memoli, 2016). This evidence also exists in other regions where “leftist” governments have been more successful than governments of other orientation in improving social conditions. Muntaner et al. (2002) reported that in the US, Canada and 14 European countries, governments of “left” parties (mainly the social democracy governments) had more positive impacts on the social indicators than governments of other nature12. It has to be pointed out, that in the Latin American countries, “left” parties encounter difficulties to increase tax revenues (Huber, Nielsen, Pribble and Stephens, 2006)13, and in consequence may have difficulties delivering the public goods demanded by the population.
8. Taxes and trust in government
Graph 3 shows that as the 2012 values of tax revenues as percentage of GDP, (Tax), increase, trust in government, (Trusttax), tends to increase in the Latin American countries14, and corroborates the argument that what matters to the population is the ability of the government to deliver public social goods, and this ability is determined by the availability of tax resources. It can thus be argued that maintaining low tax revenues represents the promotion of political instability.

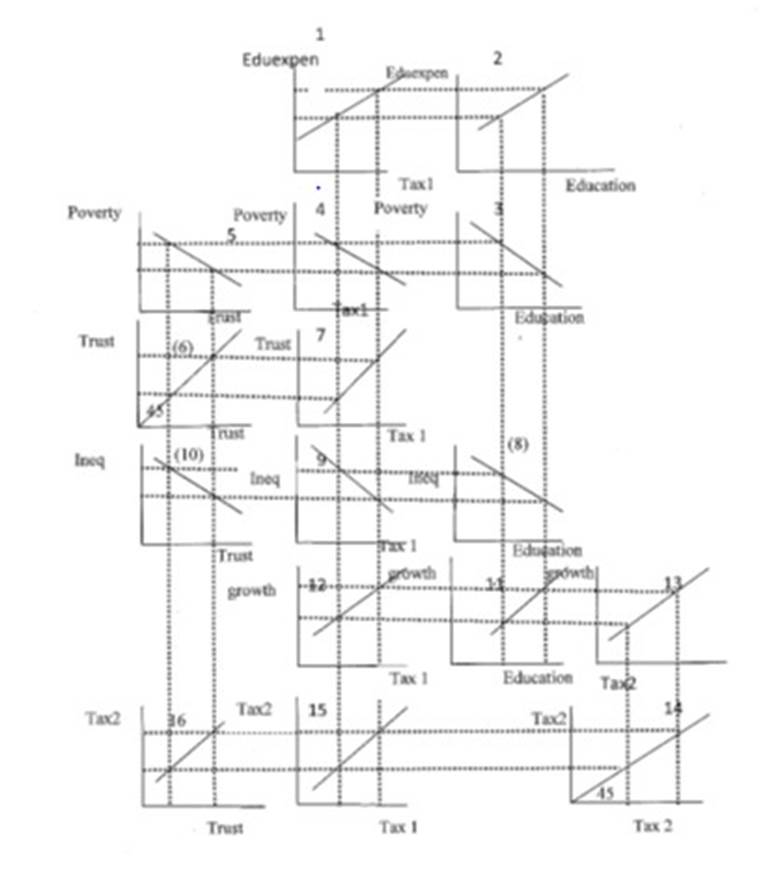
The repercussions of tax revenues on trust in government and other variables is shown on graph 4. Quadrant (1) shows the increase in education expenditures, Eduexpen, resulting from increasing tax revenues, Tax1. Evidence from Latin America indicates that increased expenditure in education leads to increasing levels of school attainment (Caceres, 2018), which is the relationship shown on quadrant (2). In Latin America, poverty decreases as education attainment, Education, increases (Psacharopoulos et al, 1995; Caceres, 2018), as shown on quadrant (3). With quadrants (1) and (3), quadrant (4) is constructed, which depicts a negative association between tax revenues and poverty, Poverty. Quadrant (5) shows the inverse relationship between poverty and trust in government, Trust, a relationship that was shown by equation (8) on table 1. Using the 45 degrees line of quadrant (6) a relationship is obtained on quadrant (7) depicting the increase in trust in government resulting from increasing tax revenues, as was shown on graph 3.
Quadrant (8) shows the negative association between education attainment and inequality (Lopez-Calva and Lustig, 2009).With quadrants (7) and (8) a negative association between tax revenues and inequality is obtained on quadrant (9), while quadrant (10) shows the negative association between inequality and trust, as shown by equation 1 on table 1.
Quadrant (11) depicts a positive association between education attainment and economic growth, which has been reported by a vast literature, while quadrant (12) represents the positive association between the initial increase in tax revenues and economic growth. The implication is that increasing tax revenues to provide additional financing to education imparts dynamism to economic growth.
The resulting economic dynamism gives rise to a new increase in tax revenues, which is called Tax2 on quadrant (13). Using the 45 degrees line of quadrant (14) a relationship is obtained on quadrant (15) that depicts the positive association between the initial and subsequent increases in tax revenues, Tax1 and Tax2 respectively. The new increase in tax revenues leads to an additional improvement in trust in government, shown on quadrant (16), which indicates that trust in government and tax revenues increase persistently as part of this virtuous cycle.
This process is backed by solid evidence from economic literature.
9. Taxation and trust in historical perspective
The relationships described on the quadrants of graph 4 are of a dynamic nature in the sense that past values of a given variable exert impacts on the current values of other variables. Graph 5 depicts the negative association between per capita taxes paid in 10 Latin American countries in 1870, (TAX1870), taken from Sokoloff and Zolt (2004), and the corresponding ratio of the share of national income received by the fifth quintile, the richest, to the first quintile, the poorest, (Q5Q1), in 2008. This is the association shown on quadrant 9 on graph 4; it suggests that deficient taxation has been reproduced through time, thus imparting persistence to inequality15.

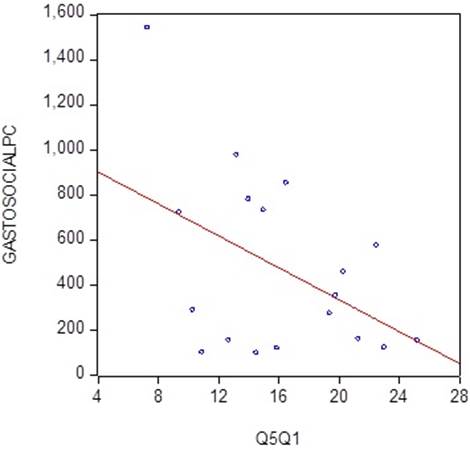
A point to stress is the inverse relationship between 2008 inequality (Q5/Q1) and 2010 per capita social expenditures, (Gastosocialpc), as shown on graph 6.
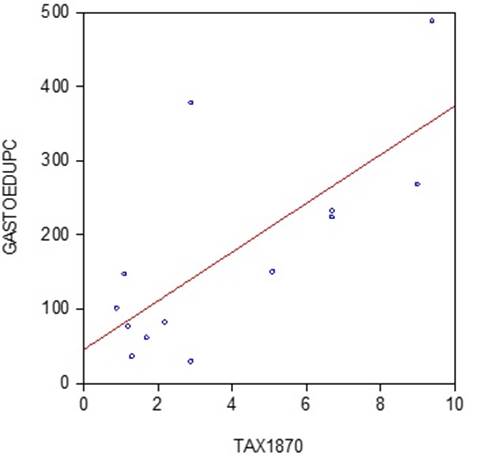
Given that the current Q5Q1 indicator mirrors taxation prevailing in 1870, (graph 5), it is no surprise that current per capita education expenditures, (Gastoedupc), reflect 1870 taxation, as shown on graph 7.
10. Economic growth and trust in government
There exists evidence that people’s evaluation of the domestic economy have incidence on their trust in government (Chanley, 2002; Citrin and Green, 1986).
Graph 8 shows the trajectory of the Latin American countries’ regional measures of trust in government, taken from LatinBarometro (2017), and regional average annual rates of economic growth, during the 2002-2015 period. It can be seen that both series tend to move in synchronism, with a persistent declining tendency since 2009 when the global crisis was felt with more intensity in the Latin American countries. An equation was estimated expressing regional trust in government in terms of the regional annual rate of regional economic growth with two year lag, with the following results:
(The “t” statistics are shown underneath the corresponding coefficients).
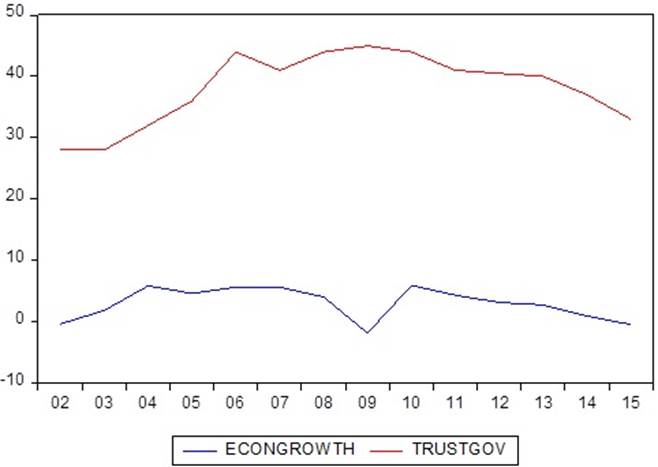
The coefficient of economic growth is significant and positive, such that a one point increase in lagged economic growth leads to an increase in trust in government of 1 percentage point. The initial deterioration of economic activity starts to undermine trust after two years, so governments have time to correct economic course.
Reference should be made to Welsh and Kuhling (2016) study that showed that, in thirty OECD countries, the indexes of economic activity, inflation, and unemployment rates, exerted appreciable impacts on subjective wellbeing. A linear combination of these three macroeconomic variables was associated with the indexes of national institutions such as civil liberties and control of corruption.
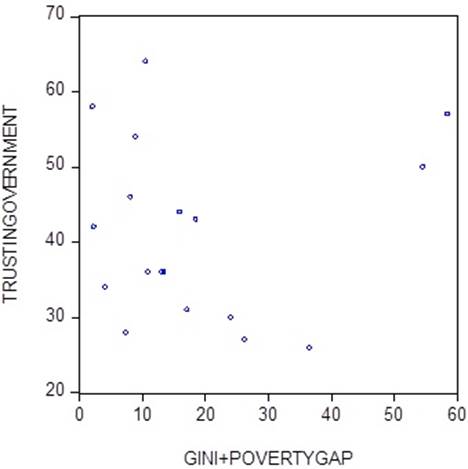
Arthur Okun proposed the computation of a “misery index” composed of the sum of the annual inflation rate and the unemployment rate, which is still used in some media outlets to provide an approximation to people’s perception of the economy. Lovell and Tien (2000) reported that this index is a good predictor of consumer sentiment. It would be interesting to construct a government misery index that can gauge the strength of trust in government in the Latin America countries, without resorting to the Gallup Poll or the World Value Survey, and others. As an example, the sum of the Gini coefficient and the poverty gap can provide a simple, easy to compute index of trust in government, as shown on graph 9. It can be seen that if the two outliers, Honduras and Nicaragua, are discarded, the negative association between trust and the proposed index is close, so the index can be used to assess and predict citizens’ satisfaction with the government.
Hetherington’s (1999) indicated that a drop of trust in government motivates citizens to support and vote against the incumbent president’s party. Thus, the case may be that the Latin American “pink tide” has receded because of the adverse repercussions on economic growth from the global crisis and the fall in commodity prices.
11. Crime and trust in the government
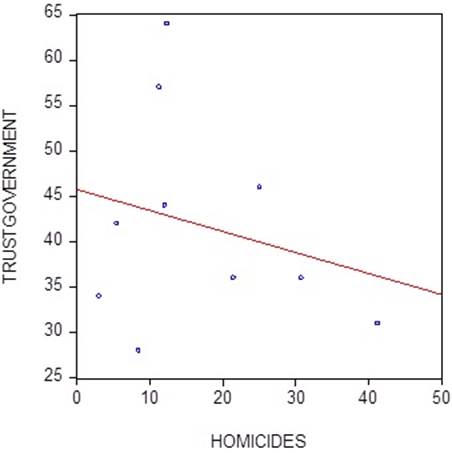
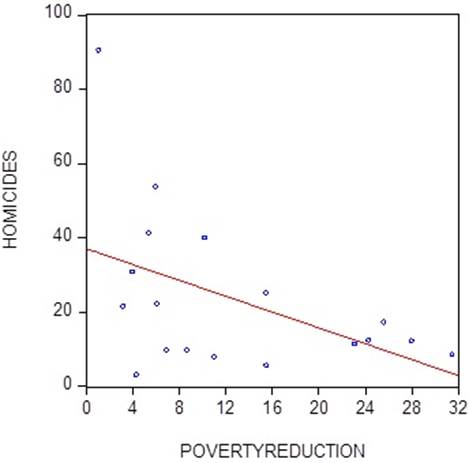
The Pew Research Center (1998) has reported that rising crime undermines trust in government in the US. It can be seen on graph 10 that there exists a negative association between the 2012 homicide rates, (number of homicides per 100,000 people), taken from UNDP (2013), and trust in government in the Latin American countries16.
Graph 10 can be associated with the evidence that crime declines with the increase of quality employment and with improvements in social services, (Caceres 2017), variables that have positive associations with trust in government. As well, there is evidence that in countries where poverty declined in the 2002-2010 period, their 2012 homicides rates tended to be low, (graph 11),and consequently trust would tend to be high.
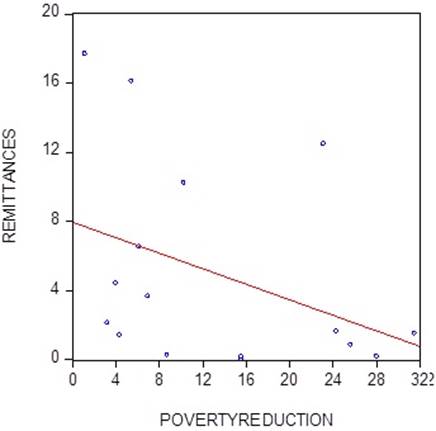
Graph 12 shows that remittances as percentage of GDP have a negative association with the reduction of poverty, implying that people do not emigrate from countries where poverty has been reduced. This is evidence that emigration, and remittances, result from deficient social services and poverty in the source country (Caceres, 2017).
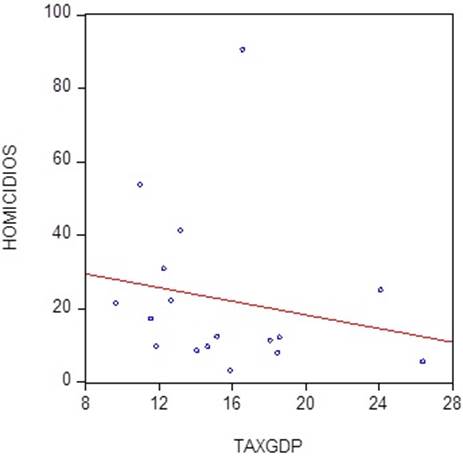
It can be deduced that the inability of governments to deliver social public goods leads to increased crime. It can be argued that this inability rests on the scarcity of tax revenues; in fact, there is a negative association between taxes as a percentageof GDP, (TAXGDP), and the homicides rates, as shown on graph 13.
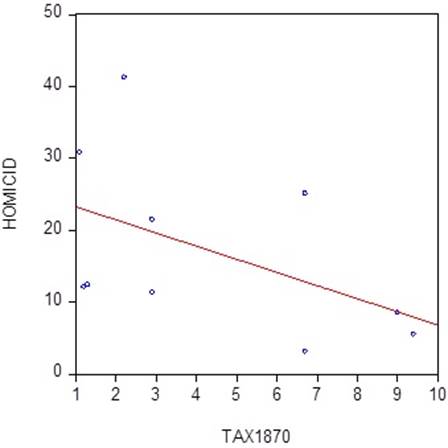
Graph 6 showed that in a sample of Latin America countries their per capita tax revenues in 1870 were associated with their 2010 per capita education expenditures; this explains the negative association between the 1870 per capita tax revenues and the corresponding 2012 homicide rate shown on graph 14.
The implication is that the reluctance or opposition to increase taxes exerted by specific groups has been reproduced since 1870, thus constraining the capacity of the public sector to increase social services, and consequently generating the rise of underemployment, emigration, and violence.
Given the existence of a negative association between the homicide rate and trust in government, (graph 10), it can be expected that countries where the crime rates have fallen would have larger values of trust in government than countries where crime hasnot decreased. The implication is the reductions of crime and poverty can become determinants of the outcomes of the electoral processes17.
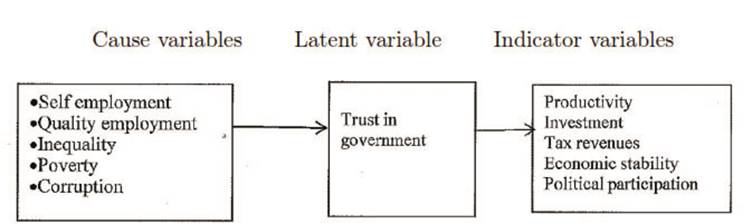
12. Trust as a latent variable
The indexes of trust in government are generally obtained by means of surveys of specific or random populations. A potential more precise manner of measuring trust in government consists of assuming that trust is a latent variable, and furthermore, identifying the corresponding cause and indicator variables. This model is shown on graph 15.
The cause variables can be indicators of self and quality employment, measures of inequality, poverty, tax ratio, and corruption. The indicator variables can represent indicators of labor productivity, economic growth, and investment, economic and social stability.
13. Robustness
Robustness tests were carried out including additional independent variables to the base line equations presented on table 1, with results shown on table 3. Equation (1) indicates that the coefficient of the new control variable, Rule of Law, is not significant and the sizes of the coefficients of the other control variables are similar to those of equation (2) on table 1. A similar result is obtained on equation (2) with the additional variable Control of corruption, whose coefficient is not significant and those of the base original variables are similar to those of equation (3) on table 1. In equation (3) the additional control variable is the National Index of Happiness, taken from UNDP (2013), whose coefficient is not significant and the coefficientsof the other control variables did not change with respect to those of equation (4) on table 1. In equation (4) the coefficient of control of corruption is not significant and the coefficients of the other variables are similar to those of the baseline. These results can be interpreted in the sense that the results presented on the base line case, table 1, are robust to the inclusion of additional variables.
Table 3 Trust in government. Robustness tests18
| Equation Number | ||||
|---|---|---|---|---|
| Independent Variables | (1) | (2) | (3) | (4) |
| Constant | 5.3311 | 0.6284 | -4.0378 | -4.0372 |
| (0.79) | (0.37) | (12.17) | (14.70) | |
| Commitment to reduce poverty | 0.9963** | 0.9978*** | 1.0284*** | 0.9937*** |
| (0.13) | (0.16) | (0.13) | (0.16) | |
| Selfemplofeme | -0.1719 | |||
| (0.09) | ||||
| Rulelaw | -0.7023 | |||
| (2.20) | ||||
| Selfemplotmasc | -0.0589 | |||
| (0.18) | ||||
| Controlcorruption | 0.8302 | 0.9764 | ||
| (2.76) | (2.75) | |||
| Cualityemplofeme | 0.3101*** | |||
| (0.13) | ||||
| Happiness | -2.7335 | |||
| (2.45) | ||||
| Qualityemplomasc | 0.0422 | |||
| (0.18) | ||||
| R2 | 0.81 | 0.76 | 0.76 | 0.77 |
| F. statistic | 19.0716 | 14.1758 | 21.9250 | 14.17 |
| Prob | (0.000000) | (0.000222) | (0.0000211) | (0.000123) |
| Significance levels: *** 1%; **5%;*10% | ||||
14. Conclusions
Results presented on equations (2)-(5) of table 1 denote the existence of a relationship of reciprocity between citizens who feel their wellbeing has improved as a consequence of government policies and the current government. This implies that citizens will support the incumbent party and express their gratitude in elections. Given that this relationship is of a “transactions” nature, there may be only a reduced space where ideology matters. This means that increasing social spending, which is usually viewed as “populism” can have an important role in promoting social and political stability, and in the consolidation of democracy19. In the setting of the “gift exchange” model ideology has no role, what matters is the government capacity to deliver social goods. But this requires additional tax revenues, and in their absence social instability may arise. The opposition to taxation may be disguised as economic ideology as it is claimed that taxes decrease private investment and castigate work; however, there is no basis behind such claims, and thus that “ideology” may be only an expression of greedand power. A perverse case may occur when certain groups manifest their desire that the supply of social goods destined to ethnic minorities be reduced or eliminated and the government acts accordingly, as in a model where the basis of the “gift exchange” model is racism.
The evidence presented in this work shows that trust in government increases with the reduction of poverty and decreases with increases in inequality. The question that arises is why all governments do not carry out more significant programs to reduce poverty and inequality.
Weak public finances have not permitted some of the Latin American countries to generate a virtuous circle of taxation, increased human capital spending, increased economic growth, additional tax revenues, and so on, which has left the distribution of income, and the corresponding “capture” of government, unchanged, and thus the blockade to larger tax revenues and social services has continued unabated. Inadequate taxation may be viewed as a consequence of governments that have been “captured” and where higher income groups exert the “privilege” to abuse and use their “brand” to manipulate national institutions to their personal benefits (CEPAL, 2018).
Given that the population in many countries have scant knowledge of the important issues that have incidence on the country, it is possible that wide segments of the population be influenced by campaigns that demonize tax increases and social spending, which are labeled as “populism”, and in consequence vote against their interests. This would give rise to a situation whereby the government would continue “captured” by the higher incomes groups, (Acemoglu and Robinson, 2008), or democracy itself becomes “captured”, and be used as a “show”, as depicted by Acemoglu , Johnson, Robinson and Yared (2008).
The underlying cause of these phenomena is inequality in the distribution of income, which enables high income groups to employ their economic power to become “owners” of the political process, with ability to conduct campaigns dressed as rallying cries to support “democracy” and “freedom”, which may induce groups of the population to betray their interests. As a consequence, the precarious social situation may persist unchanged, or may experience deteriorations. Acemoglu and Robinson (2008) have pointed out that the expansion and consolidation of democracy in Latin America in the last decades has not been accompanied of an improved capacity of the state to mobilize domestic fiscal resources and to establish social policies, given that despitethe surge of de jure institutions, factual power in the hands of economic groups still can determine the trajectory of the state. As well, there exists a possible scenario in which a segment of the population opts to vote in an election against the incumbent government, so as to “punish them” or “teach them a lesson”, as in a flair of “machismo”, ignoring the real possibility that, actually, it is contributing to the victory of a government that would not attend the needs of the poor and would curtail social investments. This would be the case of unknowingly self-inflicted wounds incurred by the population.
It was shown on graphs 3 and 4 that increasing taxation and consequently supporting additional expenditures in social services, increases trust in government, economic growth and political stability. It is encouraging that populism, a model that seeks to increase the supply of social public goods, and which traditionally has been viewed with derogatory terms in the media and in fake news, is being nowadays recognized as a good economic policy (Rodrik, 2018).
There may exist a vicious circle in some Latin American countries whereby inequality gives rise to persistent political and social instability. Education is the variable that contributes to lessen inequality (Martner and Gonzalez, 2011) and thus would increase trust in government, but the financing of the expansion of education is inhibited by the opposition to increase tax revenues exerted by the high income groups. Thus the economy remains in a perverse equilibrium of low tax revenues, low social expenditures, political instability, violence and persistent inequality.
It was shown that low levels of social expenditures undermine trust in government; in this context, if the population expresses discontent and social frictions ensues, this phenomenon should not be interpreted as a “conspiracy” against “democratic values”; it represents the response to a political system that does not deliver. In the absence of solutions to their demands, groups of citizens may organize violent actions that may eventual undermine democracy. It has to be stressed that there is evidence that the supply of social services is an important determinant of social peace (Justino and Martorano, 2018; Taydas and Peksen, 2012).
A special case may occur when racism is prevalent in a country. Racism is an obstacle to trust as it hinders communication among citizens, thus leading to a fragmented society, one without a common shared view of the future. There is evidence that that inthe US racism is the cause of the opposition to increase taxes, so as to limit the access to the social safety net by ethnic minorities (Roemer and Lee, 2004). Thus racism and prejudice can be seen as blocks to the development of an inclusive society where every citizen is valued on the same terms, without regard to gender, religious creed, age, without discrimination to persons with disabilities or with sexual orientation different from that of the majority, and without discrimination in terms of place of residence or color of skin. An implication is that trust in government, and governance in general, should be analyzed taking into consideration all ramifications that emanate from racism, particularly in the context of the exchange of political supportto the incumbent government in gratitude of racist policies.
If Latin American countries are going to consolidate democracy they must give the highest priority to the execution of a social policy that promotes the expansion of public goods to all member of society in equal quantity and quality, to comply with the mandate that human rights of all citizens must be attended to without discrimination, and to exalt life and reject death, so that all citizens can say:
Free at last! Free at last!

