


 nueva página del texto (beta)
 Inglés (pdf)
 Artículo en XML
 Referencias del artículo
 Enviar artículo por email
 Citado por SciELO
  Similares en
SciELO
Similares en
SciELO 
 Permalink
1. Introduction
Much research has been done to examine the relationship between the spot exchange rate and stock price in various economies. Most of the findings state that when the value of the local currency depreciates compared with major currencies, such as the dollar, euro or pound sterling, the local stock market will increase. The decreasing of the local currency value boosts firm competitiveness through a greater export, which increases their cash flow, projects and debt level; such increases enhances the value of the firm (Josep, 2002) and, thus, raises the stock prices. On the other hand, the portfolio explanation argues that an increase in stock prices induces investor demand for more domestic assets, which appreciates the local currency. This relationship implies that share prices and the exchange rate are negatively related (Yau and Nieh, 2006).
Empirical studies on political cycles, which have primarily been conducted for the United States, find that elections also affect stock market performance. Previous studies have shown that returns on stock tend to increase during the last two years of a presidency compared with the first years (Umstead, 1977; Allivine and ONeill, 1980; Huang, 1985). Recent studies have shown that the performance of stock returns of American companies is typically better under a Democrat than Republican government (Gärtner and Wellershoff, 1999; Santa-Clara and Valkanov, 2003). Evidence for Latin America is scarce. Work by Bonilla et al. (2013) considers the importance of the presidential candidate’s characteristics for Chile in 2010. In this regard, the Mexican case is interesting due to the change in the ruling party during the period analyzed.
This research examines the political cycle in Mexico and the non-linear relation between the stock returns and the exchange rate. In particular, we show that the relationship between these financial variables is influenced by the governing coalition.
On the other hand, international studies, (Aggarwal, 1981; Yang and Doong, 2004; Mishra, et al., 2007) show a relationship that originates in the exchange rate and is transmitted to the stock market or vice-versa; however, the direction of such variables is unclear (Yau and Nieh, 2006). This relationship has been studied with two time-series methodologies, autoregressive vectors and/or Granger causality, to detect a unidirectional or bidirectional relationship in either developed or emerging economies in Asia and Latin America, see, for instance: Abdalla and Murinde (1997); Ajayi et al. (1996); Granger et al. (2000); Doong et al. (2005), Pan et al. (2007); Guzmán et al. (2007); Agrawal et al. (2010); and Diamandis and Drakos (2011).
Typically the common used methods are primarily linear models; however, several studies propose a non-linear dependence. The first non-linearity studies on economics and finance include Brock (1986) and Hsieh (1989a,b) and Scheinkman and LeBaron (1989 a,b). The number of studies has grown in recent years; see, for instance: Brock et al. (1987); Brock et al. (1996); Hinich (1982); Hinich and Patterson (1985); Hsieh, (1991); Abhyankar et al. (1995); Opong et al. (1999); Kosfeld and Robé (2001); Cajueiro and Tabak (2004); Lim (2007); Ammerman and Patterson (2003); Antoniou et al. (1997); Panagiotidis (2005); Lim and Hinich (2005); Bonilla et al. (2006); Romero-Meza et al. (2007); Hinich and Serletis (2007); Lim and Brooks (2011); Serletis et al. (2012).
Previous studies have shown episodic non-linear univariate dependence in various financial markets and for various economic and financial time series; however, multivariate non-linear dependence has been less studied, even fewer investigations have been conducted on emerging markets. To the best of our knowledge, multivariate non-linear dependence has not been studied for the exchange rate and stock market returns in an emerging economy, such as in Mexico, nor has the impact from the political cycle on such financial variables been investigated.
The classical model for a time series assumes that errors are independent and identically distributed (i.i.d.) with first- and second-order moments. Non-compliance with this condition can yield causality because such assumptions are difficult to realize for higher-order non-zero probability distributions or asymmetries during certain time periods.
The number of applications for non-linear methodologies has recently increased due to the role of these approaches in detecting false linear causality. The various advantages for such applications over linear methodologies include non-parametric calculations. Thus, specific probability distributions are not used to explain causality or to eliminate negative and positive effects from independent variables on the dependent variable (Diks and Panchenko, 2006; Bekiros and Diks, 2008; De Gooijer and Sivarajasingham, 2008; Anoruo, 2011; Marinazzo et al., 2008; Bai et al., 2010; Laloux et al., 1999; Plerou et al., 1999; Sharifi et al., 2004; Wilcox and Gebbie, 2007; Nakayama and Iyetomi, 2008; Conlon et al., 2009; Tóth and Kertész, 2005; Altay, 2003).
A relatively recent and less-explored methodology is the cross-bicorrelation test between variable pairs (financial and non-financial type) to detect a non-linear dependence between two series and discern lead/lag relationships between such variables (Brooks and Hinich, 1999; Czamanski et al., 2007; Serletis et al., 2012). This test is a multivariate extension of Hinich’s (1996) bicorrelation statistic, which is aimed at detecting non-linear characteristics in pairs of series. The method proposed herein can detect any form of third-order non-linear dependence between two series; thus, it is an additional methodological tool for investigating Granger-type causality from a non-linear perspective. This paper analyzes time series using this recent methodology, cross-correlation and cross-bicorrelation, which facilitates identification of the potential causal relationships for different periods throughout the series.
For the exchange rate and stock returns in Mexico for the full period available (01/03/1994 - 10/29/2012), we study the non-linear dependence between variables (cross-bicorrelation method developed from Brooks and Hinich, 1999). Therefore, identifying such non-linear dependence would allow us to question the market efficiency hypothesis; it also supports the need to generate new predictive models because the traditional linear models do not consider such dependence. Moreover, we applied this model to three time sub-periods of the full sample that do not overlap to find patterns with the political cycle (three government administrations) in Mexico.
The Mexican case is interesting because it is a medium-size emerging economy that also depends on the United States due to its geographic location and trading volume. Additionally, over the past 18 years, the ruling party in Mexico has been changed. In the past, the currency often depreciated with each change in government. However, each entering party has encountered different challenges, producing a stable exchange rate and strengthened the stock market. Thus, this methodology may contribute to the literature on political cycles.
This paper is organized into five sections: section 2 presents the methodology; section 3 provides the data; section 4 discusses the results; finally, section 5 presents the conclusions and acknowledge limitations.
2. Proposed Methodology
We will be concerned with a sample of two stationary series X(t k) and Y (t k) of size N. Each series is divided into small non-overlapping frames (windows) with equal lengths. Here, t is an integer, and k is the k−th window. Both series had joint stationary covariances that are standardized. The hypotheses are as follows: H 0: the series X(t k) and Y (t k) are independent pure white noise, and H 1: the series X(t k) and Y (t k) have the non-zero cross-covariance C XY (r, s) = E[X(t k)Y (t k+r)] or cross-bicovariance CXXY (r, s) = E[X(tk)X(tk+r )Y (tk+s)].
Notice that due to the invariance in C XXY (r, s) = E[X(t k)X(t k+r)-Y (t k+s)] for the fixed permutations in the first two factors, the expected value is the two-lag function, that is, C XXY (r, s) = C XXY (−r, s). If the maximum lag used is L < N, then the primary domain for the bicovariance is the rectangle 1 < r < L, −L < s < L (Brooks and Hinich, 1999).
Observe now that under the null hypothesis, X(t k) and Y (t k) are pure white noise. Therefore, C XY (r) = C XXY (r, s) = 0 for all r, s > 0. We know that a series pair is dependent when the series includes a second or third lag such that C XY (r) 6= 0 orC XXY (r, s) 6= 0 for or a pair of values (r, s), respectively. Therefore, cross-correlation and cross-bicorrelation are as follows:
(1)
(2)
where m = max(r, s).
The cross-bicorrelation can be thought as a correlation between the current value for one series and the prior cross-correlation value between the two series. The sum for the second order case, given in (2), does not include the contemporary term and is generated using the residue from the adjusted autoregressive process to filter the univariate auto-correlated structure such that the contemporary correlations do not produce a rejection. For the third-order analyses, given in (2), we used an estimate of the residuals of a bivariate vector autoregressive model, which includes a contemporary term in one equation. We use the pre-whiting step to eliminate evidence of linear correlation or cross-correlation so that the remaining dependence between the series should be non-linear. Thus, we can show that:
(3)
(4)
(5)
(6)
Under the null hypothesis, let L = N c , 0 < c < 0.5. The statistics for the non-zero cross-correlation and cross-bicorrelation are as follows:
(7)
and
(8)
respectively. These statistics composed sets or compound tests for cross-correlation and cross-bicorrelation (similar to the Ljung-Box Q ∗, which was applied for autocorrelation), where the number of correlations examined is L, and the number of cross-bicorrelations examined is L(2L − 1). According to Hinich (1996), H XY and H XXY are asymptotically χ 2 with L and L(2L − 1) degrees of freedom, respectively, as N → ∞.
3. Data Features
The sample includes the IP C from the Mexican Stock Exchange (BMV, its initials in Spanish) and the Mexican peso/US dollar exchange rate (TC, its initials in Spanish) during 01/03/1994-10/29/2012 with 4,735 observations. We calculate the logarithmic difference in stock prices,
process AR(p); we preferred to choose the better p in accordance with the Schwarz criterion (SC). In contrast to other statistics, the Schwarz criterion is consistent for a particular AR(p) and null hypothesis that generates a linear mechanism (Panagiotidis and Pelloni, 2003). This criterion optimizes lag selection to avoid over-adjustment. This is more robust than the Akaike information criterion (AIC), and, therefore, the model with the lowest SC is selected. Thus, we adjuste each series pair to different types of AR(p) and different bivariate autoregressive vectors, BV AR(r, s), to determine the cross-bicorrelation.
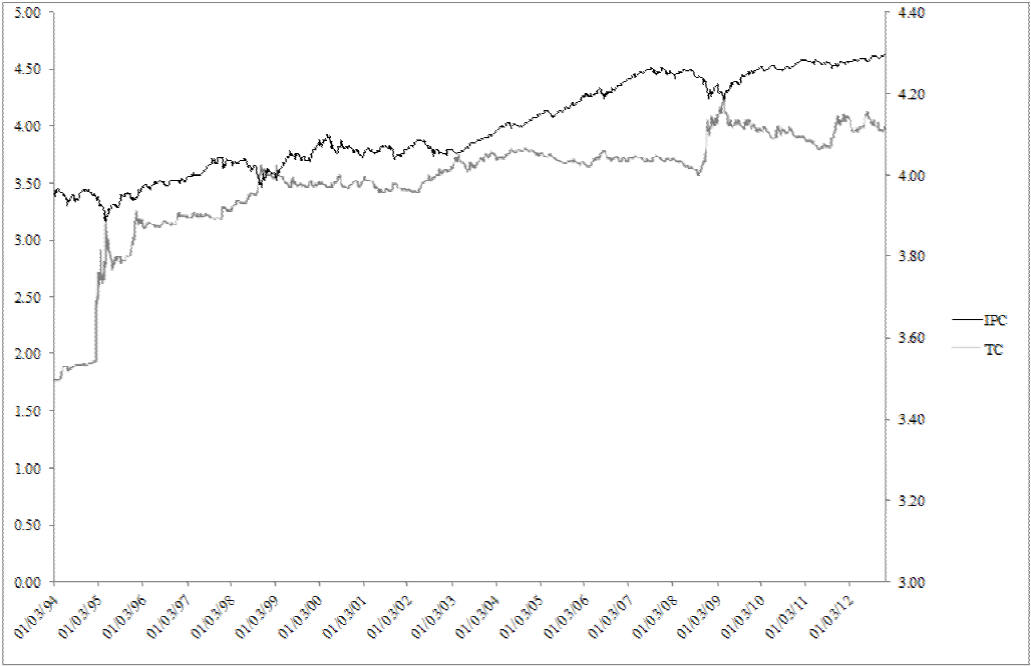
The data was obtained from the Bloomberg database and Banco de México (Mexican Central Bank), respectively. Figure 1 shows the IPC and TC series in logarithmic terms. For certain periods, they show the same behavior, but for others, they show an inverse performance. The aggregate indicates a positive correlation between such variables. Figure 2 shows the performance in logarithmic terms for each series.

Fuente: Elaboración propia en Fortran.
Figure 1 Daily Series for the IPC and TC during 01/03/1994-10/29/2012.
4. Empirical Results
To reject the null hypothesis in (1) in accordance with the test from (2), we analyzed the data series pair. First, we study the series for the entire period; subsequently, the entire series was divided into three periods that correspond to the presidential periods in Mexico, except for the last period, which is incomplete.
The two series are then divided into windows with 25 observations, which generated 189 windows for the entire analysis. The first and second periods have 60 windows, and the last period has 59 non-overlapping windows with c = 0.25, a 0.01 threshold, a first-order autoregressive vector (BV AR)(1,1) for the first three periods and a BV AR(0,0) for the last period (see Table 1).
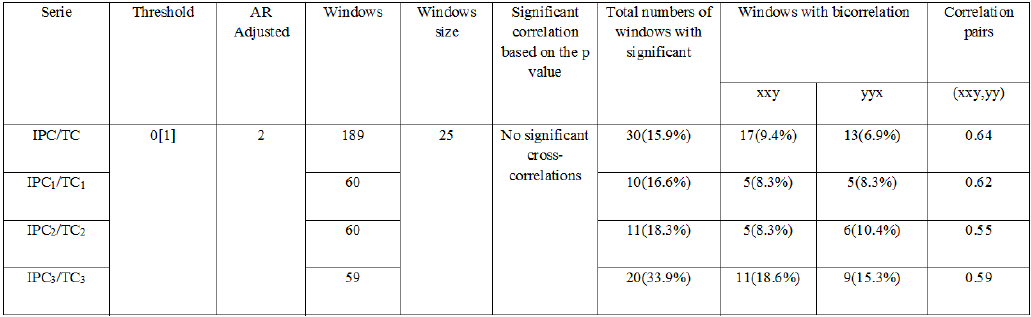
An important result from this study is that we did not detect significant cross-correlation periods for the entire series; we also did not detect such periods for the three presidential periods. However, we did observe periods with cross-bicorrelation, which are indicated in Table 1 column seven. In the same table, column 10 shows the correlation between the cross-bicorrelation pairs, which demonstrates high correlation between the series pair, which primarily indicates a non-linear and bidirectional relationship.
In Table 2, we show the significant windows wherein. We identified multivariate non-linear dependence detected through cross-bicorrelation for the four periods analyzed. We observed a non-linear relationship in the six windows at the beginning of the entire series, but there is one window after two year which was again detected after two year and approximately ten years later and coincided with a decreased IPC and increased TC, as shown in Figure 1.

In the first presidential period, the majority of the significant windows were detected at the beginning of the period, which is similar to the entire series. Period 3 corresponds to the second presidential period and yielded the same performance as the previously analyzed periods, wherein the bidirectional behavior was concentrated at the beginning of the period; a significant window was also detected at the end of the six-year period. Finally, the last six years analyzed did not behave the same as the other periods, wherein the non-linear relationship was concentrated in the middle of the period, which is consistent with the behavior illustrated in Figure 1, showing a decreasing IPC and increasing exchange rate.
The disparate behavior in the final period apparently disrupts the political cycle detected and may be due to substantial external factors, such as the subprime crisis.
5. Conclusions
Herein, we investigated the non-linear relationship between the exchange rate and stock market return for Mexico for the entire sample during 1994-2012 and the three sub-periods, wherein the ruling party changed. We expect that this methodology can be used for empirical studies on political cycles and market efficiency because it considers elements that were previously not considered, such as multivariate non-linear dependence and a window-base investigation. Based on such considerations, we can discern statistically significant similarities and differences for such series. This methodology is recent (Brooks and Hinich, 1999) and has not been used for economic series in emerging markets; furthermore, it facilitates analyses for specific time windows, which provides information that is otherwise unavailable from other methods.
The results indicate a non-linear relationship detected through a significant cross-bicorrelation for distinct periods; though, there are no significant periods with cross-correlations. This cross-bicorrelation is high and exceeds 55%, which allowed us to search for periods with correlation between (XXY, Y Y X), and we detected periods with a non-linear relationship regardless of the ruling party.
For the first presidential period studied, which corresponded to the government controlled by the Institutional Revolutionary Party (PRI, its initials in Spanish), the bidirectional non-linear periods were at the beginning and end of the six-year period, which was consistent with the behavior during the subsequent presidential period; although, the ruling party was changed to the National Action Party (PAN, its initials in Spanish). However, during the last presidential period investigated, we detected significant windows towards the middle of the term; we speculate that this disparate behavior was due to the United States mortgage crisis.
Our results are consistent with previous studies on non-linearity, which are primarily univariate, such as Bonilla et al. (2006, 2011), Romero-Meza et al. (2007), Panagiotidis and Pelloni (2003) and Coronado and Gatic, (2011). For Latin American countries, few investigations have empirically studied political cycles, except for Bonilla et al. (2013). The method used herein facilitates such studies through the aforementioned new dimensions.
It would be interesting to study the political and economic causes for the cross-non-linear events more in-depth. This paper can be extended to consider a United States stock market index, such as the S&P500, given the geographic proximity and high interdependence between Mexico and the United States.
The results herein have implications for the empirical models that are typically used for such studies because traditional models may not adequately represent the data in which cross-non-linear dependence episodes are detected. For non-linear dependence, we can consider procedures that may use the dependence detected and to design investment strategies that exceed passive strategies, such as buy and hold. Furthermore, it would be interesting to study additional emerging markets with government changes to discern multivariate non-linear dependences and, if such dependencies are detected, whether they occur at similar times in different markets. Ideally, one could initially investigate the Latin American markets because the majority of such countries are relatively young democracies subject to political and economic whims.
Additional research in this area may include specific economic sectors, such as the tradable and non-tradable sectors, or specific industries; we expect that the relationship between the exchange rate and stock market returns differs depending on the type of economic activity. Likewise, specific companies could also be studied. These extensions could improve predictive models and portfolio assignments for institutional investors.

