


 nueva página del texto (beta)
 Inglés (pdf)
 Artículo en XML
 Referencias del artículo
 Enviar artículo por email
 Citado por SciELO
  Similares en
SciELO
Similares en
SciELO 
 Permalink
1. Introducción
For some investors, sustainability is an issue when making investments. In many countries, including Mexico, an increasing proportion of investment wealth comes from pension funds, with the result that employees have become the main investors in some companies and sustainable considerations come into play when making investments (EIRIS, 2010). More organizations have social and environmental responsibility in their agendas not only for altruistic reasons, but because it makes business sense: sustainability can result in improved processes with lower costs, higher acceptance of company products among customers and better management with the use of adequate corporate governance practices.
This article has two main objectives: a performance analysis of the stocks in the Mexican Sustainable Index (MSUI) of the Mexican Stock Exchange and the index itself and how their returns are sensible to market, value, size and momentum factors.
1.1 Sustainability and Economic Performance
Two views dominate the literature on sustainability and economic performance: the traditional neoclassical economist view and the revisionist view. The traditional neoclassical economist view argues that the main purpose of environmental regulation is to correct for negative externalities. Therefore, environmental considerations are costly to firms, otherwise, they will correct them by themselves, see, for example, Luken (1997) and Clift and Wright (2000). The revisionist view argues that sometimes improved environmental performance is the source of competitive advantage because it can lead to more efficient processes, lower compliance costs and new market opportunities; see, for example: Porter (1991), Gabel and Sinclair-Desgagné (1993), Porter and van der Linde (1955) and Sinclair-Desgagné (1999). There is an extensive literature on sustainability and economic performance, both empirical and theoretical; see for example, Porter (1991), Valencia-Herrera (1996), Schaltegger and Synnstvedt (2002), Wagner et al. (2002) and Wagner (2003). In empirical studies, no single conclusion has prevailed so far. Methodological issues, such as lack of statistical data or its low quality, surround many of these studies; see Wagner and Schaltegger (2003).
1.2 The Mexican Sustainable Index
The Mexican Sustainability Index (MSUI) was launched by the Mexican Stock Exchange in 2010. MSUI member firms are selected through an evaluation process by two fully-independent qualifying institutions: Empowerment Responsible Investment (EIRIS), and South Anahuac University. EIRIS is headquartered in London and has a deep background on the FTSE Sustainability Index. South Anahuac University is a Mexican educational institution, which participated in the building of the Index. The qualification process is based on three pillars: environmental, social, and corporate governance. For the environmental pillar, the analyzed company is compared to different metrics depending on the sector it belongs to. Then, the impact the company generates to water, air, waste, biodiversity and climate change is analyzed and each of these impacts is weighted according to the sector the company belongs to. Lastly, the company is studied by its environmental policies, management systems, and reporting. For the social pillar, the company is analyzed by how it interacts with its stakeholders, mainly its employees on equal opportunities, health and safety, and security in their job environment. And for the corporate governance pillar, the analyzed company is required to have an ethics code and to explain how they are implementing it. Additionally, the company must be assessed by their Board of Directors on the company's environmental, social, and ethical issues.
At its beginning, the MSUI comprised twenty three companies: Alfa, América Móvil, Arca Continental, Cemex, Coca-Cola Femsa, Banco Compartamos, Controladora Comercial Mexicana, Corporación Geo, Desarrolladora Homex, Empresas ICA, Fomento Económico Mexicano, Grupo Aeroportuario del Centro Norte, Grupo Aeroportuario del Sureste, Grupo Bimbo Grupo Financiero, Banorte, Grupo México, Grupo Modelo, Industrias Peñoles Kimberly-Clark de México, Mexichem, TV Azteca, Urbi Desarrollos Urbanos, Wal-Mart de México (BMV 2011).
Worldwide, there is a broad family of sustainable indexes, e.g. the Dow Jones Sustainability, the FTSE 4Good and the Domini Indexes. The modern era of sustainable indexes begun with the Dow Jones Sustainability Index, created in 1999, for the United States. ABM AMRO proposed the Brazilian Ethical Fund Index in 2001. The JSE Socially Responsible Investment Index of the Johannesburg South Africa Exchange was proposed in 2004 (Sonnenberg and Hamann, 2006). Bovespa launched the Managerial Sustainability Index (ISE) in 2007 (Reis-Machado et al., 2009). The MSUI, proposed in 2010, is the first Mexican Sustainable Index.
1.3 Sustainable Indexes Performance
The evidence on the performance of sustainable indexes is mixed; see Kurtz and Di Batolomeo (1996), Sauer (1997), Di Bartolomeo and Kurtz (1999) and Statman (2000); in particular, see Garz et al. (2002), for the performance of the Domini 400 Social Index, Consolandi et al. (2009), for the performance of the European Dow Jones Sustainability Stoxx Index (DJSSI), and Shröeder (2003), for a performance analysis of 29 SRI equity indexes. For example, Di Bartolomeo and Kurtz (1999) noticed a slightly out-performance of the Domini 400-index over a benchmark with higher risk. In Gartz et al. (2002), there is a slightly higher return of the DJSSI index over the DJ Stoxx 600 index. On the contrary, Shröeder (2003) noticed a slight underperformance of the DJSSI with respect to a benchmark. Some sustainable stocks offer a higher return, but with a higher risk than a benchmark, as in Consolandi et al. (2009), for a portfolio screened with the DJSSI. Others offer similar risk-adjusted returns to benchmarks, although many of them exhibit higher risk, as in Shröeder (2003), for SRI stock indexes.
Social and environmental factors can have different effects on stock performance. In Rennings et al. (2003), higher environmental performance has a significantly positive effect on stock performance, but higher social performance has a negative effect. However, at the sector level, these effects cancel out. Sustainability performance within a sector does not make a difference on shareholder value. For example, the Bovespa ISE had similar profitability to other Brazilian indexes from 2005 to 2007 (Rezende et al. 2007; Reis-Machado et al., 2009) and the business performance of the companies in the DJSSI and a sample of companies in the Global Dow Jones Index (GDJI) are similar in the analyzed period (López et al., 2007).
1.4 Factor Return Models
The Capital Asset Pricing Model (CAPM, Sharpe 1964, Lintner, 1965), which considers only one market risk factor, usually measured by a Stock Exchange Index, can be adjusted for additional systematic risk factors like size -small firms required a higher return than large ones (SMB), and book to market ratio (BM), -- firms with a high BM ratio required a smaller return than those with a low ratio (HML), as in the Fama-French Three Factor Model (FFM, Fama and French 1993, 1996, 1998), which provides a higher explanatory power than the CAPM for the US Market. Jegadeesh and Titman (1993) notices a momentum effect component in stock returns, with which Carhart (1997) extends the FFM to the Fama-French-Carhart Four Factor Model (FFCM), which also shows explanatory power improvements over the FFM in the US market. 1
After that, an extensive literature has developed on the application of the FFM and the FFCM and extensions to perform return analysis in diverse stock markets and with different strategies. Examples of return analysis performed on stocks using FFM and FFCM are Drew et al. (2003), on Chinese stocks, Sehgal (2004), on Indian stocks, An-Sing and Shih-Chuan (2009), on stocks of countries in the Pacific Basin markets, Bartens and Hassan (2010), on South African stocks, O'Brien (2010), on Australian stocks, and Lai and Lau (2010), on mutual funds in Malaysia. Other studies test the FFM and FFCM, as in L'Her et al. (2004), on Canadian stocks. An example of an extension of the FFM is Hou and McKnight (2006) study, which introduced an analyst coverage variable and analyzed UK stocks. There are also a number of studies with analysis of strategies, for example, Arshanapalli et al. (1998), Brennan (1998) and Archenapelli (2007), on value and growth strategies in the US and Blitz and Van Vliet (2008) on value and momentum strategies in a global tactical asset allocation. For Mexican stocks, Fama and French (1998) and Rouwenhorst (1999) analyzed returns using FFM and FFCM models. Grandes et al. (2010) extended the analysis to consider fluctuating betas using a Generalized Method of Moments (GMM) method.
1.5 The FFM and FFCM Models
Using a statistical regression, the FFM can be estimated as follows

where:
Rj,t = the nominal risk-free rate during time period t , in here, the monthly yields on 28 day CETES, αj = the intercept, βj,i i = 1, · · ·3 = the factor betas for each of the three risk factors, εjt = the residual excess return on portfolio j during time period i , Rm,t −Rf,t the market risk premium factor, the difference between the return on a market index Rm,t , in here, the Mexican Stock Exchange Index (MEXBOL), and Rf,t, SMBt = the return during time t of a long position on the equally weighted portfolio of the lower thirtile of stocks in capitalization at the beginning of t and a short position on the equally weighted portfolio of the higher thirtile of stocks in capitalization at the beginning of t, HMLt = the return during the time period t of a long position on the equally weighted portfolio of the higher thirtile of stocks in BM ratio at the beginning of t and a short position on the equally weighted portfolio of the lower thirtile of stocks in BM at the beginning of t.
The FFCM adds the momentum effect factor (MOMt ) as follows:

where  the return during time
  of a long position on the equally weighted portfolio of the higher thirtile of stocks in return during the time period
  and a short position on the equally weighted portfolio of the lower thirtile of stocks in return during the time period .
The dataset is from Economatica and covers 201 publicly traded firms from the Mexican Stock Market from December of 1999 to March of 2011. Eleven companies with less than ten monthly price observations were omitted, for a total of 190 analyzed stocks. Monthly and yearly returns, monthly price to book value ratios and monthly capitalizations were estimated. Then, Market, SMB, HML and MOM factors were calculated. An analysis of stocks in an out of the initial MSUI and the index itself followed.
2. Analysis and Discussion
2.1 Stocks in the MSUI
Stocks in the initial MSUI were in thirteen of the seventeen Economatica industrial sectors, with exception of the agricultural and fisheries, the electric-electronic, the industrial machinery and the textiles sectors, see Table 1.
Table 1 also shows the average monthly company returns by sector from January 2000 to March, 2012. Over all, the highest sector returns were observed in the mining and the telecommunications industries, 3.2% and 3.1%, respectively. The lowest sector returns were negative, in the electric-electronic and textiles industries, -0.2% and -0.1%, respectively. In the MSUI index, the highest average sector returns were in the mining and the chemical industries, 2.5% and 2.4%; the lowest were in the other and the paper and pulp industries, 0.5% and 0.7%, respectively.
The MSUI was less volatile than the MEXBOL, but it also offered less return than those indexes from December, 1991 to March, 2012, see Figure 1. The MSUI offered less return with less risk than the MEXBOL. The MSUI and MEXBOL offered, respectively, a yearly average return of 12.7% and 20.0% with a yearly standard deviation of 22.8% and 26.2% in the period. An equally weighted index with stocks from the MSUI offered slightly more return with less risk than the MSUI, 12.9% of yearly return with a standard deviation of 21.3%.
In the period January, 2000 to March, 2012, the mean monthly company returns of a sustainable company were very similar to the ones from others, 1.6% and 1.4%, respectively. In particular, two equally weighted portfolios, one with stocks in the MSUI and another with those outside the Index, had statistically similar returns because the difference in the mean of the returns was not statistically different from zero; the t value was 0.67 with 9,845 degrees of freedom. Nevertheless, their risks were different. The average standard deviations for the sustainable companies (0.158) were lower than the one for non-sustainable ones (0.300). The hypothesis that the variances of the stock returns are equal in and out the MSUI is rejected. The F statistic is 3.62, and the critical F value is 1.04 with 29,116 and 4,337 degrees of freedom. The F test assumes normality, which cannot be given as granted. The Brown and Forsythe (1974) and the Levene (1960) tests of equality of variances are more robust to deviations from normality. These statistics were 29.66 and 16.38, respectively, which correspond to a probability of cero for a null hypothesis of equality of variances.
Table 1 Monthly Return by Industry, overall, in and the out the MSUI, January of 2000 to March of 2012

The result of similar returns with lower risk contrasts to the results found elsewhere for sustainable stocks; for example, Consolandi et al. (2009) found a similar return with higher risk for a portfolio of stocks screened with the DJSS and Shröeder (2003) found similar results for SSI stock indexes. The result can be explained, for example, if, in the MSI, environmental stocks dominate over social stocks, see Rennings et al. (2003)

2.2 Factor Stock Analysis
Table 2 shows the mean and the standard deviation of the betas for a fourth factor FFCM model with market premium, P/B yield, market capitalization and momentum of one year factors. The mean of the betas for the market premium was statistically different from cero for all the companies, the MSI companies group and the non-MSI companies group. The mean of the betas for the P/B factor was statistically different from cero for the total of companies and the non-MSI companies. For the MSI companies, the mean of the betas for the momentum factor was statistically different from cero at the 90% significance level 2 and the beta for the momentum factor was different from cero at 95% significance level. The difference in the means of the betas for the MSI companies and the non-MSI ones was statistically different from cero for the market premium and market capitalization factors. The mean contributions on stock returns of the market, value and size factors in a three factors FFM were similar to those obtained with the four factors FFCM, already discussed.
Table 3 shows the number of companies in which the beta of a factor was statistically different from cero at 95% for the four factors FFCM. For all companies, the factor with higher frequency of significant betas was the market premium (54.3%), followed by size (18:9%), momentum (16.8%) and P/B (10.5%). A higher proportion of companies in the sustainable index were statistically sensible to the P/B factor than overall (17.3% vs. 10.5%), but a lower proportion were sensible to the momentum factor (0% vs. 16.8%) and the market cap (17.3% vs. 18.9%). The proportion of market premium betas that were statistically different from cero was higher for the companies in the sustainable index than overall (87.0% vs. 54.2%), see Table 3.
Table 2: Factor Betas of an Equally Weighted Portfolio in a FFCM Fourth Factor Model.

Betas were estimated for the total of 190 companies, the 23 companies in the MSI and the 167 outside the MSI using the FFCM. The mean of the betas is in the first row for each factor. The standard deviation of the resulting betas is below in a parenthesis. Mean is statistically different from 0 at 95%**.90%*. (l)Ho: b(MSI)-b(non-MSI) = 0, probability ofHo in parenthesis.
Table 3 shows the number of companies in which the beta of a factor was statistically different from cero at 95% for the four factors FFCM. For all companies, the factor with higher frequency of significant betas was the market premium (54.3%), followed by size (18:9%), momentum (16.8%) and P/B (10.5%). A higher proportion of companies in the sustainable index were statistically sensible to the P/B factor than overall (17.3% vs. 10.5%), but a lower proportion were sensible to the momentum factor (0% vs. 16.8%) and the market cap (17.3% vs. 18.9%). The proportion of market premium betas that were statistically different from cero was higher for the companies in the sustainable index than overall (87.0% vs. 54.2%), see Table 3
Table 3: Number of Stocks in which the Factor Beta is Statistically Significant at 95% in a Four Factors FFCM

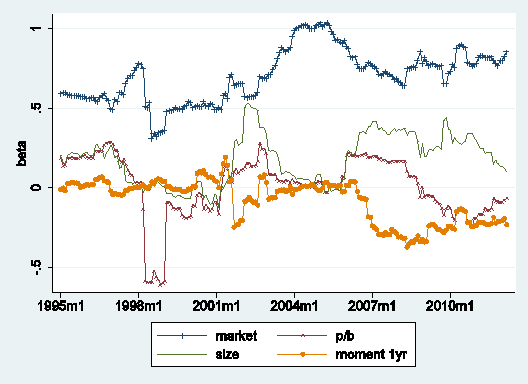
Betas were not stable through time. Using the FFM, running monthly betas were estimated on rolling windows of 36 months from January, 1995 to March, 2012, see Figure 2. Even though, the market betas were consistently positive, they showed a wide variation: their graph showed a throttle in September, 1998 (.31) and peaks in June, 2004 (1.02) and March, 2011 (0.98). The values of the P/B betas also fluctuated, but they were almost always positive; except for the period from March, 1998 to May, 2001. The graph for the size betas also shows fluctuations and positive and negative values. The betas were positive, except for two periods: November, 1997 to July, 2001 and from June to October, 2005, with peaks in May, 2002 (0.54) and December, 2008 (0.44), see Figure 2.

Figure 2: Running factor betas for the MSUI Index in the FFM estimated with information of the previous 36 months.
Betas were not stable through time. Using the FFM, running monthly betas were estimated on rolling windows of 36 months from January, 1995 to March, 2012, see Figure 2. Even though, the market betas were consistently positive, they showed a wide variation: their graph showed a throttle in September, 1998 (.31) and peaks in June, 2004 (1.02) and March, 2011 (0.98). The values of the P/B betas also fluctuated, but they were almost always positive; except for the period from March, 1998 to May, 2001. The graph for the size betas also shows fluctuations and positive and negative values. The betas were positive, except for two periods: November, 1997 to July, 2001 and from June to October, 2005, with peaks in May, 2002 (0.54) and December, 2008 (0.44), see Figure 2.
Betas in the FFCM also fluctuate. The betas for the MSUI index in this model estimated in a rolling 36 months window showed similar patterns to the ones in the FFM for the the market beta, the P/B beta and the size beta, see Figure 2 and 3 . The one year momentum beta was weaker than the other ones and often negative. The beta was lower than -0.2 in two periods: the period between September, 2001 and January, 2002 and after January, 2007. It never became larger than 0.2. The largest beta was on May, 2001 (0.192). A negative momentum beta, however weak, is consistent with a possible mean reverting process for stocks, see Figure 3.
3. Conclusions
The MSUI is a diversified index, with stocks from fifteen of the seventeen Economatica industrial sectors at is beginning. It was less volatile than the MEXBOL, but it offered a lower average monthly return in the period from January, 1995 to March, 2012. The index had a lower return with higher risk than an equally weighted portfolio of the same stocks in the analyzed period.
Average monthly returns on an equally weighted portfolio of stocks in the beginning MSUI was statistically no different from the average monthly returns on a portfolio of non-sustainable ones and risk was statistically lower in a portfolio of MSUI stocks than in one of non-sustainable ones in the analyzed period.
In a FFCM, the average market beta for an equally weighted portfolio of MSUI stocks was higher than the ones of non-MSUI stocks and of the all Mexican Stock Exchange stocks in the analyzed period. In an equally weighted portfolio, the beta for the price to book ratio factor was statistically different from cero for all stocks in the Mexican Stock Exchange. The betas for the market capitalization factor and the one-year momentum factor were statistically different from cero in an equally weighted portfolio of MSUI stocks. The beta for an equally weighted portfolio of stocks in the MSUI was statistically different from one with the stocks out of the index. The price to book ratio beta and the market capitalization beta on an equally weighted portfolio of MSUI stocks were statistically different from cero. The proportion of stocks in the MSUI which was statistically sensible to the market premium factor was higher than the one on stocks out of the index.
The factor betas for the MSUI index are dynamic. Under the FFM and the FFCM, with a 36 month sliding window, the market betas were higher in the 2004 year and after January, 2010. The size betas were higher in 2005 and 2010. The betas for the price to book factor were sometimes positive or negative; but they were usually small. In the FFCM, the betas for the moment factor were almost cero from January, 1995 to March, 2007, when they became negative. The understanding of the beta dynamics may warrant further study.

