


 nova página do texto(beta)
 Inglês (pdf)
 Artigo em XML
 Referências do artigo
 Enviar este artigo por email
 Citado por SciELO
  Similares em
SciELO
Similares em
SciELO 
 Permalink
Introduction
Neural aging is accompanied by structural and functional transformations in the nervous system1-4. Therefore, to characterize brain morphology and its association with age- and sex-related development, function, and neurodegenerative processes in healthy humans, as well as local morphological alterations found in psychiatric disorders and neurological diseases is crucial for the development of modern neuroscience5-7. This fact becomes more relevant if one takes into account that more and more people reach more advanced stages of life, where the risk of suffering from neurodegenerative diseases4. These represent a serious health problem and there are still obstacles that hinder their correct differentiation2,3.
In recent years, efforts have focused on the development of segmentation methods for computed tomography (CT) images4,8, but often a large number of features are involved, many of which are redundant or irrelevant. The selection of attributes or selection of characteristics seeks to solve the problem of the dimensionality of the information8. Within the framework of this study, a texture analysis is delivered under the category of recognition of homogeneity patterns, in a way that is sufficiently appropriate to discriminate to which class it belongs.
In our environment, although CT is widely used in the clinical setting, automatic segmentation methods are not available to estimate ventricular volume. Due to the above, the present work is carried out to determine the volumetric of the lateral ventricles and to identify the effect of age on these structures and its possible use as a quantitative biomarker of cerebral atrophy, through an automatic processing of texture indices homogeneous.
Materials and methods
Population
The population consisted of 320 patients, including 160 men, grouped in the age ranges of 34 years and under (1.9%), 35-44 (23.1%), 45-54 (25.0%), 55-64 (25.0%), 65-74 (19.7%), and 75 and over years (5.3%) who presented normal neurocognitive functions, evaluated through the mini mental status examination. The volunteers included presented a previous indication for head CT and attended the imaging service of the Saturnino Lora Torres Hospital. Their results were reported as negative for the presence of any old or recent disease of ischemic or vascular origin, or any structural brain alteration. Patients with a confirmed diagnosis of neurological and psychiatric diseases, a history of traumatic brain injury due to accidents, the presence of risk factors that have a known effect on the brain structure in the course of degenerative diseases, family-type neurocognitive disorders, schizophrenic disorders were excluded, pregnancy, as well as the presence of cognitive impairment.
Bioethical considerations
Authorization was requested and approved by the scientific council of the institution and by the ethics committee of each health institution involved in the development of the research. Participation in the study was carried out under the principle of voluntariness. The volunteers received prior clinical indication for a head CT, in the absence of neuropsychiatric manifestations. We accepted the ethical principles for research in human beings, this under the Declaration of Helsinki in force in Cuba.
Data processing and analysis
Ventricular volumetric reconstruction was obtained from a segmentation method based on the analysis of homogeneous textures and the Bicubic interpolation technique, using the gray level co-occurrence matrix (GLCM), also known as the gray level spatial dependence matrix.
Assessment instrument (of global cognitive functioning)
All the volunteers were given the mini mental status exam (MEEM) standardized and approved for the Cuban population6.
CT technique procedure
The CT scanner used in this study was SIEMENS, single slice. Each patient had between 18 and 22 cuts with a thickness of 5 mm in this study. The size of the matrix of each segment was 512 × 512 pixels and the pixel size was 0.426 mm with a gray level of 16 bits.
Morphometric estimation method of the cerebral ventricle
In this study, the technological tool iMagis, indigenous to Cuba and certified for use by the National Center for the Registration of Medical Equipment of the Cuban Ministry of Public Health, was used. Widely spread and used in radiology services in the country9, with a more updated version called NeuroiMagis, which allows three-dimensional reconstructions and morphometric calculations through the recognition of homogeneity patterns through texture analysis.
For morphometric estimates, an interactive segmentation method with three phases was implemented: pre-processing, feature extraction, and feature selection.
Pre-processing
The initial stage was the conversion of the image to a gray scale level. In the second step, the existence of noise and artifacts in the image was eliminated using the anisotropic diffusion filtering technique10,11 (Fig. 1).
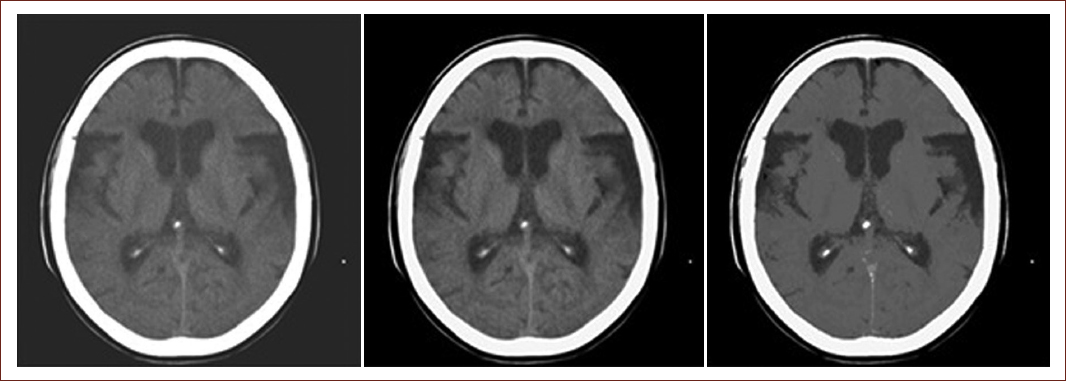
Figure 1 Image pre-processing to reduce the noise level. The image on the right shows a tomography slice of a simple skull. The image in the center is the result of the application of anisotropic diffusion filters. The image on the left is the result of applying homogeneity-based segmentation during the pre-processing stage. Source: Collection of images in DICOM format from the Imaging Department of the Saturnino Lora Torres Provincial Hospital.
Feature extraction
Automatic texture feature extraction was performed, based on the GLCM, where the image was automatically divided into K clusters by estimating features of homogeneity obtained from a Co-Occurrence matrix12,13 (Fig. 2).
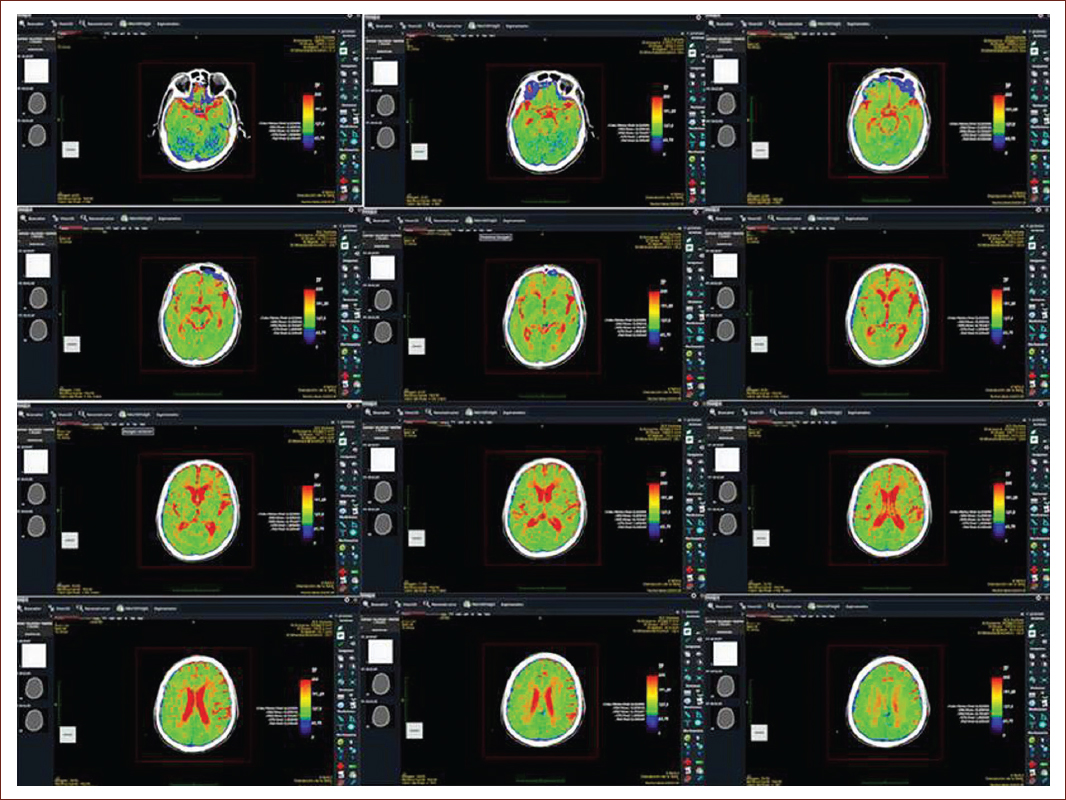
Figure 2 Recognition of homogeneity patterns through texture analysis in tomography slices at different levels of the brain.
It is not necessary to use the window configuration of the classic GLCM approach, all the variability information is obtained from the complete image.
Thanks to the weight factor (1 + (i - j) 2) −1 where i and j describe the intensity values of the ensemble, the homogeneity index obtains small contributions from non-homogeneous combinations observed at the intensity points relative to each other. The result is a low homogeneity index value for non-homogeneous regions and a relatively higher value for homogeneous regions.
Feature selection
The region of interest was segmented by combining texture information with the region growth approach. Finally, to evaluate the accuracy of the proposed approach, the Dice coefficient similarity metric was used14-16 (Fig. 3).
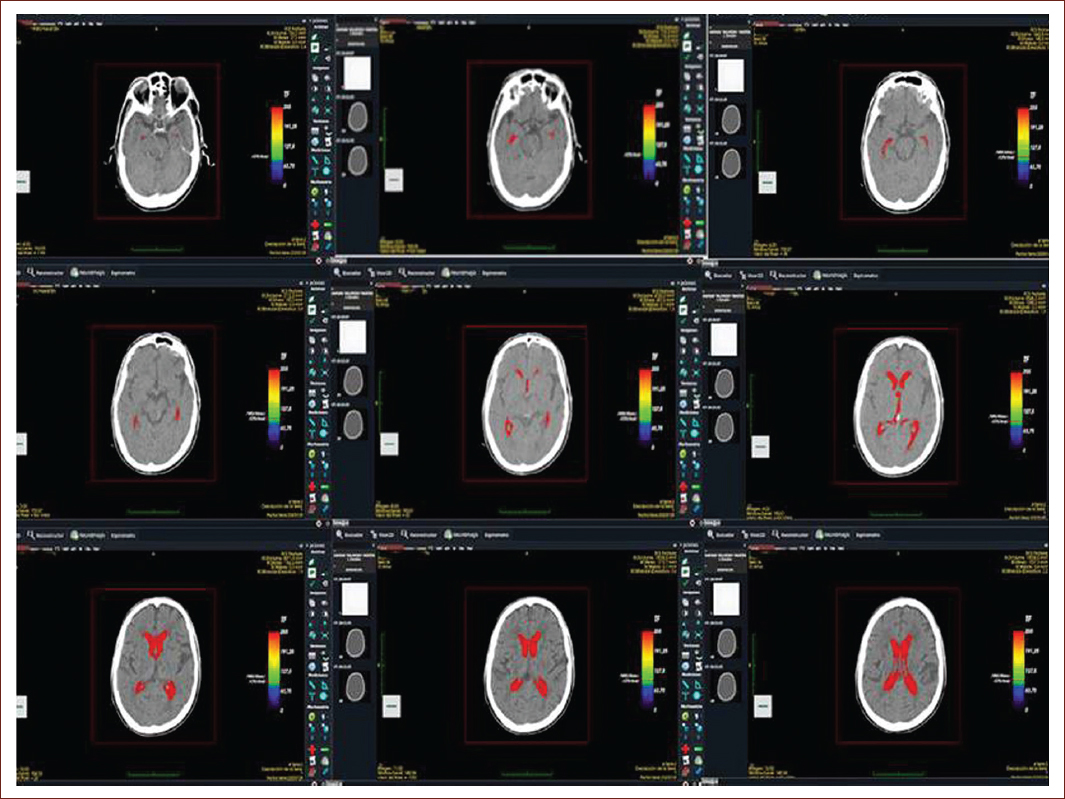
Figure 3 Segmentation of the different parts of the lateral ventricles in the tomography slices at different levels of the brain.
The Dice coefficient measures the degree of similarity between sets, regardless of the type of elements. It is a normalized value that reaches values close to one when the coincidence is great and close to zero when the coincidence between the segmented region and the real one is little. In this investigation, a value of 0.96 was achieved.
Statistic analysis
The volumetric measurements were grouped according to the age group to which the subjects studied belonged and were summarized through the arithmetic mean and standard deviation. Intervals for the mean of 95% confidence were estimated. To identify the possible differences between the age and gender groups, the possible correlation between the dependent variables that measure volumetric was first identified. As there was a very high correlation that denotes multicollinearity, the use of multivariate analysis of variance (ANOVA) was discarded and it was preferred to carry out an ANOVA of a separate factor for each dependent variable. Minitab® 19.2 (64-bit) was used as statistical processor.
Results
During the analyzed period, the population consisted of 320 patients who expressed their willingness to participate in the study, of which 50.0% were men, grouped in the age range of 30-75 years and over. 100% of the volunteers presented a previous indication for a cranial CT scan, in the imaging service of the Saturnino Lora Torres Hospital and whose results were negative; they presented normal neurocognitive functions, neuropsychiatric evaluations and negative physical examinations. 17 (36.2%) patients were excluded from this investigation, 10.6% for presenting cognitive impairment, 4.3% with positive neuropsychiatric evaluation, and 21.3% of the volunteers presented positive signs at the time of the neurological system examination.
In relation to the variables analyzed, table 1 shows the values of the mean, standard deviation and the confidence intervals of the volume of the lateral ventricles for each of the age groups. The applied statistical analysis, one-way ANOVA, confirmed that the grouped ages in the selected groups have a significant effect on the total volumetric of the lateral ventricles and on the right and left ventricular volumetric. The comparison of the mean values showed that age has a linear relationship with the total volume of the lateral ventricles. This behavior is also true for the right and left ventricles.
Table 1 Summary measures and effect of age on the right and left lateral and ventricular total volumetric
| Volume (mm³) | Age groups (years) | n | Mean | Standard deviation | Confidence interval for the mean at 95% | F | Sig. | |
|---|---|---|---|---|---|---|---|---|
| Lower limit | Upper limit | |||||||
| Total ventricular volume | 30-34 | 6 | 13078,950 | 4611,936 | 8239,019 | 17918,881 | 20,294 | 0.000 |
| 35-44 | 74 | 15343,951 | 6918,675 | 13741,024 | 16946,878 | |||
| 45-54 | 80 | 17775,595 | 9492,683 | 15663,102 | 19888,088 | |||
| 55-64 | 80 | 22659,375 | 10947,326 | 20223,167 | 25095,583 | |||
| 65-74 | 63 | 30622,462 | 16176,855 | 26548,374 | 34696,550 | |||
| 75 and over | 17 | 38261,735 | 22556,541 | 26664,232 | 49859,239 | |||
| Total | 320 | 21963,713 | 13593,987 | 20468,611 | 23458,815 | |||
| Right lateral ventricle volume | 30-34 | 6 | 6353,100 | 3118,846 | 3080,071 | 9626,129 | 16,979 | 0.000 |
| 35-44 | 74 | 7699,097 | 3836,557 | 6810,239 | 8587,956 | |||
| 45-54 | 80 | 8620,286 | 5020,891 | 7502,942 | 9737,631 | |||
| 55-64 | 80 | 10933,654 | 5766,935 | 9650,285 | 12217,022 | |||
| 65-74 | 63 | 14529,919 | 7624,182 | 12609,794 | 16450,044 | |||
| 75 and over | 17 | 18411,535 | 11137,978 | 12684,915 | 24138,155 | |||
| Total | 320 | 10626,713 | 6717,387 | 9887,917 | 11365,508 | |||
| Left lateral ventricle volume | 30-34 | 6 | 6725,850 | 3115,113 | 3456,739 | 9994,961 | 18,314 | 0.000 |
| 35-44 | 74 | 7644,854 | 3743,307 | 6777,600 | 8512,108 | |||
| 45-54 | 80 | 9155,309 | 4903,864 | 8064,007 | 10246,610 | |||
| 55-64 | 80 | 11725,727 | 5822,659 | 10429,958 | 13021,497 | |||
| 65-74 | 63 | 16092,543 | 10054,891 | 13560,251 | 18624,834 | |||
| 75 and over | 17 | 19850,200 | 12339,580 | 13505,773 | 26194,627 | |||
| Total | 320 | 11337,003 | 7623,610 | 10498,538 | 12175,467 | |||
The posteriori comparative analysis, which is evidenced in table 2, reveals the effect of the ages included in the different age groups on the total and right and left volumetric of the lateral ventricles.
Table 2 Age groups with significant differences according to the posteriori multiple comparison tests
| Volume (mm³) | (I) Age groups (years) | (J) Age groups (years) | Mean difference (I-J) | Typical error | Significant | Confidence interval for the mean at 95% | |
|---|---|---|---|---|---|---|---|
| Lower limit | Upper limit | ||||||
| Total lateral ventricular volume | 34 and under | 65-74 | −17543,5119* | 5089,218 | 0.039 | −34585,711 | −501,313 |
| 75 and over | −25182,785* | 5656,349 | 0.002 | −44124,131 | −6241,440 | ||
| 35-44 | 55-64 | −7315,423* | 1921,197 | 0.014 | −13748,912 | −881,936 | |
| 65-74 | −15278,510* | 2041,956 | 0.000 | −22116,385 | −8440,636 | ||
| 75 and over | −22917,783* | 3203,707 | 0.000 | −33645,996 | −12189,571 | ||
| 45-54 | 65-74 | −12846,866* | 2006,435 | 0.000 | −19565,791 | −6127,943 | |
| 75 and over | −20486,140* | 3181,184 | 0.000 | −31138,931 | −9833,349 | ||
| 55 a 64 | 35-44 | 7315,423* | 1921,197 | 0.014 | 881,936 | 13748,912 | |
| 65-74 | −7963,086* | 2006,435 | 0.009 | −14682,011 | −1244,163 | ||
| 75 and over | −15602,360* | 3181,184 | 0.000 | −26255,151 | −4949,569 | ||
| 65 a 74 | 34 and under | 17543,511* | 5089,218 | 0.039 | 501,313 | 34585,711 | |
| 35 a 44 | 15278,510* | 2041,956 | 0.000 | 8440,636 | 22116,385 | ||
| 45 a 54 | 12846,866* | 2006,435 | 0.000 | 6127,943 | 19565,791 | ||
| 75 and over | 34 and under | 25182,785* | 5656,349 | 0.002 | 6241,440 | 44124,131 | |
| 35 a 44 | 22917,783* | 3203,707 | 0.000 | 12189,571 | 33645,996 | ||
| 45 a 54 | 20486,140* | 3181,184 | 0.000 | 9833,349 | 31138,931 | ||
| 55 a 64 | 15602,360* | 3181,184 | 0.000 | 4949,569 | 26255,151 | ||
| Right lateral ventricle volume | 34 and under | 75 and over | −12058,435* | 2852,528 | 0.004 | −21610,662 | −2506,208 |
| 35-44 | 65-74 | −6830,821* | 1029,770 | 0.000 | −10279,200 | −3382,443 | |
| 75 and over | −10712,438* | 1615,647 | 0.000 | −16122,736 | −5302,140 | ||
| 45-54 | 65-74 | −5909,632* | 1011,856 | 0.000 | −9298,024 | −2521,242 | |
| 75 and over | −9791,249* | 1604,289 | 0.000 | −15163,511 | −4418,987 | ||
| 55-64 | 65-74 | −3596,265* | 1011,856 | 0.029 | −6984,656 | −207,874 | |
| 75 and over | −7477,881* | 1604,289 | 0.001 | −12850,144 | −2105,619 | ||
| 65-74 | 35-44 | 6830,821* | 1029,770 | 0.000 | 3382,443 | 10279,200 | |
| 45-54 | 5909,632* | 1011,856 | 0.000 | 2521,242 | 9298,024 | ||
| 55-64 | 3596,265* | 1011,856 | 0.029 | 207,874 | 6984,656 | ||
| 75 and over | 34 and under | 12058,435* | 2852,528 | 0.004 | 2506,208 | 21610,662 | |
| 35-44 | 10712,438* | 1615,647 | 0.000 | 5302,140 | 16122,736 | ||
| 45-54 | 9791,249* | 1604,289 | 0.000 | 4418,987 | 15163,511 | ||
| 55-64 | 7477,881* | 1604,289 | 0.001 | 2105,619 | 12850,144 | ||
| Left lateral ventricle volume | 34 and under | 75 and over | −13124,350* | 3210,602 | 0.006 | −23875,652 | −2373,048 |
| 35-44 | 55-64 | −4080,873* | 1090,491 | 0.017 | −7732,587 | −429,160 | |
| 65-74 | −8447,688* | 1159,035 | 0.000 | −12328,937 | −4566,441 | ||
| 75 and over | −12205,345* | 1818,456 | 0.000 | −18294,789 | −6115,903 | ||
| 45-54 | 65-74 | −6937,234* | 1138,873 | 0.000 | −10750,964 | −3123,504 | |
| 75 and over | −10694,891* | 1805,672 | 0.000 | −16741,525 | −4648,258 | ||
| 55-64 | 35-44 | 4080,873* | 1090,491 | 0.017 | 429,160 | 7732,587 | |
| 65-74 | −4366,815* | 1138,873 | 0.013 | −8180,546 | −553,085 | ||
| 75 and over | −8124,472* | 1805,672 | 0.001 | −14171,106 | −2077,839 | ||
| 65-74 | 35-44 | 8447,688* | 1159,035 | 0.000 | 4566,441 | 12328,937 | |
| 45-54 | 6937,234* | 1138,873 | 0.000 | 3123,504 | 10750,964 | ||
| 55-64 | 4366,815* | 1138,873 | 0.013 | 553,085 | 8180,546 | ||
| 75 and over | 34 and under | 13124,350* | 3210,602 | 0.006 | 2373,048 | 23875,652 | |
| 35-44 | 12205,345* | 1818,456 | 0.000 | 6115,903 | 18294,789 | ||
| 45-54 | 10694,891* | 1805,672 | 0.000 | 4648,258 | 16741,525 | ||
| 55-64 | 8124,472* | 1805,672 | 0.001 | 2077,839 | 14171,106 | ||
*The mean difference is significant at the 0.05 level.
Discussion
In routine clinical practice, it is shown that the existing morphometric techniques have not been able to prevail, in part due to the inaccessibility of technical methods, to which is added their high cost and their known limitations to low-resolution images3. Due to the absence of morphometric patterns that characterize the study population in the present study, a morphometric quantification method has been developed that includes segmentation of CT images that allow the identification of informative characteristics of a massive set of original characteristics in pre-clinical stages and volumetric calculations which using single-cut CT images, a technique that exists in low-income countries, it has been possible to quantify these results, obtaining a morphometric pattern that describes the increase in the volume of the ventricles with respect to age and its possible use as a biomarker of brain atrophy.
Knowledge of the anatomy of the ventricular system is essential for clinicians, neurosurgeons, and radiologists17,18. Normal reference values of the ventricles, regardless of the type of study used, are necessary to obtain reference data to interpret pathological changes, plan surgery, and determine the presence and progress of some neurological diseases18,19.
The assessment of the increase in the ventricular system is frequently done qualitatively, based on the simple visual analysis of the tomography study; it can also be done quantitatively based on the Evans ventricular index (IE), which must be > 0.3 millimeters (mm)3,4.
Shaikh Shamama18, morph metrically analyzed the width of the frontal horns of the lateral ventricles. The results showed that these structures gradually increased in size from the age group of 30-39 years and their maximum values were described in the group of 70-79 years. These results are somewhat similar to ours, since the ventricular increase was evident in the 35-44 group, accentuating it in the 64-75 and 75 and older groups. Polat and coauthors19 studied the ventricular system in healthy Turkish subjects, reporting statistically significant results for the older age groups. Dzefi Tettey20, when determining the Evans index and the effect of age on this index, demonstrated the effect of age, obtaining the highest values in the age groups between 62-71 and 72 years and over.
It is worth emphasizing, as has been shown, that most authors have studied the morphometrics of the lateral ventricles according to their different parts through linear measurements, not finding robust scientific evidence showing the morphometric results of the study of these structures together. We are of the opinion that obtaining the Evans ventricular index and others, such as the indices of the frontal, occipital, fronto-occipital, bicaudate, Huckman, and others horns, take a long time, require specialized software and the evaluator's expertise in the knowledge of the Anatomy of the central nervous system.
Taking into account that volumetric studies are widely used today and recommended due to the reliability of the results and the shorter time needed for their determination, the quantification of the encephalic ventricular system was carried out by its volumetry, using an approach to recognize patterns of intensities in an image dataset for interactive segmentation.
For the quantitative evaluation of the regions of interest, we show the results of the automatic extraction of homogeneous features in artificial images (Fig. 4). The original images (4A and 4C) and the colors in the images (4B and 4D) represent the classes of the segmented patterns. The numerical values in (4B and 4D) represent the value of the homogeneity index of each class. Figures 4B and 4D show the satisfactory results in the segmentation of intensity patterns proposed in the artificial images when they coincide with the number of referenced classes. What is expected is to obtain emission signals with a high homogeneity value between their adjacent pixels without falling into over-segmentation.
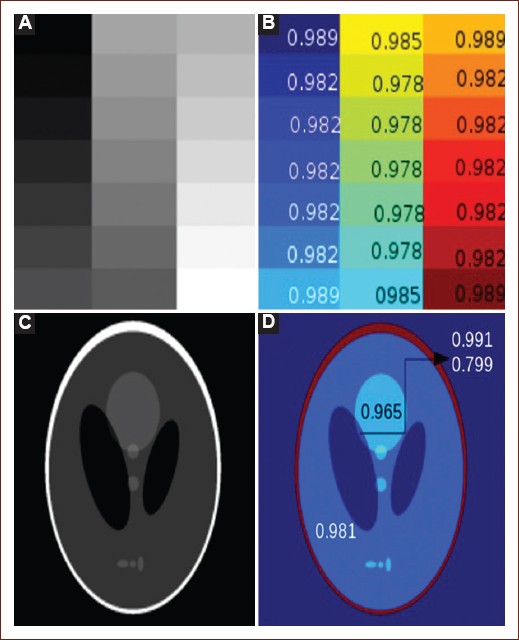
Figure 4 Segmentation of intensity patterns in original and artificial images (prepared by the authors). A and C: are a representation of artificial images, which were created with a high rate of homogeneity between classes. B and D: show the satisfactory results in the segmentation of intensity patterns proposed in the artificial images when coinciding with the number of referenced classes. The colors in the images represent the classes of the segmented patterns. The numerical values represent the value of the homogeneity index of each class.
By means of a visual identification it can be observed how the classes in the segmented image are well preserved by the method. The numerical values in images 4B and 4D indicate an estimate of the homogeneity in the area of the classes.
The fact that the proposed method is sensitive to noise is also visually evident in these results by the distortion between the regions. However, the characteristic of textures in CT images could lead to interesting directions for future research.
There are very few studies where methods are applied with which our approach can be quantitatively compared.
Deleo and co-authors21 proposed a semi-automated method. Users were asked to manually select representative points of cerebrospinal fluid, gray matter, and white matter in the region superior to the third ventricle to avoid artifacts. The thresholds were calculated based on the manual specification of the aforementioned structures. Its drawbacks include: manual specification, which is tedious and error-prone without prior training, and spatial information is not exploited to treat tissues that have overlapping intensity.
Soltanian-Zadeh and Windham14 proposed finding brain contours semi-automatically, manually specifying thresholds in different regions to binarize CT slices, using edge tracking to find contours, employing multi-resolution to resolve broken contours, and specify seed points to collect the desired contour. The large amount of user intervention is its main drawback.
However, recent advances in CT scanner technology and improvement in CT image quality suggest that the ability to distinguish soft tissue types by this diagnostic means is becoming more feasible.
In contrast, Kemmling and co-authors22 introduced a probabilistic atlas based on pre-segmented MRI volumes that were co-registered with CT images to perform tissue classification, but no validation or quantitative approach to this approach was found implemented in your study.
More recently, Manniesing23 proposed a method for CT-based segmentation that requires manual corrections using dedicated software and is also based on the average of CT volumes acquired longitudinally of the same subject after administration of a cellular agent. Contrast to improve the contrast-to-noise ratio from image.
The accuracy of our approach in the setting where more than one CT scan is not available is unknown. Furthermore, averaging CT volumes acquired longitudinally can produce undesirable results in cases where the evolution of pathology between time points modifies the shape and structure of the brain. In addition, the Manniesing method involves the segmentation of gray and white matter and cerebrospinal fluid through contrast-enhanced CT.
In summary, as a consequence of weight loss and/or deterioration of brain tissue, dilatation of the ventricular system is an important change that occurs with brain aging. The most studied structures are the third ventricle, due to its relationship with thalamic atrophy, and the lateral ventricles due to their association with the periventricular white matter and the basal nuclei.
In this sense, some authors consider that the ventricles grow at an average rate of 2.9%/year, after 70 years, this may be almost double that of young adult individuals24-27. In contrast, other authors indicate that this rate seems to decrease in healthy older individuals28,29.
Conclusions
The present study provides a method for morphometric quantification of the lateral ventricles and a normative database, confirming that the volume of the lateral ventricles shows a significant effect as a function of age associated with aging. The implemented neuroimaging protocol allows obtaining global brain volume parameters, with an effective measurement precision level, which guarantees its introduction in the clinical environment. In correspondence with its statistical behavior, it can be used as a standardized morphometric pattern in a population with normal neurocognitive functions and promises to become a sensitive diagnostic tool for the individual diagnostic classification of cerebral atrophy. Additional research is required to validate its potential clinical utility.

