


 nova página do texto(beta)
 Inglês (pdf)
 Artigo em XML
 Referências do artigo
 Enviar este artigo por email
 Citado por SciELO
  Similares em
SciELO
Similares em
SciELO 
 Permalink
Introduction
Emotional processing systems involve components of the peripheral and the central nervous systems that interact to give humans a full range of emotional processes. The somatic marker hypothesis1 holds that extrinsic stimuli trigger reactions in the neurovegetative system that can be measured by the external autonomic responses generated by a central component in this process: the limbic system. Emotional experiences are processed by the temporal and parietal lobes, which transmit information to the frontal lobes with the involvement of the orbitofrontal and dorsolateral prefrontal cortices to integrate the information so can be processed2. This enhances the personal assimilation of autonomic responses, such as increased heart rate (HR), sweating of the hands, dilation of the pupil, linked to previous knowledge about similar situations, and then generates the emotional experience3 that we usually refer to verbally.
Anger is an emotion that can be provoked by various stimuli, most commonly irritations or frustrations generated from situations that restrict an individual's freedom of action or access to resources. This emotion is considered a primitive state of the nervous system that cannot be defined by words in relation to environmental events; it is considered an emotion that goes in contrast of the relationship of valence and direction, since is valued as a negatively valence4 but an approach-related emotion or as a high activation5. However, modern evidence suggests that anger emerges from the neurodynamics of subcortical circuits: the amygdala, the hypothalamus, and the periaqueductal gray matter of the midbrain6. These circuits are present homologously in many mammals and some mature humans who can control the impulses in which cortical areas participate by modulating their responses. These areas are arranged hierarchically such that higher functions are dependent on the integrity of the lower ones. In this sense, the left-prefrontal area has been related to positive affective or approach processes, meanwhile the right-prefrontal area has been associated to negative affective or withdrawal-related processes, even has been suggested an asymmetrical prefrontal activity due to the valence of the emotion generated, left to positive emotion, and right to negative emotion7. As mentioned before, anger is an emotion that generates a negative valence, but an approached-related behavior4. This suggests that anger could generate an asymmetrical prefrontal activity reflecting motivational direction, instead emotional valence.
Studying emotions requires, first, that they be elicited. The stimuli most widely used to generate emotions are pictures. Lang et al.8 have classified a bank of images according to three dimensions: valence, arousal, and dominance. Their collection is called the International Affective Picture System (IAPS). The IAPS has been useful in characterizing physiological and neural-emotional responses to both positive and negative stimuli.
Other studies have employed videoclips taken from movies or digital media, and datasets of videoclips for eliciting emotions have been proposed9. The elements that comprise these videoclips – audio, movement, etc., – contrast to static images and elicit distinct brain patterns of emotional activation. The specific impact of a video can be defined as the intensity and type of emotion or feeling expected in the viewer. In this sense, videos have proven to be an effective tool for generating emotional responses in experimental conditions10.
According to Schachter and Singer11 the bodily signals can interact with other types of information previously learned to modulate emotional intensity, and one stimuli can generate the same level of arousal experienced as anger or happiness depending on the social or cognitive context, nevertheless, continuous exposure to situations of violence on digital media or entertainment12 could lead to an acceptance of such acts by generating a desensitization that is detectable in reduced arousal and emotional disturbance while witnessing violence, less tendency to interfere in a fight, and less empathy for victims of violence due to the exposure of violence movies, videogames, music videos, etc. For these reasons, evaluating the associated emotions can be challenging in light of the possible generation of desensitization that makes eliciting emotions through movies somewhat complicated since a point may be reached at which reality surpasses fiction. Recently, the use of real videos uploaded to the internet has been tested and classified according to the emotional responses they elicit13. This is another tool that could be potentially useful for the experimental elicitation of emotions.
Emotional activation has been recorded by measures both subjective (self-reported perceptions of valence, arousal and dominance) and objective (physiological and brain-imaging techniques). Autonomic emotional responses can be detected by an external sensor. The most common method is known as electro dermal activity; that is, the recording of skin conductance (SC) responses and HR. Increased SC responses are typically associated with negative emotional stimuli, while decreases in HR are linked to negative stimuli, in contrast to increases in HR are observed with positive stimuli14. Other approaches to the study of the recognition of emotions include electroencephalographic (EEG) techniques7. These studies describe the patterns and neural signatures of six emotions, reporting a predominant participation of the temporal and prefrontal lobes on recognizing emotions in the fast frequency bands15. A predominance of the alpha band in high valence and arousal has also been reported during the observation of a visual stimulus to young men, appeared as EEG power spectrums in parieto-occipital regions linked to cortical arousal levels during emotional processes16. In addition, a lateralization has been found that is related to an increased activation of the left hemisphere in response to positive emotions, but greater activation of the right hemisphere to negative emotions17.
EEG techniques provide an approach to the functional connectivity between brain areas during cognitive processes through analyses as coherence or correlation indexes18. These methods have been used to study emotional reactions to videos by comparing positive versus negative emotions, and the interaction of frontal and temporal regions in the theta and alpha bands19. Recently, this approach has also been used to classify connectivity patterns during the elicitation of emotions20, and to confirm previous results that characterized an increased synchronization for negative stimuli with lateralization toward the right hemisphere21.
The study of emotions by functional connectivity analysis has led to a better understanding of how different brain areas interact to process information in response to emotional stimuli. Therefore, considering that normal stimuli based on fictional movies could show flattened responses due to constant exposure in the media, we decided to make an exploratory study comparing brain activity in response to visual stimuli taken from a movie bank to that generated by real Internet videos. The aim of our research was to compare physiological activation and functional connectivity between different types of videos with anger content in young women. We hypothesized that the Internet videos will generate enhanced responses in all metrics compared to excerpts from movies, reflecting the real situations shown in such “real-life” videos, showing an increased degree of functional connectivity on right hemisphere linked to negative valence of the stimuli.
Method
Participants
The study sample consisted of 26, young right-handed women with a mean age of 19.4 (min = 18, max = 28), all currently as university students, divided into two groups of 13 subjects each. All women were healthy and had no background of psychiatric, neurological or hormonal disorders, learning disabilities, drug abuse, or chronic illness. They all signed an informed consent form before participation, were assured that confidentiality would be maintained, and were told that they were free to withdraw from the experiment at any time without penalty. The young women were asked to abstain from drinking caffeine or alcohol during the 12 h before the recording session, and to arrive for the session with clean, dry hair. The recording sessions were made in the Laboratory of Neuropsychology from the Centro Universtario de los Valles in Ameca, Jalisco, México. All recordings were made between days 4 and 8 postmenstruation, to mitigate the effect of menstrual cycle hormones. All participants had an intellectual coefficient equal to or > 90, measured by the Shipley-2 intelligence scale22, normal parameters of depression and anxiety according to Beck's Depression23 and Anxiety Inventories24 validated in Mexico, and showed normal-to-above normal parameters of attention and memory, as measured by the Digit Detections, Visual Detection, and Successive Series subtests of the NEUROPSI battery25. All procedures involved in the experimental protocol were performed in accordance with the ethical standards laid down in the 1964 Helsinki Declaration and its later amendments, or comparable ethical standards. The project was reviewed and approved by the ethical committee of the institution. At the end of the record session, the participants were asked if they have watched the videos or movies shown, considering for the analysis just those participants who had not seen the films.
Stimuli
Three types of videoclips were used (neutral, movies, and internet videos). They were displayed on a 32-inch screen placed 1.5 m from participants. An audio monitor was placed on each side of the screen to reproduce the sound of the videos. The neutral and movies clips included four short scenes selected from an emotion-eliciting film database9 taken only scenes that were classified as useful to elicit anger, used as well in a validated Spanish version26. The internet videos included four clips showing situations of injustice that were tested in an earlier pilot study (n = 10) to confirm that stimuli were classified with a less valence, as well as more activation compared to neutral. All three types were edited to a length of 5 min and were presented continuously in the same order for each participant according to the assigned group. Table 1 shows the description of each type of short videoclip.
Table 1 Description of each short film according to type of videoclip
| Videoclip | Description |
|---|---|
| Neutral | A man arranges papers at a desk, a woman walks in a garden |
| A woman goes upstairs and arrives at a door | |
| A teenager gets out of a car and walks through a market to a house | |
| A person puts out his hand through a car window | |
| Movies | A Neo-Nazi kills a man by crushing his head on a sidewalk |
| A soldier kills people in a concentration camp with his gun from his balcony | |
| Soldiers arrive at a house to kill hidden people | |
| Insinuation of sexual abuse from an officer to a teenager in an orphanage | |
| Internet videos | A town hall worker seizes and throws down an adolescent's merchandise |
| A baby-sitter physically abuses a baby | |
| A young woman throws puppies into a river | |
| A man throws a baby into a pool |
Scales
To evaluate subjective responses, the Self-Assessment Manikin (SAM) and Pick A Mood (PAM) scales were used. The SAM scale27 is a non-verbal, pictorial assessment instrument that measures valence, arousal, pleasure, and dominance directly on a scale of 1-9, from lowest to highest. The PAM scale28 is a cartoon-based pictorial tool designed to measure a person's mood. It consists of three cartoon characters (one male, one female, and a robot). For the present experiment, the female figure was chosen. The scale shows nine expressions that represent distinct mood states (happy, excited, relaxed, calm, sad, bored, tense, annoyed, and neutral) on a Cartesian plane. In both cases, subjects had to choose one option to characterize the emotional response elicited by the stimuli shown.
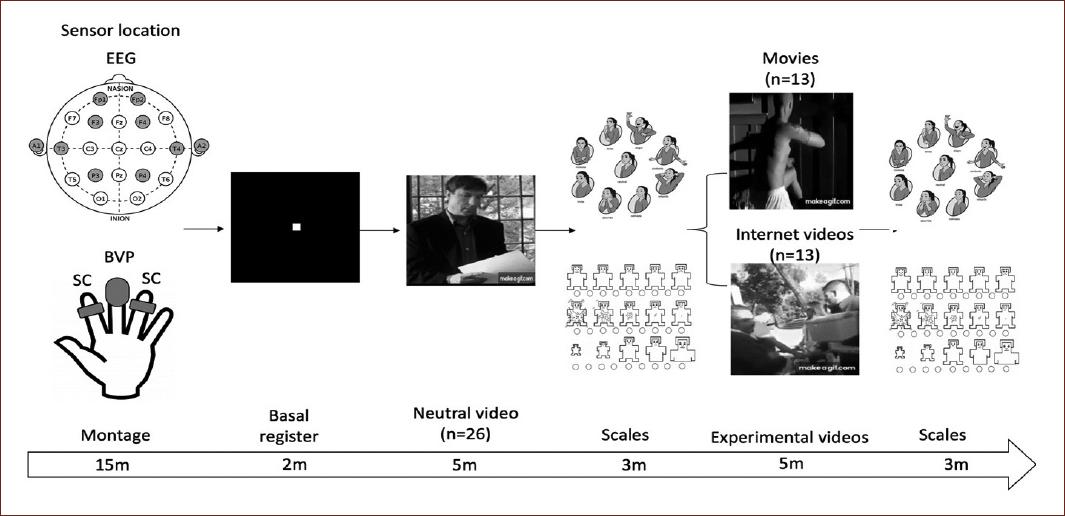
Physiological recording
Physiological recordings were made using two parameters: SC and blood volume pulse (BVP). Sensors were always placed on participants' non-dominant hand (left). The SC sensor consisted of two silver-silver chloride electrodes with a resolution of 0.001 micro siemens (ms) that was placed on the index and ring finger using conductor gel. The BVP device was comprised a light-based technology sensor with a range of 40-240 beats/min, placed on the middle finger to measure HR. BioTrace® Software was used to sample (32 sps), store, and analyze the data.
EEG recordings
For EEG recording, eight electrodes were placed following the International 10-20 System. Due to the specific interests of the study, the recording sites were Fp1 and Fp2, considered frontopolar areas; F3 and F4 as dorsolateral prefrontal areas; T3 and T4 as temporal areas; and P3 and P4 as parietal areas. All derivations were referred to ipsilateral ear electrodes (A1, A2), with the ground electrode placed on the forehead. EEGs were recorded with a NEXUS 32 device at 24 bits resolution and filters set at 1-50 Hz. Impedance for the EEG electrodes was kept below 10 kOhms. BioTrace+® software was used to sample (512 Hz) and store EEG data for processing off-line.
Signal analysis
SC values were taken as the mean of the SC responses, considered as those peaks that raised more than 0.5 ms above basal activity. HR data were obtained as the average values recorded during presentation of the stimuli. Both parameters were obtained for each condition (neutral vs. experimental) and group (internet videos vs. movies) for every participant.
Rejection of EEG epochs was performed by visual inspection. Signals were examined off-line to identify saturated epochs or those that showed noise due to muscle activity, eye movement or heartbeat. Those epochs were removed by means of a computer program CHECASEN29, so we considered only readings that conserved at least 70% of clean epochs. An off-line digital filter was applied for frequencies below 1 Hz and above 50 Hz using the FILDIG program30. A mean of 160, 2-s EEG segments from each participant were selected and analyzed for each type of videoclip. All artifact-free EEG segments were examined using the EEG Bands program31, which applies fast Fourier transform to obtain the absolute power (AP) of frequencies grouped in seven bands: delta (d, 1.5-3.5 Hz), theta (q, 3.5-7.5 Hz), alpha1 (a1, 7.5-10.5 Hz), alpha2 (a2, 10.5-13.5 Hz), beta1 (b1, 13.5-19.5), beta2 (b2, 19.5-30 Hz), and gamma (g, 31-50 Hz). To calculate EEG correlations (rEEG), the instant spectrum of each derivation in each band was obtained, as was the auto spectrum, together with the cross spectrum between derivations for the intrahemispheric (Fp1-F3, Fp1-T3, Fp1-P3, F3-T3, F3-P3, T3-P3, Fp2-F4, Fp2-T4, Fp2-P4, F4-T4, F4-P4, and T4-P4) and interhemispheric electrodes (Fp1-Fp2, F3-F4, T3-T4, and P3-P4). Finally, inverse Fourier transform was applied to convert the signals from the frequency domain to the time domain to obtain Pearson's correlation coefficient. The average rEEG values from each band for each participant were normalized and transformed into Z values for later statistical analysis.
Procedure
The experimental design stipulated a single recording session for each participant, beginning with the electrode montage for the physiological and EEG recordings. In all conditions, participants were awake in a comfortable sitting position with their head supported by the headrest of a chair, asked to avoid movements or blinking during the recording session. An initial basal period of 2 min while watching a center white point over a black background on the screen was recorded to establish each participant's baseline parameters. All subjects were exposed to the neutral stimuli first and asked to evaluate their emotional response using the PAM and SAM scales immediately following the clip. Next, they were randomly assigned to one of the two experimental groups (movies or Internet videos) to watch the corresponding videoclips. They were instructed to answer the PAM and SAM scales again at the end of the videoclip. EEG and physiological data were recorded without interruption during each session (Fig. 1). At the end of the session, electrodes were removed and the subjects were thanked for their voluntary participation in the study.
Statistical analysis
Due the neutral condition was the same for both groups and to analyze the differences between groups for experimental condition, we use the baseline correction, according to this the data from the neutral condition were subtracted from the experimental condition for each group, comparing the means among the differences from neutral to each type of stimuli (movies vs. internet videos). For behavioral analyses, the PAM scale data were analyzed with Chi-square statistical comparisons and presented by frequencies. The results of the SAM scales, however, did not have a normal distribution according to the Kolmogorov–Smirnov test, so a Mann–Whitney U-test was applied. The physiological and EEG data were analyzed independently using Student's t-test. Post hoc analyses were performed with Cohen's d to obtain the size effect of the stimuli. A post hoc power analysis was conducted using the software package G*Power32, the alpha level used for this analysis was p < 0.05, with the sample size and for each variable size effect. Corrections for multiple comparisons were made using the False Discovery Rate method.
Results
Behavioral results
According to the results of the subjective PAM evaluation, both experimental stimuli seemed to elicit a predominantly “annoyed” mood (Internet videos = 66.6% and movies = 45.4%) compared to the neutral videoclip, which showed a 50% index of “calm” mood in the Internet video group, and equal percentages of 27.2% for “neutral” and “bored” moods in the movies group. No differences were observed between the two kinds of experimental video (X2 = 3.989, p = 0.407) (Fig. 2).

Figure 2 Schematic representation of the frequency of the subjective PAM evaluations under the two experimental conditions.
The results observed on the SAM's scales matched those seen on the PAM scales. In the evaluation of valence, the movies group scored a mean of −4.076 (Standard Error [SE] ± = 0.52), while the internet video group scored a mean of −2.615 (SE ± = 0.59). The statistical test found no significant differences between groups (U = 43, p = 0.157). The analysis of arousal showed a mean of 2.23 (SE ± = 0.80) movies group, while the other group scored a mean of 2.61 (SE ± = 0.90). These differences were not significant according to the statistical test (U = 56.50, p = 0.574). Dominance showed no difference between groups, with a mean of −2.23 (SE ± = 1.14) in the movies group, and a mean of −0.15 (SE ± = 0.65) for the internet videos group (U = 49.50, p = 0.320) (Fig. 3).

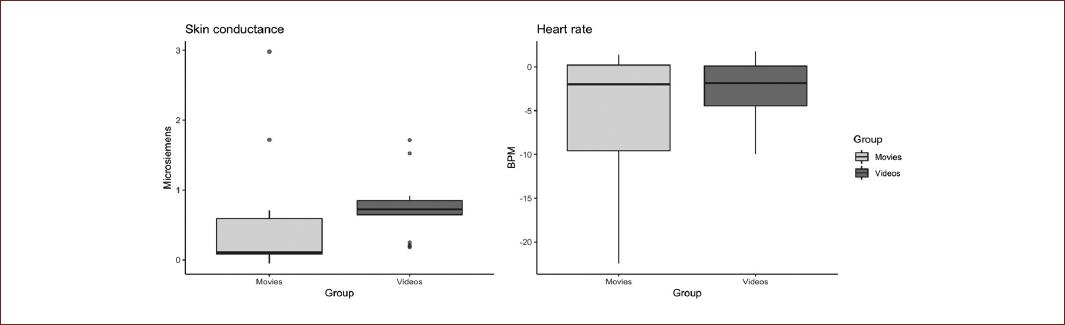
Physiological results
The physiological data repeated the pattern observed in the valence and arousal data. SC showed a mean of 0.545 ms, (SE ± = 0.24) in the movies group, and the internet videos group showed a mean of 0.762 ms (SE ± = 0.12). Statistical analyses showed no significant differences for the comparisons between groups (t = −0.794, p = 0.434, d = −0.311). The post hoc power analysis with G*Power revealed a statistical power of 0.11. Regarding HR, a mean of −5.887 bpm (SE ± = 0.24) was observed in the movies group, and a mean of −2.693 bpm (SE ± = 1.03), in the internet videos group. Statistical analyses revealed no significant differences in the comparison between groups (t = −1.352, p = 0.188, d = −0.530). The post hoc power analysis revealed a statistical power > 99 to the between groups comparisons (Fig. 4).
EEG results
The EEG correlation data showed differences between both types of experimental video clips only for the right intra-hemispheric correlation, with significant differences for the dorsolateral-temporal (F4-T4) derivations in alpha2, beta1, beta2, and gamma bands, and for the fronto-temporal (Fp2-T4) derivations in all bands. For the dorsolateral-temporal derivations, a decrease in correlation values was observed for the movies group in the alpha2 (Z = −0.04, SE ± = 0.02), beta1 (Z = −0.05, SE ± = 0.05), beta2 (Z = −0.07, SE ± = 0.04), and gamma (Z = −0.07, SE ± = 0.04) bands. In contrast to the movies group, the internet videos group had an increased correlation in the same bands: alpha2 (Z = 0.08, SE ± = 0.04), beta1 (Z = 0.06, SE ± = 0.04), beta2 (Z = 0.07, SE ± = 0.03), and gamma (Z = 0.07, SE ± = 0.04). Statistical analyses detected a significant difference in the alpha2 (t = −2.519, p = 0.019, d = 1.028), beta1 (t = −2.240, p = 0.035, d = 0.914), beta2 (t = −2.269, p = 0.033, d = 0.926), and gamma (t = −2.891, p = 0.008, d = 1.180) bands at this derivation (right dorsolateral-temporal) (Fig. 5). The post hoc power analysis revealed a statistical power > 99 for all bands comparisons.

Figure 5 On the left, a schematic representation of the right intra-hemispheric correlation between dorsolateral prefrontal and temporal derivations; on the right, a representation of the interaction between groups in the alpha2, beta1, beta2, and gamma bands.
In the case of fronto-temporal derivations, the effect mentioned above was also observed, with a decrease in correlation values in the movies group for the delta (Z = −0.04, SE ± = 0.01), theta (Z = −0.03, SE ± = 0.02), alpha1 (Z = −0.03, SE ± = 0.02), alpha2 (Z = −0.03, SE ± = 0.02), beta1 (Z = −0.05, SE ± = 0.03), beta2 (Z = −0.07, SE ± = 0.03), and gamma (Z = −0.07, SE ± = 0.03) bands. There was also an increase in the correlation values for the Internet videos group in the same bands: delta (Z = 0.07, SE ± = 0.04), theta (Z = 0.07, SE ± = 0.04), alpha1 (Z = 0.05, SE ± = 0.03), alpha2 (Z = 0.07, SE ± = 0.03), beta1 (Z = 0.05, SE ± = 0.03), beta2 (Z = 0.04, SE ± = 0.03), and gamma (Z = 0.05, SE ± = 0.03). The statistical analyses also showed a significant interaction effect in the delta (t = −2.431, p = 0.023, d = 0.993), theta (t = −2.319, p = 0.030, d = 0.947), alpha1 (t = −2.262, p = 0.033, d = 0.924), alpha2 (t = −2.699, p = 0.013, d = 1.102), beta1 (t = −2.558, p = 0.017, d = 1.044), beta2 (t = −2.460, p = 0.022, d = 1.004), and gamma (t = −2.889, p = 0.008, d = 1.179) bands at this derivation (right frontotemporal) (Fig. 6). The post hoc power analysis revealed and statistical power > 99 to all comparisons.
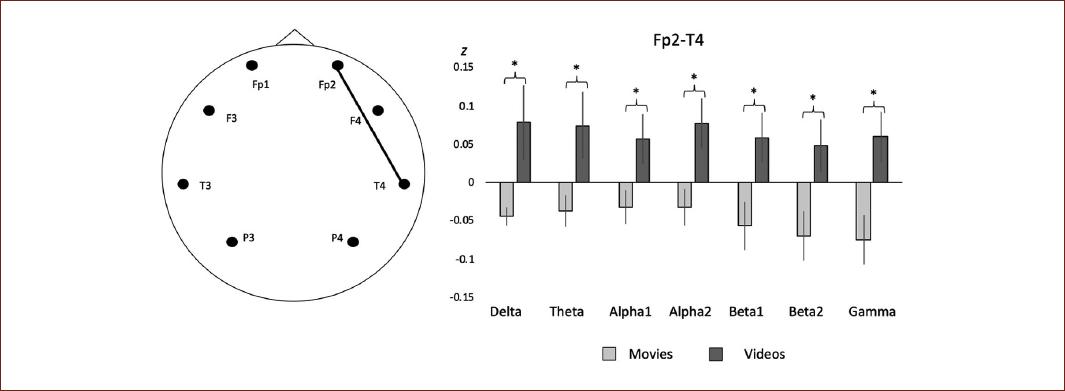
Figure 6 On the left, a schematic representation of the right intra-hemispheric correlation between frontopolar and temporal derivations; on the right, a representation of the interaction between groups in all the electroencephalographic bands recorded.
No statistical significance was observed with respect to the inter-hemispheric correlations at any derivation in the comparison between groups. After multiple comparison analysis no one of the p values reached the statistical significance.
Discussion
This study compared the subjective and electrophysiological responses associated with observation of a stimuli, with the intention of generating anger, presented in two modalities: movie video clips and videos from the internet, the first taken from a database of fiction-based movie videoclips, the other consisting of videos taken from the internet that represented real situations with real people who were not acting. The data obtained seem to confirm what other studies of emotional elicitation have reported. Initially, subjective data showed a prevalence of negative moods for both experimental conditions compared to the neutral condition33. No group differences were observed, indicating that regardless of the content featured in each video, subjects apparently grouped the content of the videos as equal, since in both cases there was a prevalence of an emotional activation represented by the lower values for valence and higher values for arousal, compared to the neutral videoclip26.
The physiological data appeared to share the same pattern as the subjective data. As reported previously, the physiological activation of SC and HR is recognized as an indicator of participation by the sympathetic system, amygdala, and prefrontal medial areas, and as objective measures of emotional activation. A pattern of increased SC and decreased HR for both groups were observed; the same pattern that has been reported previously in the presence of aversive emotional stimuli34. These physiological data could suggest that, associated to their specific content, both videoclips generated emotional activation in our experimental subjects.
In contrast to the subjective, SC and HR data, the EEG correlations showed a characteristic pattern for each experimental condition. This pattern was lateralized toward the right hemisphere between dorsolateral-temporal and frontopolar-temporal regions, with a lower correlation for the movies video clips and a higher correlation for the internet videos.
Right hemispheric connectivity has been associated specifically with arousing emotional stimuli linked mainly to negative emotional valences17,35. This pattern is characterized by decreased activity in the alpha and beta bands, related mainly to negative emotions such as disgust, fear or anger36, and manifested primarily in frontal and temporal areas19.
Participation of the right temporal cortex has been related to emotional visual content, with higher activation during aversive stimuli than positive or neutral ones37. This activation, along with the participation of the insula, has been related to the processing of internal stimuli as a visceral response38. The prefrontal cortex is linked to emotional representation, the assignation of incentive value39, conscious experiences with a perceived stimulus, and bodily activation40. Specifically, the dorsolateral prefrontal cortex has been associated with the evaluation of external information, and the frontopolar cortex with information generated internally, supporting the cognitive regulation of emotion41. The relationship between prefrontal and temporal lobes during emotional visual stimulation seems to be crucial for adequate emotional processing39, with enhanced activation when emotional stimuli include a social component42. The relationship between the frontopolar and temporal cortices has been shown to be involved, specifically, in pro-social feelings and moral constraints43. The correlation between temporal and prefrontal regions presented in our data may, therefore corroborate previous findings linked to the processing and cognitive control of emotional responses to social-emotional stimuli. The difference in cognitive control could be the factor that lies behind the increased and decreased correlations found to be related to each kind of experimental condition. Maybe associated with a desensibilization that can occur by the exposure to aggressive movies12,13. It is likely that each condition, even if it were to have the same emotional content, would produce different emotional processes depending on the behavior – realistic versus acted – of the people in the videos shown.
In contrast, a decrease of the coupling between prefrontal and posterior regions has been observed during negative emotions, and in relation to the difficulty involved in recognizing people's emotions44. In addition, the decoupling of the prefrontal cortex from posterior perceptual areas has been related to a suspension of the prefrontal cortex' control over emotional or perceptual areas15,45. This may well be associated with the generation of feelings of anger that is helpful in survival situations.
As mentioned above, human emotions have been described as being organized by systems of appetitive or defensive motivation that mediate a whole range of attentional and action reflexes that mediate survival7,8. Unpleasant effects, in particular, are held to be associated with defensive motivation. A system of inhibition of action (behavioral inhibition system) has been associated with this.
Most findings are based on social emotions as a response to fictional stimuli (movies) that participants may interpret as non-real. Furthermore, could be related to the emotion intensity showed on the videos, which was reported previously by González-Roldan et al.46. In the present experiment, in contrast, an increased EEG correlation in the internet videos group was observed that could be linked to a more involved process of social cognition – such as mentalizing – which has been linked to frontopolar activation, mainly in medial regions47. In the event that these regions cannot be evaluated directly using surface electrodes, a relation between temporal and prefrontal derivations mediated by the beta2 band has been linked to frontopolar medial activation48, and with an empathic behavior from the observer as a controlled top-down processes46. According to these findings, the activation observed in the right hemisphere agrees with subjective reports by participants, who indicated responses of greater annoyance to both kinds of activating videos, as has been suggested to occur with negative emotions in women compared to men49.
Conclusions
According to our data, we can conclude that, like other studies, subjective and physiological activation present a characteristic pattern between neutral and experimental videoclips with no significant differences between the two kinds of videos. Functional EEG activity, in contrast, showed a characteristic pattern for each kind of video, linked to its content, and represented by a decreased correlation between temporal and prefrontal areas during the movies videoclip and an increased correlation in the same areas during the internet videoclips. The differences determined in functional connectivity in posterior and anterior regions could be linked to a withdrawal response represented by a lower correlation, with an approximation response linked to a greater correlation. The functional connectivity EEG analysis gives us a closer approximation than assessments of subjective physiological activity to the study of the cognitive processing of emotions.
Limitations of the study
It is important to mention certain limitations of our study, mainly the sample size and the source of the internet videos used, future studies should consider others factors on the participants like internet addiction. For this reason, we consider this report as a preliminary findings suggesting the replication to the study of emotional activity in response to real videos compared to a traditional data set (movie clips).

