


 nueva página del texto (beta)
 Inglés (pdf)
 Artículo en XML
 Referencias del artículo
 Enviar artículo por email
 Citado por SciELO
  Similares en
SciELO
Similares en
SciELO 
 Permalink
Introduction
The study of the structure and function of the human brain continues to be of interest to the neuroscience community and is the result of numerous biochemical and biophysical processes that interact through multiple scales in space and time. The existence of a complex pattern of brain, behavioral, and cognitive structural changes related to neurological and psychiatric diseases is known, the clinical diagnosis of which is complex due to the existence of common symptoms for these diseases that are so frequent in the aging population and that for the understanding of the roots the biological aspects of these changes require an understanding of age-related brain transformations1.
For the study of the different clinical patterns that appear in neurodegenerative diseases, the doctor relies on diagnostic modalities that include neurophysiologic studies and medical imaging. In past decades, there were great difficulties in conducting studies on the morphology of the brain in vivo since there were no diagnostic methods capable of providing extensive information. It was not until 1974, with the introduction of computed tomography (CT) in medical practice and then with magnetic resonance imaging (MRI), that these objectives were achieved, with brain morphometry emerging in the middle of the 20th century2.
Brain morphometry is the discipline primarily concerned with developing tools and strategies for measuring the structural properties of the brain according to the type of imaging data used1. Macroscopic variations in brain anatomy are maintained long enough for comparative research. In fact, morphological analyzes comparing brains at different healthy or pathological stages reveal important information about the progression of normal or abnormal development. Neurological and degenerative diseases also alter the morphology of the brain, not only at the cortical level but also in subcortical structures3.
Despite the vertiginous development of technology, and especially neuroimaging, which have allowed us to delve into the study of brain structure and the understanding of the biological roots of many neurodegenerative diseases, there are still several questions to be answered in medical practice about involuntary changes in the brain related to aging in the natural course of life and morphometric changes in the brain in neurological and psychiatric diseases, as well as in the quantitative evaluations of the brain and its biases related to the great variety of study methods existing3. For this reason, we were motivated to carry out this review, where the influence of age and gender on brain morphometry will be evidenced. We will state different neuroimaging techniques, their objectives and usefulness in medical practice; emphasizing those that are used most frequently in Cuba and exemplifying through low frequency computerized axial tomography images the quantitative evaluations of the human brain that we use, as this is the most widely used diagnostic means in our country. Concepts such as volumetric and the objective it has in the current volumetric visualization of brain structures, we will briefly describe the most used image segmentation methods in neuroimaging processing and their clinical correlation.
Morphometry and age
In differences in the morphometry of the brain, age is a well-known factor that modifies its morphology4-7. With normal aging, there are changes that characterize the aging brain that allow us to differentiate it from a young brain, such as the progressive reduction in brain volume, compensatory ventricular dilation, and the deepening of the brain sulci and cisterns. Assessment of the increase in the ventricular system is frequently done. Qualitatively, from the simple visual analysis of the tomographic study, it can also be performed quantitatively from the Evans ventricular index (IE) that must be > 0.3 millimeters (mm)8.
Special attention in radiological practice is given to the frontal horns of the lateral ventricles, at the level of the Monro hole, the amplitude of these in people under 40 years is < 12 mm, and in those over 40 years < 15 mm9. Dilation of the grooves (Fig. 1) and cisterns (Fig. 2) is part of the normal aging process, normal values are considered 4 mm of brain skull distance and 6 mm of interhemispheric width10. To understand structural and functional changes of the brain, research in the field of neuroscience in the 21st century has been an excellent contribution but is still insufficient4.

Figure 1 Computed tomography image of the simple skull of a 75-year-old patient, without neurologic focalization signs, showing signs of cerebral atrophy with deepening of the grooves at the frontal level (5.17 and 4.31 mm, respectively), of the anterior portion of the interhemispheric fissure (9.19 mm) and dilation of the grooves of Silvio (17.2 and 13.8 mm on both sides) and Rolando (9.76 and 6.89 mm on both sides) (source: Imaging Department, Juan Bruno Zayas Alfonso Hospital).

Figure 2 Computed tomography image of the simple skull of a 75-year-old patient, without neurologic focalization signs, it showing signs of cerebral atrophy at the level of the prechiasmatic cisterns (9.76 and 10.9 mm) and the cerebellar ponto angle (4.64 and 9.08 mm) on both sides (source: Imaging Department, Juan Bruno Zayas Alfonso Hospital).
This fact becomes more relevant if we take into account that more and more people are reaching more advanced stages of life. According to data from the United Nations (UN), in 2020, it will reach 1200 million elderly. In Cuba, it is estimated for 2025 that 25% of the Cuban population will be over 60 years old. This aging phenomenon brings with it an increase in the rate of conditions typical of the elderly, among which degenerative neurological diseases such as Alzheimers disease (AD) stand out11,12.
A frequent finding is that the brain, particularly some areas, changes more than others. However, this issue is far from clear. Since age-related brain changes and reported differences differ between the studies and methods used13-15. An example of this is the research carried out by Pakkenberg et al., in which anatomically combining data from six different samples in postmortem studies revealed that the frontal cortex, and the medial temporal gyrus and parietal cortex are subject to cortical thinning related to age. In contrast, the inferior and anterior temporal lobe, the crusts of the cingulate gyrus were relatively less affected by age13. These results coincide with the study by Oliveira and researchers, who state that reductions in the cortical area of the prefrontal region occur during the last decades of life14. Dotson15, in his casuistry, revealed that age-related brain changes are not only limited at the cortical level, they affect subcortical structures; however, no significant changes were evidenced in the subcortical nuclei.
The complexity of age-related brain morphological differences may be related to lamellar organization and regional evolutionary history of the cerebral cortex. The age of around 60 years is a breaking point for the increase in negative associations between age and brain morphology in neurological diseases, as is the case with AD. Novel relationships of age-related cortical differences with individual sex factors, cognitive functions of fluid intelligence, reaction time and prospective memory, cigarette smoking, alcohol use, and sleep disturbance are reported, the genetic markers of Apolipoprotein E, the brain-derived neurotrophic factor Catechol O methyltransferase, further reveal the joint effects of cognitive functions, lifestyle behaviors, and education on age-related cortical differences16. Finding reduced cerebral perfusion in the elderly, which could potentially be explained by physiological variations in carbon dioxide17.
In humans, one of the fundamental characteristics of successful aging is related to the maintenance of insulin sensitivity. Centennial studies show increased insulin sensitivity, decreased adiponectin secretion, and decreased inflammatory component. Similar phenomena appear in studies of especially long-lived families. Finally, insulin plays a central role in cognitive processes such as attention, executive functions, learning, and memory, direct administration of insulin in the human substantia nigra having been shown to improve cognition and memory. Therefore, insulin and its metabolic pathways participate in a multitude of processes essential for healthy brain aging18. Changes in response to stimuli have been observed when evaluating age-related changes in neuronal activity. The conflicting results of these types of experiments have been attributed to differences in brain blood flow and brain metabolic rate of oxygen19.
Morphometry and gender
The phenomenon of population aging has led to an increasing number of people experiencing cognitive decline related to diseases in old age, such as AD, forms of anxiety and late-onset affective disorders, and psychotic disorders. Furthermore, this same change in population demography has been accompanied by the realization that there may be significant sex differences in age-related cognitive decline and in various age-related neuropsychiatric conditions, including AD and late-onset schizophrenia. However, research has focused mainly on mechanisms underlying sex differences in reproductive behavior and not on sex differences in the aging of human brain areas associated with higher cognition20.
Postmortem studies reported sex differences in human regional brain weight, area, volume, and asymmetry. In general, females have a smaller brain volume with less striking anatomic asymmetries in temporal lobe regions. Postmortem studies that examined sex differences in brain aging found that brain weight decreases in the fifth and sixth decades of life in women compared with the sixth and seventh decades of life in men; in contrast, the area of corpus callosum decreases significantly with age in men but not women. CT studies have reported significant gender differences in age-associated ventricular enlargement. A precipitous increase in ventricular volume begins in the fifth decade in men and the sixth decade in women20.
Declan and researchers in their study showed that women had a significantly greater volume of thalamic and caudate nuclei than men. In contrast, the left lateral asymmetry of the lateral ventricles was significantly greater in men than in women. There were significant gender differences in the right symmetry of age-related decreases in frontal lobe volume: the right decreased more than the left in men, but the left decreased more than the right in women. At present, new measures such as curvature, cortical complexity, volume and surface area, and gray matter (GS) volume and concentration have been incorporated to study gender-related differences in brain morphometry; however, the results are not conclusive as they vary between the methods and algorithms used20.
In relation to sexual dimorphism, studies reveal that it appears in stages as early as post puberty21,22. Zheng et al. invoked as causes the hormonal effect and its action on the brain structure, the differences in abilities according to gender as well as the difference in gender behavior. Furthermore, they argue that differences in brain morphology may originate from weight differences between the sexes; studies have shown that there are regional differences even after weight correction23. Phenotypic sex is systematically related to brain asymmetry24. Gender differences in cognitive function have also been demonstrated, many studies coincide in their results, where there is an advantage for women in tests of verbal fluency and psychomotor speed and the advantage of men in the visual-spatial aspect25.
Studies by Xu26, Valizadeh27, and Polunina28 show that there are significant differences in sex in the effects related to age and morphometry and metabolism of the human brain in regions known to support higher cognitive function. These findings may explain some sex differences in age-related cognitive decline and may interact with overlapping pathological processes to contribute to sex differences in diseases of the human brain.
There are well-known sex differences in the prevalence, age of onset, and severity of various brain-related illnesses, such as AD, strokes, multiple sclerosis, bipolar and autistic disorder, depression, the disease Parkinsons disease, and schizophrenia. In such sexually dimorphic brain diseases, there could be a potential sex-specific protective agent that could lead to future therapies29.
Neuroimaging studies
Medical images of the head provide an effective means of looking at the anatomy of the brain. Someone qualified to read these scans quickly examines multiple slice images to locate, assess, and identify features of brain atrophy in aging. This analysis uses experience and the human visual system and is clinically useful, although it is in principle qualitative. By means of the quantitative analysis of neuroanatomical structures in medical images of the skull, three-dimensional morphometry can be obtained and used as evidence for diagnosis and to evaluate the response to treatment30.
Morphometric analysis provides measures of location, volume, shape, and homogeneity of the component brain structures. This type of analysis, along with neuropsychological, neurological, and psychiatric evaluations in conjunction with functional neuroimaging, is now used to answer broad classes of questions about brain structure and function, both for normal subjects and for patient populations. For example, quantitative measurements of the brain have contributed to the study of language development disorders and autism, AD, dyslexia, attention deficit hyperactivity disorder, schizophrenia, multiple sclerosis, Huntingtons disease, and obsessive-compulsive disorder. The precise delineation of cortical parcel units can be used to locate active brain regions in functional neuroimaging studies, and localization of white matter parcel units is useful for planning the treatment of brain damage such as that caused by stroke30.
In recent years, a number of unbiased, objective techniques have been developed to characterize neuroanatomical differences in vivo using structural magnetic resonance images and different modalities of CT. These techniques can be broadly classified into those that deal with macroscopic differences in brain shape and those that examine the local composition of brain tissue after macroscopic differences have been discounted. The former, which includes deformation-based morphometry (DBM), characterizes the neuroanatomy of any individual brain in terms of deformation fields that map each brain to a standard reference. The latter, which include voxel-based morphometry (VBM), compare different brains on a voxel by voxel basis after the deformation fields have been used to spatially normalize the images. One shared aspect of these techniques is that the entire brain, rather than a particular structure, can be examined in an unbiased and objective manner1.
The appropriate approach, therefore, depends on the types of structural differences that are expected among the images. Where there are global patterns of difference, multivariate approaches such as DBM may be more powerful as they can model covariance between different structures. In contrast, mass univariate approaches such as VBM are likely to provide greater sensitivity for localizing small scale, regional differences in gray or white matter. An additional difference between the two approaches relates to their computational cost. Specifically, DBM requires computationally expensive estimation of high-resolution deformation fields that map each individual brain to a standard reference. In contrast, VBM requires the estimation of smooth, low-frequency deformation fields and is, therefore, a simple and pragmatic approach within the capabilities of most research units. It is also used in the field of neuroscience linear multivariate technique called source-based morphometry, a data-driven multivariate approach for decomposing structural brain imaging data into commonly covering components and subject-specific loading parameters. It has been used to study neuroanatomical differences between healthy controls and patients with neuropsychiatric diseases1.
VBM studies have been successful in characterizing structural brain differences in a variety of diseases. While VBM was originally devised to identify subtle neuroanatomical changes associated with neurological and psychiatric dysfunction, the method has also been used to examine gross structural abnormalities. The use of VBM with highly distorted brains presents special challenges; however, due to the difficulties that arise during spatial normalization. Although VBM was originally devised to examine structural abnormalities in patients, the technique can also be used with healthy subjects1.
Brain morphometry studies show that the largest changes within an individual generally occur during early development, the subtlest changes continue into adulthood, and again dramatic changes occur in the latter part of human life: aging17,31.
Using modern machine learning techniques in the neuroimaging community, they have made it possible for researchers to discover biomarkers of aging and develop automatic classification systems28,29. The combination of different methods of imaging, data processing, statistics, and physics creates the possibility of describing and building understandable brain networks. Data processing, mathematics, and physics often play an important role in achieving safe results in such scientific studies30.
In current times, medical images have become an essential tool in clinical practice since it allows early detection of pathologies (Fig. 3). With such tools, decisions are made in real-time or photographs and samples are taken for diagnosis and recommended therapy. Other applications not only refer to medical diagnosis but also to medical planning, development and subsequent evaluation of surgical and radiotherapy6,32-34. The 80s marked the emergence of a new type of technology related to medical services, the image archiving and communication system (picture archiving and communication system [PACS]), which represents hardware and software systems, consisting of a digital network, capable of storing, exchanging and view medical images34.
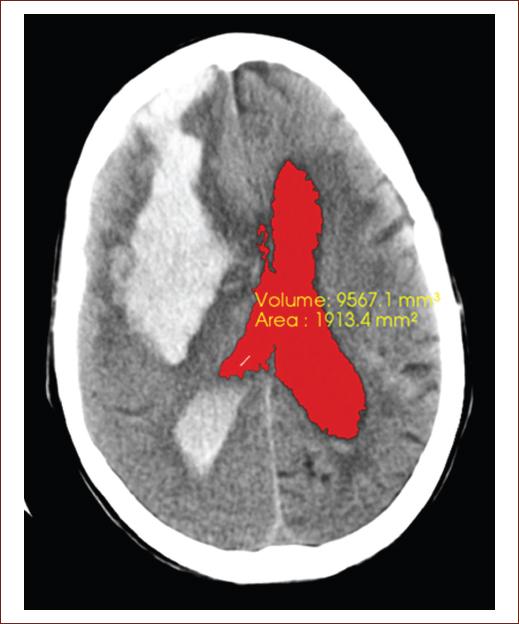
Figure 3 Computed tomography image of the simple skull of an 82-year-old patient, with neurologic focalization signs related to full down, showing a recent hemorrhagic focus of 82 right front parietal HU, measuring 93.6 mm × 41.1 mm that floods the ventricular system, note the blood content in both occipital horns a predominance of the right side, associated with perilesional edema that clears the cerebral sulci at that level, collapsing the right frontal horn and compressing the body of the right lateral ventricle, which displaces the midline to 8 mm to the left. The segmentation of the lateral ventricles was performed, getting the volume 9988.4 mm3 and area 1977.7 mm2 obtained in this tomography slice (source: taken from the Imaging Department, Juan Bruno Zayas Alfonso Hospital).
In Cuba, there is some experience in the use of PACS and, at some point, some companies developed and implemented PACS, such as the Medical Biophysics Center that developed the first Cuban magnetic resonance tomographic machine, had an exhibition station, and launched the base for the development of PACS: solutions called iMagis that are currently the most widespread in Cuba. IMagis is a set of PACS solutions developed under the Linux Platform, using free tools, which is composed of a Digital Imaging and Communications in Medicine server and a visualization system. Like all PACS solutions, it offers image storage, indexing, search, and delivery services from modern medical imaging equipment and workstations34.
The version of iMagis currently being used in Cuba is 2.0, which consists of a visualization system designed with a component-based philosophy, and consists of five plugins that add the following applications to the system architecture: a two-dimensional viewer, a three-dimensional viewer, a multiplanar reconstruction viewer, a study controller, and a component for storage devices. The system admits a wide range of medical modalities, in our particular case, we will work with imaging through CT, as it is the most widely used diagnostic means in our imaging services34.
Thanks to medical imaging technology, we can study these changes in depth. This has undergone a dramatic change in the last three decades with the emergence of new modalities of tomographic images such as CT, MRI, and positron emission tomography (PET), which offer images of different organs free of overlays with unprecedented precision. You can even record the three-dimensional (3D) structure of the organs by taking a sequence of parallel cross sections31.
PET allows a detailed examination of body functions, the proper functioning of organs, sugars, metabolic functions, use and performance of oxygen in the body, blood flow, and detection of foreign agents within the body35.
Another highly relevant technique is functional MRI, it gives neurologists and neuroscientists the possibility of observing the internal structures of the brain by mapping it so that the observed cognitive functions can be hierarchies. It is very useful for detecting the effects and changes produced by head trauma (traumatic brain injury), neurodegenerative diseases, brain tumors, and any type of structural damage in the various brain regions35.
MRI is a technique focused on looking at soft tissues such as cerebrospinal fluid, white matter, and gray matter within the brain. The great contribution of this technology is that, unlike some of the aforementioned techniques, it can provide more precise information on a wide range of physiological and neurophysiologic pathologies35.
Computerized axial tomography (CT) provides high definition and sharpness, the cross-sections evaluated after each extracted image can be visualized in three dimensions. It is used to detect any type of internal hemorrhage, multiple internal lacerations or fractures, damage to organic tissues, trauma, and extension of tumors both in brain regions and in regions of the rest of the body, pathologies related to the spinal cord, and damage at the level of the vertebral column and detect anatomical alterations of organs35.
The greatest scientific advance that neuroimaging techniques can record is that they do not require procedures that put human life at risk, they allow the study of the brain alive and fully functioning. They are applied with great frequency in neurodegenerative diseases and dementias, serving to establish much clearer and more precise diagnostic principles, both in the identification of disease patterns and in structural and functional damages caused by degenerative diseases35,36.
There are multiplex imaging techniques that support the diagnosis of dementia: some are in clinical use and other are research techniques. In this area, the most widely used techniques are structural MRI for the evaluation of cortical atrophy, as well as alterations of the white matter and, more recently, PET for the measurement of amyloid deposits or tau protein. Both techniques detect disease-specific morphological and molecular alterations36,37.
In the case of mild cognitive impairment and frontotemporal dementia, neuroimaging reveals their potential for establishing patterns in the differentiation of neurodegenerative disorders. Structural MRI remains the central diagnostic tool for the identification of cortical and subcortical atrophy patterns. On the other hand, advances in PET have opened the door to antemortem diagnosis and early preclinical identification. Likewise, the recent approach to diffusion MRI enables the characterization of the microstructural integrity of cerebral white matter and its relationship with cognitive impairment in the context of neurodegenerative disease. By integrating information from different domains, clinically accepted tools are supported, ensuring better diagnostic precision and prediction of the onset of the disease35.
In recent years, due to the need for early diagnosis, the effort has focused on the development of neuroimaging techniques that allow the detection of disease in preclinical stages, before irreversible brain damage occurs, such as advanced MR techniques, such as diffusion tensor imaging, spectroscopy, and neuronal connectivity using resting-state functional resonance; PET with 18F fluorodeoxyglucose (FDG-PET); HMPAO and TRODAT-1 brain perfusion single-photon emission CT and iodine-123-b-carbo-methoxy-3-b- (4-iodophenyltropane) fluoropropyl dopamine transporter imaging; as well as studies using multimodal imaging techniques35,37.
For many clinical tasks such as surgical planning, it is necessary to understand and communicate complex and often malformed 3D structures and it is achieved through neuroimaging. Experience has shown that mental reconstruction of objects from cross-sectional images is extremely difficult and highly dependent on the observers training and imagination. For these cases, it is advantageous to present the human body as a surgeon or anatomist would see it (Fig. 4)38.

Figure 4 Left image: represent the three-dimensional reconstruction from the segmentation of the lateral ventricles and the volume 9988.4 mm3 and area 1977.7 mm2 obtained in this tomography slice, were the hemorrhagic focus of 82 front parietal right UH is observe in the right image (source: taken from the Imaging Department, Juan Bruno Zayas Alfonso Hospital).
We cannot fail to highlight the importance of the use of computer systems since it allows improving the quality of the visualization of the acquired medical images. Techniques are currently used to reduce the noise produced during image acquisition, enhance specific areas, and segment images into different parts (Fig. 5). Some of these techniques have been developed by academic and commercial organizations, encapsulating them in classroom libraries; an example is the Insight Toolkit open-source library, which specializes in image processing, segmentation, and registration. It is very common nowadays to display the quantitative results made in medical images such as volumetric visualization39.

Figure 5 Left: original Digital Imaging and Communications in Medicine image of a simple raw skull computed tomography. Center: result of applying the curvature flow image filter. Right: result obtained by applying segmentation based on homogeneity indicators during the pre-processing stage (source: taken from the Imaging Department, Juan Bruno Zayas Alfonso Hospital).
Brain volumetric and visualization
Brain volumetric is an advanced semi-automatic post-processing technique that, from a volumetric image of T1-weighted MRI (preferably MPRAGE due to its high contrast between white matter and cortex) and CT, the segmentation and volume of cortical structures and subcortical. One of the most widely used software worldwide is Free Surfer. This software, based on one or more volumetric acquisitions, automatically determines, among other data: the volume of the cortex, white matter, multiple subcortical structures, and cortical thickness1,38.
The goal of computer vision, also known as image understanding, is to create symbolic descriptions (in terms of names, relationships) of the contents of an image. In volume display, the lowest level image segmentation functions are used to identify different parts of a volume that can be displayed or removed. Computer graphics provide methods for synthesizing images from numerical descriptions38.
With the acquisition of one or more series of tomographic images, the data are generally subjected to pre-processing. Such as image filtering, interpolation, and image merging if data from multiple sources are to be used. From this point, one of several paths can be followed. More traditional surface extraction methods first create an intermediate surface representation of the objects to display. Then, it can be represented with any standard computer graphics utility. More recently, direct volume visualization methods have been developed that create 3D views directly from volume data. These methods use full image intensity information to render transparent and semitransparent surfaces, cuts, or volumes. They may or may not include an explicit segmentation step for identifying and labeling the objects to be rendered. With respect to post-processing steps, especially intensity-based segmentation, it is often desirable to improve the signal to noise ratio of the data using image or volume filtering. Known noise filters are average, medium, and Gaussian filters. However, these methods also tend to smooth out small details. Better results are obtained with anisotropic diffusion filters, which largely preserve the limits of objects38.
For clinical applications, it is important to ensure that the 3D images really show the true anatomical situation that it does not deviate from the real image, which it adapts to the needs of the observer, allowing the correct diagnosis to be made. Image quality can be measured in terms of sensitivity, specificity, and diagnostic accuracy. In volume visualization, other measurements such as surface position accuracy or normal surface vectors appear to be more appropriate, as these are more critical to visual impression. In this way, typical error ranges could be estimated. However, a built-in description of all the steps and parameters of the volume display pipeline regarding the resulting image quality is not yet available38.
Segmentation
To provide quantitative neuroanatomical measurements and locations, structural brain scans must be segmented, assuming they are working with an image volume that generally represents a large number of images that darken each other. To show one, in particular, we have to decide which parts of the volume we want to use or ignore. The first step is to divide the image volume into different regions that are homogeneous with respect to some formal criteria and that correspond to real (anatomical) objects. This process is called segmentation. In a later interpretation step, the regions can be identified and labeled with meaningful terms such as white matter or ventricle. Although segmentation is fairly easy for a human expert, it has proven to be extremely difficult for a computer32,39.
The statistical significance and importance of the results of a quantitative analysis depend on the precision of the segmentation method. When specific brain structures are segmented using precise definitions and careful attention to detail, the resulting measurements can be used to address specific neurological questions and produce statistically significant findings. However, improving statistical significance by paying more attention to detail directly increases the amount of effort required for analysis and is time-consuming due to a large amount of data and the tediousness of the task. Furthermore, it is necessary to repeat the segmentation in a certain number of examinations to assess the inter reviewer and intra reviewer reliability, which is why it is still considered a pending problem to be solved in the quantitative morphometric analysis; being necessary to achieve greater automation of the same. Among the potential benefits of automation are: more reproducible results, improves consistency and reliability, increases the availability of the analysis, reduction of human time required to perform the segmentation allowing to analyze more subjects and allow more comprehensive analysis32.
Several automated head segmentation methods for MR are available for application in clinical settings, not being the case with the CT modality, when in the clinical setting they are more used than the MR modality, due to its higher acquisition speed, fewer contraindications, lower cost, and its ability to answer a wide variety of clinical questions. Existing methods in CT segmentation are semi-automated or are directed at a specific region of the brain or a disease, among which are the created to measure global volume metrics, such as total intracranial volume (TIV) and total brain volume (TBV) from images without detectable pathologies, they have not been formally validated. Some well-validated methods segment only TIV but not TBV. However, TBV is more indicative of pathological conditions in neurodegenerative diseases and TIV is used simply as a variable for normalization purposes32,39.
Among the segmentation methods used for volume visualization, they range from classification and edge detection to recent approaches such as deformable models, atlas registration and scale space, and interactive segmentation. In practice, these basic approaches are often combined39.
Classification: a direct approach to segmentation is to classify the voxel according to its intensity, no matter where it is located. A very simple but important example is the threshold: a certain intensity range is specified with lower and upper threshold values. A voxel belongs to the selected class if and only if its intensity level is within the specified range. Threshold is the method of choice for selecting bone or soft tissue on CT. In direct volume display, it is often done during the rendering process, so an explicit segmentation step is not required38,39.
Simple classification schemes are not suitable if the structures in question have mostly overlapping or even identical gray level distributions, such as different soft tissues from CT or MRI. Segmentation becomes easier if multispectral imaging is available, such as imaging T1-weighted and T2-weighted on MRI, which emphasize fat and water, respectively. In this case, individual threshold values can be specified for each parameter. Classification and analysis of connected components can also be combined in a single region growth algorithm. Starting with a user-selected initial voxel, all neighboring voxels are added to the region if they meet certain criteria based on intensity. This process continues recursively from the recently added voxels until more suitable neighbors cannot be found38,39.
Edge detection: another classic approach to segmentation is edge detection, using the first or second derivatives of the 3D intensity function. These edges (in 3D, they are actually surfaces; however, it is common to speak of edges) are supposed to represent the edges between different tissues or organs38,39.
Deformable models: one way to represent general knowledge about possible shapes is to use deformable models based on curves or parameterized surfaces. As an important class of deformable models, active contours evolve iteratively toward selected image features, thus minimizing an energy function based on external and internal forces. External forces describe how well the contour fits the characteristics detected in the image data, such as high gradient magnitudes. Internal forces describe the tension of the contour itself38,39.
Atlas registry: a more explicit representation of prior knowledge about the shape of the object is the anatomical atlas. Segmentation is based on recording the volume of the image under consideration with a pre-labeled volume that serves as a target atlas. Once the registration parameters are estimated, the inverse transformation is used to map the anatomical labels on the image volume, thus achieving segmentation. In general, these atlases do not represent an individual, but rather a normal anatomy and its variability in terms of a probabilistic spatial distribution, obtained from numerous cases38,39.
Space-scale segmentation: another interesting idea is to investigate the characteristics of objects in space at scale, that is, at different levels of image resolution. This approach allows us to ignore the irrelevant details of the image. One of these methods developed by Pizer and researchers considers symmetry of previously determined shapes, described by medial axes. The resulting crest function in scale space is called the nucleus of an object. It can be used, for example, for interactive segmentation, where the user can select, add or subtract regions, or move to larger parent or child regions in the hierarchy38,39.
Conclusions
Age and sex are factors that modify brain morphometry. VBM studies are an effective tool for determining structural changes in the human brain. Medical imaging as well as volumetric visualization is a powerful source of information for the study of the anatomy of healthy brains and patients with neurodegenerative diseases in research, education, and patient care. However, it is necessary to perform more investigations because there are problems that still harm an even wider use since the automatic segmentation methods require too much time; in addition, there are a lot of technical parameters to apply it. However, with the increase in computing power, these problems will be overcome in the short term.

