


 nueva página del texto (beta)
 Inglés (pdf)
 Artículo en XML
 Referencias del artículo
 Enviar artículo por email
 Citado por SciELO
  Similares en
SciELO
Similares en
SciELO 
 Permalink
Introduction
Neurocysticercosis is the most frequent central nervous system (CNS) parasitic disease, being human the only definitive host, while pig is the main intermediate. Taenia solium causes taeniasis, when adult parasite is lodged in the small bowel, and cysticercosis, when larval form is lodged in CNS and skeletal muscle.
Neurocysticercosis is still diagnosed frequently in Mexican patients; the Instituto Nacional de Neurología y Neurocirugía, attended 429 new cases from 2000 to 2014, which means 28-29 patients per year in the hospital1-3.
According to the 2005 Sistema Nacional de Vigilancia Epidemiológica (SUIVE), the national incidence of taeniasis is up to 0.37%4. Studies made in Mexico suggest that 8-13% of pigs are infected with cysticercosis, predominately in Puebla and Guerrero5.
Main risk factors to acquire this infection in Mexico are lack of water, drainage, toilet, and pigs in housing, which are prevalent in most of Mexico’s communities; however, lack of water and/or low quality of it are most important factors to acquire tapeworm/cysticercosis complex in our country, feature which keeps in marginal and rural areas6.
According to the last GLAAS report (UN-Water Global Analysis and Assessment of Sanitation and Drinking-Water) is needed to increase public and free access to quality water, increasing the use of toilet and population`s hygiene in Mexico, especially in marginal, rural or farer areas, where there are susceptible population7.
Previously, we applied the same methodology to 2010 Instituto Nacional de Estadística y Geografía (INEGI) database, considering lack of water, sanitary, drainage, and pigs in housing, obtaining 21 affected states corresponding to the 100 first townships affected. Although there was significant correlation between all national townships and Human Development Index (HDI), no significant correlation between just 100 townships and HDI8.
Materials and methods
We consulted the population and housing 2015 INEGI census, and agricultural INEGI census, to obtain number of inhabitants, houses with lack of water, houses without drainage, houses without toilet, and number of houses with pigs in housing. These data were considered during the period of 2010-2015, considering as an inclusion criteria, states, and townships with high number of houses with lack of water, houses without drainage, houses without toilet, and houses with pigs in housing. We selected states and townships with highest number or percentage of houses meeting these criteria, to be compared with HDI, hypothesizing the highest risk factors the lower HDI. Hence, states and townships were classified to obtain a percentage per township and state, these data were ordered from higher to lower frequency to get risky areas according to Pearson correlation. Moreover, results were graphic in a national map to check the most affected areas in 2015, and compare with 2010 INEGI previous results.
Results
The main townships which meet high risk factors and a low HDI were located in the first quartile of all Mexican townships. This township belongs to all Mexicans states, but just the first 100 townships belonged to 20 of 32 states of Mexico (Table 1), with 2,360,752 (14,074-220,000, IC 95%) of risked habitants, representing a 1.968 % of national population, and 3.094% of risked states population.
Table 1 Results of main risked factor's states, HDI, and population in Mexican analysis
| State | Municipal population | State population | Percentage of risk population | HDI |
|---|---|---|---|---|
| Oaxaca | 4365 | 3,967,889 | 0.110 | 0.681 |
| Puebla | 3084 | 6,168,883 | 0.049 | 0.717 |
| Baja California Sur | 1496 | 712,029 | 0.210 | 0.776 |
| Hidalgo | 3429 | 2,858,359 | 0.119 | 0.723 |
| Michoacán | 46,762 | 4,584,471 | 1.020 | 0.7 |
| Nayarit | 6731 | 1,181,050 | 0.569 | 0.733 |
| Querétaro | 18,954 | 2,038,372 | 0.929 | 0.76 |
| Chiapas | 35,482 | 5,217,908 | 0.680 | 0.667 |
| Aguascalientes | 9583 | 1,312,544 | 0.730 | 0.76 |
| Chihuahua | 19,207 | 3,556,574 | 0.540 | 0.734 |
| Estado de México | 100,366 | 16,187,608 | 0.620 | 0.745 |
| Zacatecas | 17,688 | 1,579,209 | 1.120 | 0.72 |
| Colima | 18,428 | 711,235 | 2.590 | 0.763 |
| Veracruz | 930,019 | 8,112,505 | 0.370 | 0.713 |
| Campeche | 17,634 | 899,931 | 1.959 | 0.749 |
| Tamaulipas | 84,322 | 3,441,698 | 2.450 | 0.758 |
| Nuevo Leon | 160,755 | 5,119,504 | 3.140 | 0.79 |
| Tabasco | 453,157 | 2,395,272 | 4.306 | 0.742 |
| San Luis Potosi | 162,528 | 2,717,820 | 5.980 | 0.726 |
| Guerrero | 266,762 | 3,533,251 | 7.550 | 0.679 |
| Total | 2,360,752 | 76,296,112 | 1.752 | 0.7318 |
| Percentage of risk factors according to national population 2015 | 1.968 | |||
| Increased of risked population from 2010 to 2015 | 0.154 | |||
| Percentage of risked population according to risked states | 3.094 | |||
| Medium HDI | 0.731 | |||
| 2015 population (INEGI) | 119,938,473 | |||
| Increased of population in 5 years | 8.064 |
In the other hand, we found that population grown an 8.064% (n = 8,920,678) between 2010 and 2015 according to INEGI database, representing a 0.154% (n = 13,738) grown of risked population, compared to 2010 analysis (Fig. 1)8. Moreover, the HDI of Mexican states were from 0.667 to 0.79 with a medium HDI of 0.73 (Fig. 2). The state with the higher HDI was Nuevo Leon with 0.79, and the lower HDI was Chiapas with 0.667.
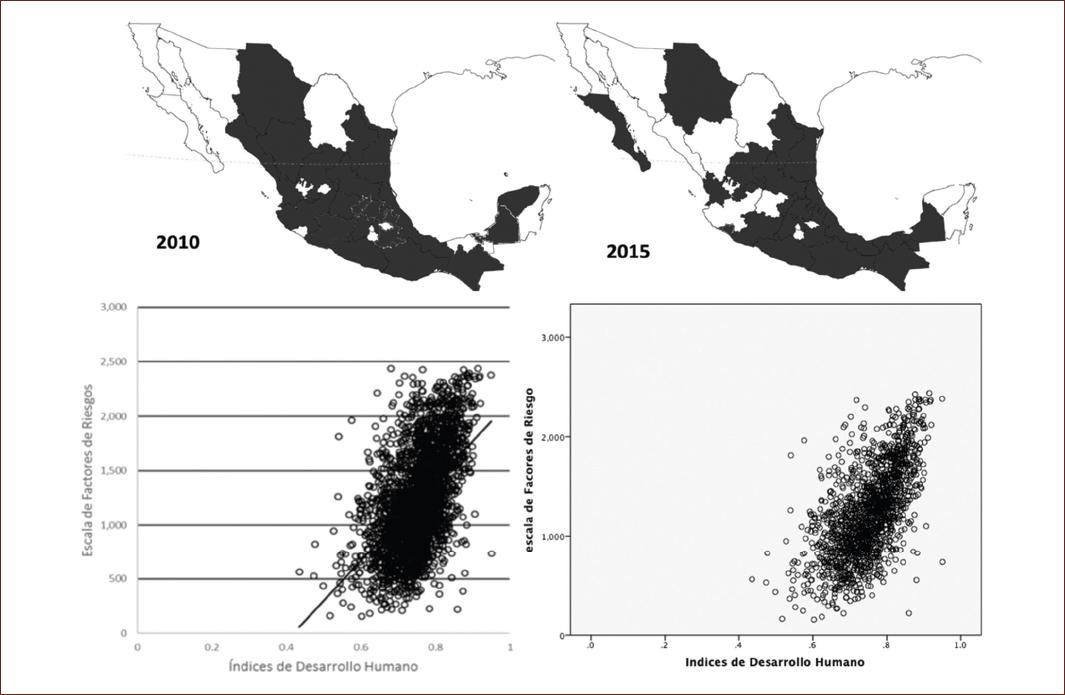
Figure 1 Comparison between 2010 and 2015 analysis, pictured the most affected states in Mexico, as well as transition in dispersion graphics of affected township areas.

Finally, we compared the HDI with risk factors, hypothesized that the higher HDI the lower risk factors, obtaining a significant Pearson correlation with p = 0.01 (R = 0.529), concluding that the most affected state was Guerrero with 7.55% of risked population, and the less affected state was Puebla, with 0.04% of risked population (Fig. 3).

Discussion
According to our results, the risk factors keeps in the most of areas in Mexico, unfortunately between 2010 and 2015 there were and increasing of 0.154% of risked population, corresponding to 978,834 habitants. These data suggest that risk factors are still remaining in Mexico, but some areas have shown an improvement while others did not. The distribution of these data (2005-2015) shows us that risk factors to acquire tapeworm/cysticercosis complex are common and prevalent in the most of states of Mexico, which represents the need to implement preventive measures in these states to reduce the incidence of this infection in our country.
Mohit et al. explored Nottinghamshire County Council’s (NCC’s) risk factors, including patients with NCC who used water from unsafe drinking sources, or whom disposed garbage close to water source, obtaining that there were more slaughter houses and pigs around the houses of NCC patients than the control group9.
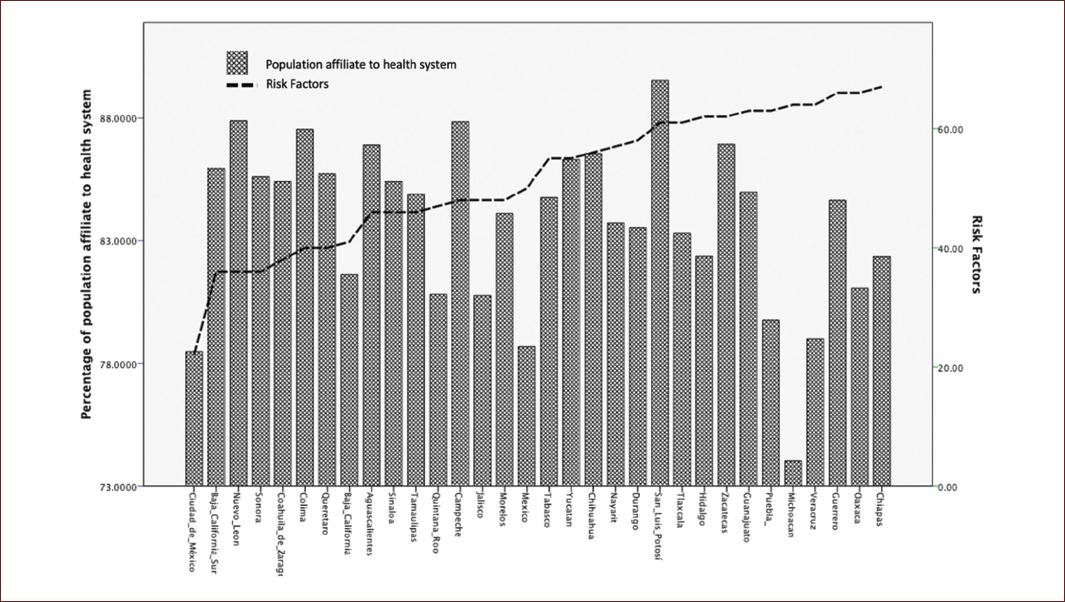
We suggest preventive measures as improving the health and hygiene of these areas, as well as implementing vaccination in pigs in the areas of greatest impact to eradicate this epidemic, taking into consideration that the main risky states are the main states with low population affiliated to health system (Fig. 4).
Conclusions
Comparing the 2010 and 2015 results according to our methodology, we obtained an improvement in risk factors, with a low increasing of affected population, and a maintenance of HDI in the past 5 years. There were 20 of 32 affected states, compared to the previous analysis from 2010, with 21 of 32 affected states. Although there are less affected states, the population in them keeps risk factors and unhealthy conditions, which are necessary to acquire tapeworm/cysticercosis complex.

