


 nova página do texto(beta)
 Inglês (pdf)
 Artigo em XML
 Referências do artigo
 Enviar este artigo por email
 Citado por SciELO
  Similares em
SciELO
Similares em
SciELO 
 Permalink
Introduction
Nowadays, the deposition of homogeneous ZnS thin films is actively pursued due to its physical properties such as n-type conductivity, direct bandgap
ZnS thin film deposition has been carried out employing physical and chemical techniques, such as: sputtering [10], thermal evaporation [11], pulsed laser deposition [12], electrodeposition [13], Chemical bath deposition [14], and successive ionic layer adsorption and reaction (SILAR) [15]. Also, ZnS thin films have been prepared using a precursor solution by dip-coating [16] or spin-coating [17].
Chemical bath deposition (CBD) is a popular technique due to its low cost, simple experimental set-up and low temperatures of the precursor solutions employed as film is growing. Thin films of II-VI semiconductors deposited by CBD have been extensively studied. Regarding to ZnS, its low solubility product (Ksp = 10-24.7, at room temperature) gave place to a fast homogeneous phase precipitation and precursor depletion; to study the role of complexing agent on deposition is very important because it controls the growth rate of solid species promoting the deposition of uniform and homogenous films [18]. The CBD deposition of ZnS films has been reported by Khatri and Patel, the results of several zinc and sulfur precursors are reported emphasizing the positive effect of sodium citrate and triethanolamine on the structural and optoelectronic properties of the films [19].
Up to our knowledge there is no reports on a thermodynamic analysis of the effects of complexing agents such as ethanolamine (ETA), Triethanolamine (TEA) or sodium citrate (Cit) on the deposition process involved in the growth of ZnS films. Experimental parameters employed in CBD were stablished based on the physical-chemical study of the species distribution diagrams for the Zn-ETA, Zn-TEA and Zn-Cit systems along with Thiourea predominance diagram.
Reaction mechanism
An intrinsic characteristic of water solution in the hydrolysis of metallic ions is the polymerization of hydrolyzed species as stated in equation (1)
At fixed values of pH, temperature and concentration, metallic oxide precipitation is possible due to polymerization of hydrolysis of Zn [20]. However, metallic coordinate complex formation allows the stabilization of cation Zn2+, controlling metal concentration as free specie, affecting formation rate of some solid species.
The following chemical reactions describe how Zn2+ ions are coordinated by ETA, TEA, or Cit ligands.
The stability constants for zinc-ETA, zinc-TEA and zinc-citrate complexes were taken from NIST and Medusa-Hydra chemical equilibrium software. Besides, some thermodynamic data were complemented in references [21-24].
Chemical deposition involves three mechanisms for nucleation and thin films growth: ion by ion growth, formation of metallic hydroxides and complex decomposition in the solution. During ion-by-ion growth films growth by diffusion of ionic species close to surface substrate. Formation and dissociation of complex affects the growth of solid species through adsorption and diffusion processes. Then, replacement of colloidal particles of metallic hydroxides in the nucleation of metallic sulfurs is controlled by complexing metallic species [25].
Then, the deposition of zinc sulfide depends on the release of Zn2+ ions from the metallic complexes and the dissolution of thiourea (T) described by the reaction 5.
The dissociation of hydrogen sulfide releases S2- ions into solution:
Also, the metallic cations are coordinated with thiourea to form zinc-thiourea complexes. The stability constants and thermodynamic data are reported in the references [26-28] and by NIST. Hence, ZnS film can form as a solid phase according to reaction:
Thermodynamic constants of interest for Zn-S system can be found in the reference [29].
Experimental details
Growth of ZnS thin films
ZnS films were deposited on 1 square inch sodalime glass (SLG), using acidic soluble complexes to promote Zn stabilization. The predominant coordinate compounds are [Zn(ETA)2]2+, [Zn(TEA)]2+ and [Zn(Cit)]- as obtained from species distribution diagrams shown in Figure 1. For that, the zinc precursor solution was prepared using 0.04 M zinc(II) chloride into 140 ml of double distilled water (DDW). ETA, TEA and Cit were added to the precursor solutions in atomic weights ratio (1:2) for Zn-Complexing agents. Afterwards, the SLG substrates were immersed vertically and stirring during 1 h at 50 °C. The pH of solution was 5. A thiourea solution at pH equal to 10 was added to the Zn-ETA, Zn-TEA and Zn-Cit complexes solution by means of graduated burettes during 30 min. The sulfide source concentration was (1:2) for Zn-thiourea into 50 ml of DDW. Chemical baths have a total volume of 200 ml and the pH of the solution was kept at pH equal to 10 by adding a small amount of ammonia and temperature at a 90 °C for 1 h.
Characterization
The structural phases of ZnS films were ascertained by X-ray diffraction employing Siemens D5000 X-ray diffractometer (Cu Kα, λ = 1.5406 Å), over a 2θ range of 10° to 70° and additional phase characterization of the films was obtained by Raman spectroscopy at room temperature, using a Horiba Jobin Yvon LabRAM HR micro-Raman system with a laser source of 632 nm. The optical properties in the UV-vis-NIR were measured with a Perkin Elmer model Lambda 25 spectrophotometer over the 200-1100 nm range. The surface morphology and chemical composition were analyzed by field emission scanning electron microscope JEOL (JSM-7401F FESEM), equipped with energy dispersive X-ray spectroscopy. The thickness of ZnS films were determined by cross section measurements by SEM. Electrical properties were measured employing a Hall Effect system HMS-5300.
Physicochemical analysis
The thermodynamic diagrams of chemical stability were calculated employing Medusa-Hydra chemical equilibrium software. The algorithm is based on Gibbs free energy minimization and simultaneous equilibrium principle [30]. The temperature effects on chemical equilibrium constants were obtained employing van ’t Hoff equation:
Where,
Mole fraction diagrams of Zn complex
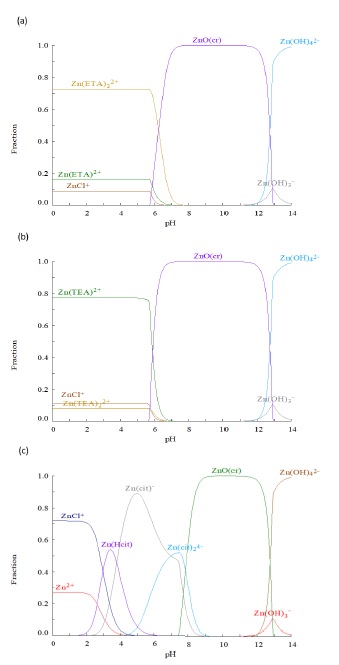
Figure 1 present Mole fraction diagrams of Zn complex as function of pH for the formed complex with ETA, TEA and Cit. As shown in Figure 1a and 1b species of complexes ETA and TEA are stable for pH values lower than 6 and coordinates compounds [Zn(ETA)2]2+ and [Zn(TEA)]2+ are dominant in complexing Zn. At pH values between 6 and 13 it is predicted the formation of ZnO(cr) at higher pH values ZnO(cr) would be dissolved, and hydroxylated zinc complex become dominant.
For Figure 1c, it is observed that Cit complexes are stables for pH between 2 and 9. This broad pH interval for Zn-Cit predominance covers different deposition conditions to obtain ZnS as contrast to the limited conditions for ETA and TEA complexes. In fact, at pH = 5 up to 90 % of Zn fraction is complexed by forming the [Zn(Cit)]- specie and for pH values between 8 and 13 Zn-Cit complex are dominant over ZnO(cr). Then as result of the above analysis it is found that the greater Zn fraction is complexed at pH values between 4 and 6; for the experimental implementation of the deposition process pH = 5 was chosen. ZnS formation is sought employing metallic complexes, adding thiourea as sulfur source and controlling pH using NH3(ac).
Predominance-zone diagrams
In Figure 2 are shown predominance diagrams for Zn complexes using ETA, TEA, Cit and thiourea as sulfur precursor. For the three systems it is possible to observe zones of stability for hydroxylated complexes of zinc [Zn(OH)2], [Zn(OH)3 -], and [Zn(OH)4 2-] at pH values greater than 7 and [Zn2+] concentrations lower than 0.1 mM. For ETA (Figure 2a) and TEA (Figure 2b) the complexes [Zn(ETA)2 2+] and [Zn(TEA)2+] are dominant between pH values of 0 and 7. Finally, for the Cit system the predominant species correspond to [ZnHCit], [ZnCit]- and [ZnCit2]4- at pH values between 3 and 9.
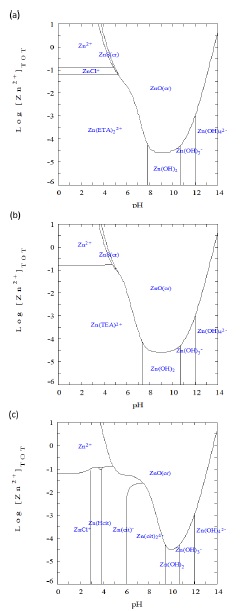
Figure 2 Log[Zn2+] Predominance-zone diagram as function pH value for system (a) ETA+T, (b) TEA+T, and (c) Cit+T.
Thermodynamic analysis shown that for concentrations higher than 0.01 mM of the complexing agents (ETA, TEA or Cit) and alkaline conditions the dominant solid specie correspond to ZnO. For the systems ETA+T and TEA+T, the stability zone for the solid ZnS is so reduced that make improbable its formation, additionally it would require Zn2+ concentrations higher than 10 M. For the system Zn2+ there is no predominance of ZnS.
The above analysis stablish that ZnS is obtained employing ETA+T and TEA+T only under acidic conditions and concentrations between 0.01 and 0.001 M. However, thiourea hydrolysis is not produced under acidic conditions. [HS]- anion has predominance at alkaline pH. For the system Cit+T at pH = 8 and concentrations between 0.01 and 0.001 M, the complex [ZnCit2]4- has predominance becoming a potential precursor for ZnS formation.
From chemical equilibrium considerations it is possible evaluate theoretically the probability of ZnS formation using [Zn2+], [S2-] ion concentrations and the solubility product constant, Ksp at 90 °C:
Where
Thiourea dissolution produce hydrogen sulfide and bi-sulfur anion. Then, for a concentration of thiourea of 0.153 M, the expected concentration of
Then for concentrations of [S2-] = 1.23×10⁻²¹ M and [Zn2+] = 0.025 M, ZnS would be obtained because the product of components concentrations is greater than solubility product. As consequence growth parameters chosen were pH = 8 with concentrations of [Zn2+] = 0.025 M and [Thiourea] = 0.153 M.
Results and discussion
Structural analysis
X-ray diffraction patterns of the films obtained employing ETA+T and TEA+T are shown in Figures 3a and 3b. In both Figures, the patterns correspond to that of highly crystalline hexagonal ZnO (powder diffraction file 01-079-0207). Figure 3c corresponds to the sample deposited employing the system Cit+T; diffraction peak corresponds to cubic ZnS growing preferentially along (111) direction (powder diffraction file 01-080-0020) [32-34]. The observed broad band is associated to glass substrate.
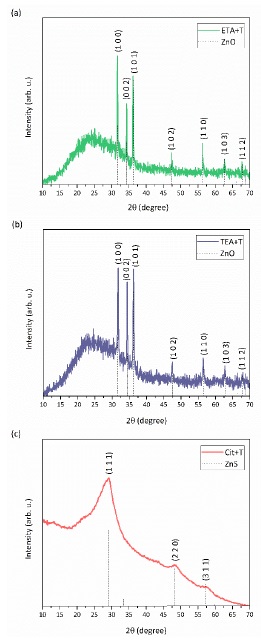
Figure 3 XRD patterns of (a) ZnO film obtained employing the system ETA+T; (b) ZnO film obtained employing the system TEA+T; (c) ZnS film obtained employing the system Cit+T.
The size of crystallite found in the films (D) may be estimated using the Debye-Scherrer formula:
Where, k is the shape factor, taken equal to 0.94, λ is the wavelength of the incident radiation equal to 0.15406 nm, β is the full width at half maximum (FWHM) in radians and θ is the Bragg angle of the peak analyzed [35]. The average crystallite size values obtained are 79.69, 60.16, and 4.70 nm for ETA+T, TEA+T, and Cit+T samples, respectively. It is worth to mention that sample produced employing Cit+T produced the smallest crystals as shown by the broader width of its diffraction peaks. The production of ZnO under alkaline growth conditions confirms the prediction capability of predominance-zone diagrams because that analysis stablished the predominance of ZnO(cr) [36,37].
The formation of ZnO obtained using the systems Zn-ETA and Zn-TEA may be explained in terms of a fast liberation of metallic ion reacting with water to produce ZnO crystals. For the complex Cit, due to the chemical equilibrium between the ligand Cit and cation Zn2+ stable complex is formed giving place to a controlled liberation of metallic cation, then ZnS formation prevail over that of ZnO. In fact chemical equilibrium constants of complex [Zn(ETA)2]2+ and [Zn(TEA)]2 are smaller than that of [Zn(Cit)2]4-, explaining the chemical process to obtain ZnS films.
Elemental composition and surface characteristics
Figures 4a to 4c show micrographs obtained using scanning electron microscopy of the studied films. Micrographs at the left correspond to 20000X (1 μm) scale while those at the right show amplifications at 50000X (100 nm) scale. Figure 4a shown rectangular prisms at the surface of the film growth using ETA+T precursors. Figures 4b and 4c, both present similar characteristics, a denser film showing spherical clusters on the surface.
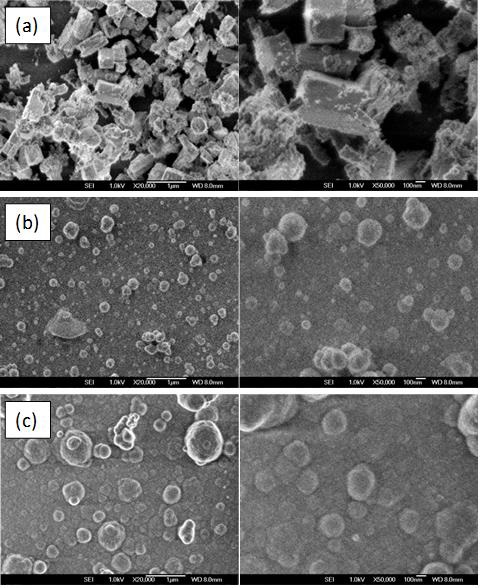
Figure 4 SEM micrographs of the studied samples. Each row corresponds to: a) ZnO sample obtained employing the system ETA+T, b) ZnO sample obtained employing the system TEA+T, and c) ZnS sample obtained employing the system CiT+T. Scale bars on the left side corresponds to 1 μm, and 100 nm for the right side micrographs.
As deposition parameters are similar for films produced with different complexes, the observed differences in film morphology are associated to ligand morphology. Physicochemical analysis stablished that [Zn(ETA)2]2+, [Zn(TEA)]2+ and [Zn(Cit)2]4- are the predominant complex. Due to distribution of ligands, [Zn(TEA)]2+ and [Zn(Cit)2]4- allow the growth of spherical crystals while [Zn(ETA)2]2+ promotes anisotropic growth.
Table 1 present the composition in weight percentage for films employing ETA+T, TEA+T and Cit+T precursors along with values for stoichiometry ZnO and ZnS compounds. For all the samples sulfur is detected but for samples produced with ETA+T, TEA+T it is distributed as clusters as inferred from XRD and Raman spectroscopy. For ZnS film produced employing Cit+T a deficiency in sulfur is found as the ratio S/Zn for a stoichiometric compound is 0.49 while in the reported film this value is 0.3.
Optical and electrical properties
Raman spectra of the samples obtained using ETA+T, TEA+T and Cit+T are presented in Figure 5. For films produced employing ETA+T and TEA+T two peaks situated at 430 and 493 cm-1, are observed and related to ZnO and sulfur as those are close to reported values for the mode E2 of ZnO wurzite and S8 sulfur allotrope [38,39]. For the sample produced using Cit+T, the observed peaks at 260 and 350 cm-1, are attributed to the A1/E1 transverse optical modes and the A1/E1 longitudinal optical phonons modes, respectively [40].
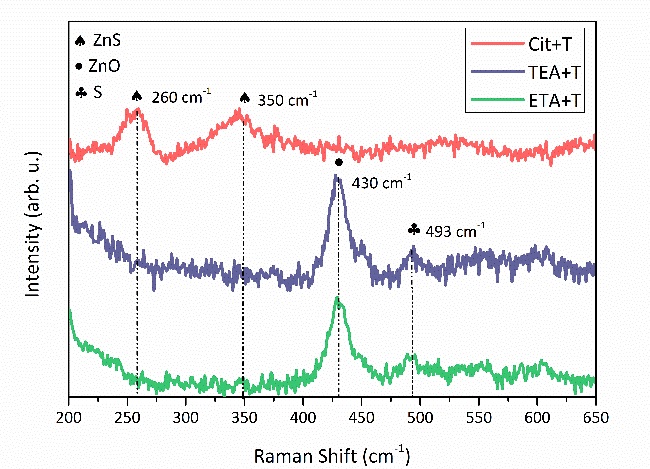
Figure 6a shows the absorbance spectrum and in the inset the transmission spectrum obtained for ZnS film. ZnS is a direct bandgap material however the transmission spectrum does no shown an abrupt rise at the bandgap transition. The above-mentioned characteristic in the transmission spectrum is due to defects in the film associated to slow coalescence processes producing small ZnS crystals. Even when thin film thickness has a value of 250 nm, absorption is high in the range 400 to 500 nm. Figure 6b presents the fit to Tauc model and in the inset a SEM micrography of the transversal section of the ZnS film.
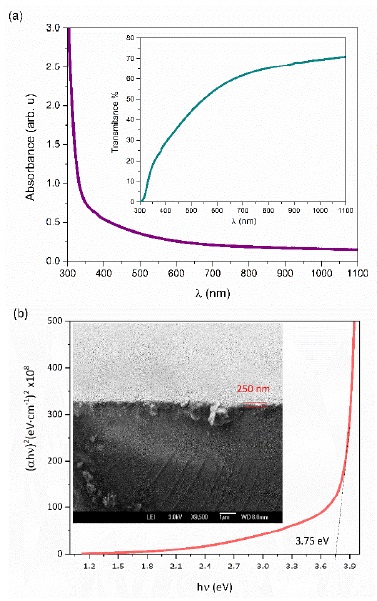
Figure 6 Optical properties of ZnS film obtained employing the system Cit+T: a) Absorbance sprectrum, the inset present transmission spectrum and b) Fitting employing Tauc model, in the inset is shown a transversal section micrography.
Absorption coefficient (α) is obtained using equation (16)
(16)
where, d corresponds to film thickness, T to transmittance and R the reflectivity. To obtain the bandgap Tauc model was employed:
(17)
where, h is Planck’s constant, v is the light frequency, Eg the bandgap, M is a constant related to the transition matrix between valence and conduction bands, and n = ½ to consider direct transitions. The bandgap value for ZnS film obtained from the film is 3.75 eV in agreement with reported values [42,43].
ZnS film present n-type conductivity as the negative value of Hall constant indicate, 8.36×10⁴ Ω·cm is the resistivity value measured. The Carrier density has a value of 2.41×10¹³ 1/cm3 with a mobility value of 4.1 cm2/V·s. High resistivity value is associated to grain size and deficiency in sulfur content.
Conclusions
Physicochemical analysis of Zn molar fraction indicates than under acidic conditions zinc complexes with ETA, TEA and Cit are predominant. Chemical analysis considering thiourea as sulfur precursor indicates that ZnO(cr) is the predominant phase. Film growth employing Zn-ETA and Zn-TEA confirms the thermodynamic prediction as high quality polycrystalline ZnO films were obtained. In the film deposited employing Zn-Cit only the phase ZnS with cubic structure with preferential growth in the direction (111) was found. Raman spectroscopy confirms that in sample deposited employing Zn-Cit, ZnS is the only deposited phase as the only Raman modes present are located at 260 and 350 cm-1. ZnS film has a 3.75 eV bandgap value, high resistivity, n-type conductivity with a carrier density of 2.41×10¹³ 1/cm3 and a mobility of 4.1 cm2/V·s. The deposition of ZnS films by chemical bath deposition is achieved using the metallic complex [Zn(Cit)2]4- as precursor and growth parameters [Zn2+] = 0.025 M, [Cit] = 0.052 M, and [T] = 0.153 M.

