


 nueva página del texto (beta)
 Inglés (pdf)
 Artículo en XML
 Referencias del artículo
 Enviar artículo por email
 Citado por SciELO
  Similares en
SciELO
Similares en
SciELO 
 Permalink
Introduction
Hydrotalcite-type compounds (known as layered double hydroxides, LDH, or anionic clays), are natural or synthetic crystalline materials consisting of positively charged two-dimensional sheets with water and interlayer charge-compensating anions. They may be represented by the general formula [M2+ 1-xM3+ x(OH)2]x+[An-]x/n·yH2O; where M2+ are divalent anions (Mg2+, Zn2+, Mn2+, Ni2+, Co2+, Fe2+), M3+ are trivalent metal ions (Al3+, Cr3+, Fe3+, Co3+, Ga3+), and An- is the interlayer anion with charge n. The structure of LDH itself, Mg6Al2(OH)16CO3٠4H2O, is similar to that found in the brucite, Mg(OH)2, in which the Mg2+ is octahedral and is coordinated by hydroxy groups. These octahedra share adjacent edges to generate films or layers. In LDH, a portion of the Mg2+ ions is replaced by Al3+ ions, resulting in positively charged layers. The space between the stacked layers of brucite-like cation is filled with charge-compensating anions (CO3 2-, Cl1-, NO3-, SO4 2-, OH1- and many others) and water molecules [1]. The Al-Mg hydroxycarbonate LDH corresponds to the natural hydrotalcite mineral. Conventionally, these compounds are synthesized by co-precipitation, in which the metal nitrates and precipitant agents are slowly added and simultaneously at a fixed pH. This is followed by aging for approximately 1 day and/or a hydrothermal treatment to improve crystallinity. Synthesis conditions, temperature, pH and metal composition have been extensively studied [2-4]. By controlled thermal decomposition, LDHs are converted into mixed oxides, which exhibit homogeneous elements intercalation, and fundamentally, strong basic properties. The chemical composition of LDH (nature and number of structural cations and compensating anions) is the main parameter that allows fine tuning of the basic strength. Nevertheless, for a particular chemical composition, the method of synthesis, temperature, solution pH, and ageing time of the gels, have a strong influence on the resulting basicity of the mixed oxides.
In recent years, the synthesis of organic/inorganic hybrid materials bas been studied and new methods for their preparation have been developed [5-6]. The organophilic nature of the interlayer space of LDHs with surfactants as interlayer anions made them ideally for the adsorption of other organic molecules or the intercalation into the hydrophobic interlayer [7-9].
LDHs containing interlayer carboxylate anions are receiving increasing attention due to their interesting properties and potential applications [10]. Anions such as terephthalate adopt different orientations in the LDH layer depending on the charge density and the degree of hydration of the interlayer region [11-12].
In this study, Mg6Al2(CO3)(OH)16·4H2O LDH was prepared by the co-precipitation method and the different concentrations of PTSA in the interlayer were addressed. The LDH-PTSA samples were characterized by FTIR, UV-Vis, Raman, and solid-state MAS-NMR 13C spectroscopies, as well as X-ray diffraction.
Experimental
Preparation
The cation salts used as precursors were Al(NO3)3·9H2O (Fermont ACS reagent, ≥98% CAS:7784-27-2) and Mg(NO3)2·6H2O (Fermont ACS reagent, ≥98% CAS:13446-18-9), while PTSA was purchased from Merck (98.5% purity CAS:6192-52-5). The synthesis of the LDHs was performed under constant pH by the addition of the cation solutions; 0.001 mol of Al(NO3)3·9H2O, and 0.003 mol of Mg(NO3)2·6H2O, were prepared by adding them in 100 cm3 of distilled and previously boiled decarbonated water. The required amount of a NaOH solution (2 M) was also added to maintain a constant pH value of 8.5.
The synthesis carried out under variable pH was also performed by adding the cation solutions on a mixture of the anion to be intercalated. In this case, the appropriate amount of NaOH (2 mol/mol of the cations) was added to the anion solution, before adding the cation solution, to precipitate the LDH of Mg and Al added correspond to a mole fraction of 0.33. PTSA was added in situ at different concentrations (0, 30, 50, 70, and 100 mol%) after precipitate formation. All the materials obtained were separated and washed with decarbonated water. Before drying, half of the products was subjected to hydrothermal heat at 100 °C for 6 h (to dehydrate the synthesized material) and calcined at 400 °C for 4 h.
Characterization
X-ray diffraction (XRD). A Siemens D5005 X-ray diffractometer was used to obtain the powder X-ray patterns. The Cu-Kα1 radiation (1.5406 Å) was selected using a graphite crystal. The diffractograms were performed from 5° to 80° in the 2theta axis, at a 0.02°/s step.
Fourier transform infrared (FTIR) spectra was recorded on a Perkin-Elmer GX system with Attenuated Total Reflectance (ATR); 16 spectra (recorded with a nominal resolution of 2 cm-1) were accumulated and averaged to improve the signal-to-noise ratio. The wavelength range of the spectra was in the range of 400-3600 cm-1.
Raman spectroscopy measurements were performed at room temperature on a computerized Spex 1403 double monochromator with 1 cm-1 resolution, in combination with the 514.5 nm line of an Argon laser (Lexel Lasers) and at a power level of 40mW in the laser head. Raman spectra were collected directly from the powder of the samples in backscattering geometry.
13C solid-state NMR experiments were conducted using a Bruker MSL 300 spectrometer at 300.13 and 75.47 MHz. The experiments were carried out using the magic angle spinning (MAS) technique at 10 kHz and a 4 mm diameter zirconia rotor.
UV-Vis absorption spectra of the powder samples were obtained on a spectrophotometer (Cary 1000) equipped with an integration sphere from 200 cm-1 to 800 cm-1, without background signals of air.
Results and discussion
X-ray diffraction
The LDH sample pattern (Figure 1) corresponds to Mg6Al2(CO3)(OH)16٠4H2O, agrees with PCPDF chart number 014-0191, being possible to determine the rhombohedral crystalline system and space group number 166, with lattice parameters: a = b = 3.07 Å, c = 23.23 Å, α = β = 90°, γ = 120°. It shows sharp and intense peaks near to 2theta = 11.5°, 22.9°, and 34.5°, attributed to diffraction by the (003), (006) and (009) planes, respectively. The first peak of the doublet near to 2theta = 60° is due to diffraction by the (110) planes.
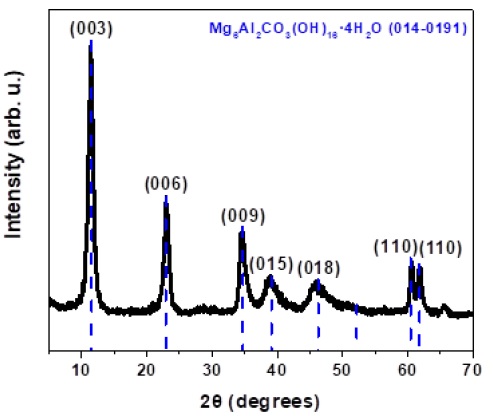
Table 1 shows the basal spacing of LDH with different concentrations of PTSA, determined from the position of the first intense maximum at the low 2theta value. In all samples, the PTSA has intercalated at d(003) where the distance increases regularly from 7.690 Å without PTSA, to 8.543 Å with the highest concentration of PTSA [20-22].
Table 1 Crystallographic parameters of LDHs-PTSA.
| Sample | d(003) (Å) | c (Å) | Basal spacing* (Å) | d(110) (Å) | a (Å) |
| LDH | 7.690 | 23.070 | 3.69 | 1.530 | 3.060 |
| LDH-PTSA30 | 8.087 | 24.261 | 3.29 | 1.533 | 3.066 |
| LDH-PTSA50 | 8.490 | 25.470 | 3.69 | 1.526 | 3.052 |
| LDH-PTSA70 | 8.490 | 25.470 | 3.69 | 1.527 | 3.054 |
| LDH-PTSA100 | 8.543 | 25.629 | 3.74 | 1.529 | 3.058 |
* Basal spacing = d(003) - 4.8
The values included in Table 1 were obtained using the equations (Eqn. 1) and (Eqn. 2) [14] and agree with the formation of LDH materials. The theorical values for the thickness of the brucite-like layers is about 4.8 Å, therefore, the interlayer space is near to 2.8 Å [15], suggesting locations of carbonate anions with their molecular planes parallel to the brucite-like layers.
The crystallographic parameter has a same cation-cation average distance in the brucite-like layers, estimated from the ionic radius of these cations and their molar fractions in the samples. Meanwhile, the parameter c depends on the thickness of the brucite-like layers, controlled mainly by the size and orientation of the interlayer anion and the layers [16].
This parameter is generally related to the coulombic forces between the layers and the interlayer anion; since the Mg-Al ratio in all six samples is the same, for this reason no variation in parameter c is expected.
A detailed analysis in Figure 2 shows the diffraction patterns of different LDH material upon varying the PTSA content, three characteristic reflections of the crystallographic planes (003), (006), and (009), respectively, of LDH formation are observed [17-19]. In the material without PTSA (Figure 2a), peaks with lower crystallinity corresponding to the LDH material are shown.
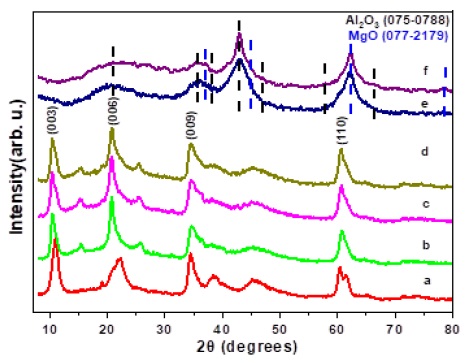
Figure 2 XRD patterns of a) LDH- PTSA30, b) LDH- PTSA50, c) LDH- PTSA70, d) LDH-PTSA100, e) LDH-PTSA30 at 400 °C, and f) LDH-PTSA100 at 400 °C.
Heat treatment of LDHs at 400 °C results in the collapse of the layered structure into mixed oxides consisting of rhombohedral Al2O3 (PCPDF 075-0788) and cubic MgO (PCPDF 077-2179), curves e and f in Figure 2. By the time the samples were calcined, the characteristic LDH signals disappeared, and diffraction bands appeared at 36°, 43°, and 62°, indicating the presence of mixed aluminium and magnesium oxides, regardless of the concentration in PTSA added to the samples [20].
A schematic of transitions metal-containing LDH compounds studied in this work is shown in Figure 3. To achieve equilibrium of the additional charges carried by the trivalent cations, the anions are intercalated into the interbrucite film space during synthesis, leading to the formation of a sandwich-like structure. These results suggest that the PTSA anion is oriented parallel to the brucite-like film.
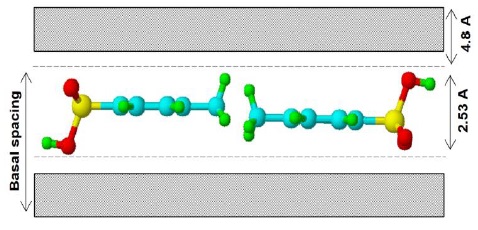
The calculation of the distances presented on Figure 3 was performed using the ACD/ChemSketch 5.08 program (Advanced Chemistry Development Inc.). The thickness of the brucite-like layer (4.8 Å) [21-22], and the d(003) values (table 1) were taken into account, and it is evident that the PTSA anion is unable to orient its hydrocarbon chain perpendicularly to the layers. The range of the basal spacing (d(003) - 2.53 Å) obtained in this work is 3.29-3.64 Å. The small increase may be due to the presence of water, which logically modifies the basal spacing of the solids [23], but prevents in any case, a normal orientation. We conclude that the orientation of the PTSA must be parallel to the layers.
The relevance of this approach lies in the chemical modification of the materials, which allow the introduction of functional groups to the anions intercalated in the brucite-like layer. In previous work, researchers demonstrate that PTSA generates higher acidity for the selective form in catalytic reactions of interest [24-25].
FTIR absorption
Figure 4 presents the IR absorption spectrum of PTSA characterized by an intense band between 400 and 1200 cm-1, another region with lower absorption intensity between 1200 and 1800 cm-1 and a further region with small absorptions between 2600 and 3200 cm-1. According to Ristova et al. [26], CH interactions are assigned at 491 cm-1 for the scission vibration (δ), the out-of-plane bending vibration (γ) is assigned at 813 cm-1, the deformation modes of the CH and CH3 groups with bands at 1380 cm-1 are due to the δCH of the ring. The bands at 1405, 1454, and 1497 cm-1 are attributed to the deformation modes of the CH3 groups. Finally, the bands at 2932, 2962, and 2989 cm-1 correspond to stretching vibrations. The SO3 - interactions correspond to asymmetric deformations (δas) at 548 cm-1 and at 1123 cm-1, symmetric deformations (δs) at 672 cm-1, and symmetric vibrations (νs) at 1000 cm-1. The ring CC interactions are assigned at 562 cm-1 due to scissoring vibration. Those at 1031 cm-1 and 1096 cm-1 correspond to vibration (ν) and at 1596 cm-1 due to the stretching mode. The large band between 2500 cm-1 and 3200 cm-1 is probably due to the OH bonds of the hydrated acid, which correlates with the strain band near of 1647 cm-1.
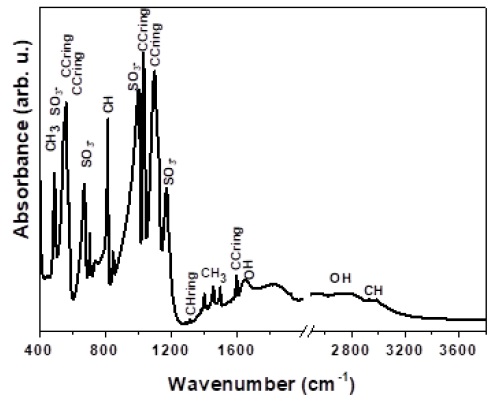
Figure 5 shows the IR spectra of LDH samples at room temperature and annealed at 400 °C, respectively. The four spectra are similar at room temperature (RT) with absorptions in the low wavenumber (500-1400 cm-1) mainly due to PTSA. In this region we observed that the symmetric and asymmetric bands of the SO3 - group are shifted to 1011 cm-1 and 1172 cm-1, respectively. This shift appears to be the result from the interaction between the PTSA molecule and the LDH surface. At higher wavenumbers, absorptions due to CH stretching (2990 cm-1) and OH stretching (3445 cm-1) are observed. A strong peak at 1375 cm-1 can be observed due to symmetric bending of the CH3 group of toluene. The increasing concentration of PTSA is confirmed because its intensity increases with increasing concentration, demonstrated by X-ray diffraction. The presence of an electrostatic bond between the sulfonate group and the outer surface of LDH may be implied by the position of the S=O band (asymmetric and symmetric stretching). Any change in this frequency would be due to the interaction of PTSA with the LDH surface. The bands derived from the S-cycle and S-C vibration are located at 1168 cm-1 and 826 cm-1 respectively. The infrared spectrum of synthetic MgAl-LDH contained PTSA as intercalating anions shows the presence of a strong band a 1142 cm-1 corresponding to S=O vibrations, which is characteristic of sulphate anions in a Td (free ion) symmetry. Other bands at 1164, 1122, and 1062 cm−1, show the characteristics of sulphate ion in a C2v symmetry (bridge bidentate ligand) [27].
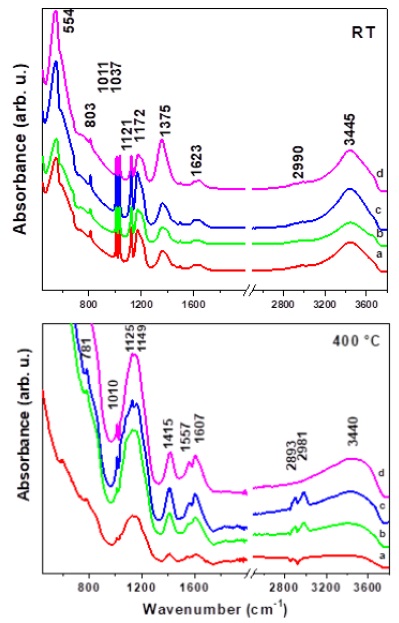
Figure 5 FTIR spectrum at room temperature and at 400 °C, of a) LDHS-PTSA30, b) LDHS- PTSA50, c) LDHS-PTSA70, and d) LDHS- PTSA100.
At 400 °C, the LDH spectra with different concentrations of PTSA are strongly modified in comparison with the samples at room temperature. The samples showed an intense band at 3400 cm−1 due to the O-H stretching of the hydroxyl. C-H stretching bending modes and typical bands due to the -SO3 group were observed at 2963, 2932, and 2842 cm−1 (C-H stretching), 1468 cm−1 (C-H bending), 1215 cm−1 (C-H twisting and -SO3), and 1062 and 826 cm−1 (-SO3). The signal at 803 cm-1 is assigned to aromatic bending. At 2990 cm-1, a peak reveals a CH stretch corresponding to the benzene ring. At 2890 cm-1, the spectrum presents a peak corresponding to C=C-H stretching. It is also observed that at 2990, 1557 and 1415 cm-1 there are evident peaks corresponding to SO2-C-CH3. The breaking of the PTSA molecule upon calcination is attributed to an intense band at 1142 cm-1 and represent the S=O bond coordinated to the LTHS interlayer. Meanwhile, the peaks at 1606 and 1557 cm-1 correspond to the C-C stretching in the benzene ring [28].
Raman spectroscopy
The Raman spectrum of PTSA at room temperature is shown in Figure 6. In accordance to previous authors [28-29], our spectrum in mainly characterized by two regions: the first one between 600 and 1700 cm-1, and the second one between 2800 and 3200 cm-1. According to those authors, the main bands of the first region are at 637 cm-1 (δSO2), 802 and 818 cm-1, as a result of the C-S stretching vibration of the acid (SO3H) and ion (SO3 -), respectively. It is followed by the νCC at 1014 cm-1, the symmetric stretching of the -SO3 - at 1045 cm-1, and the two vibrations of the -SO3H acid at 1127 and 1190 cm-1 [29].
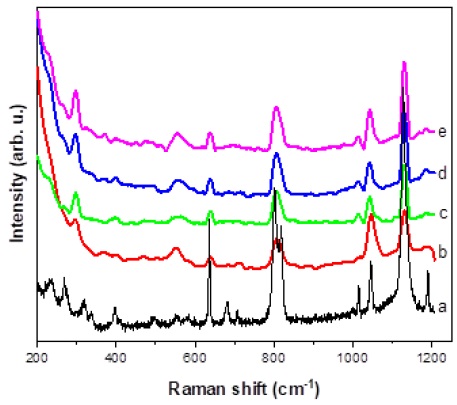
Figure 6 Raman spectra at room temperature of a) LDH, b) LDH- PTSA30, c) LDH- PTSA50, d) LDH- PTSA70, e) LDH- PTSA100.
Afterwards, the bands at 1380, 1456 and 1601 cm-1 due to δCH(ring), δas(CH3) and C-C stretching of the ring, were detected, respectively. In the second region, the common CH3 stretching vibrations at 2936, 2968, and 2991 cm-1, and the C-H stretching of the ring at 3070 cm-1 are also seen. We can notice that both acid and ionized forms coexist in the PTSA sample [30].
Figure 6 shows also, the Raman spectra of the LDH samples at different concentrations of PTSA. The main PTSA bands mentioned above are present. Noteworthy are the peaks at 1045 and 1131 cm-1 that are attributed to the -SO3 - ion and the -SO3H acid group, respectively. This means that both forms are also visible in the compounds, but with higher concentration of the acid form in correlation with the increase of PTSA concentration, corroborated by the rise of intensity for the band at 1131 cm-1 with respect to that at 1045 cm-1. Moreover, the latter shows a relatively constant intensity in all four samples, whereas the others acid bands have an increasing intensity with rising concentration.
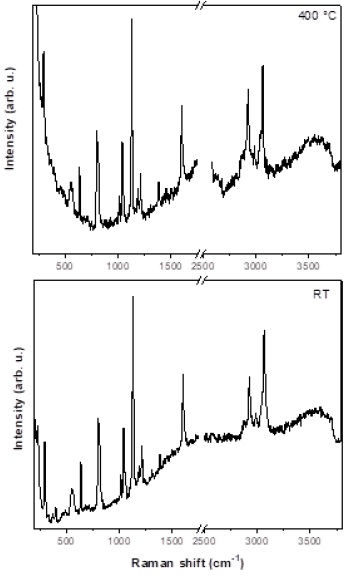
By comparing the LDH- PTSA50 spectra at room temperature and at 400 °C (Figure 7), bands corresponding to PTSA close to 200-1600 cm-1, and 2000-4000 cm-1 are found, respectively, indicating that PTSA is stable in LDHS materials. In addition, peaks are located at 637 cm-1 (δSO2), 802, and 818 cm-1 due to the stretching vibration of C-S in the acid (SO3H) and ion (SO3-), respectively. Following are the νCC at 1014 cm-1, and the symmetric stretching of the -SO3 - at 1045 cm-1, then the two vibrations of the -SO3H acid at 1127 and 1190 cm-1. At both temperatures, similar peaks are found in the 2000-4000 cm-1 region, only bands the νCC at 3200 and 2900 cm-1 approximately were found, due to the presence of the PTSA’s functional groups.
13 C NMR
Similarly, but pronounced, interactions effects are noted in the 13C NMR spectra (Figure 8a). The resonance peaks located at 113.9 and 143.75 ppm are attributed to the carbon atoms C1(CH2) and C5(C-SO3), respectively. The C2(CH) is located at 143.21 ppm. Finally, the aromatic carbons in the para-position C4 at 129.162 ppm were observed.
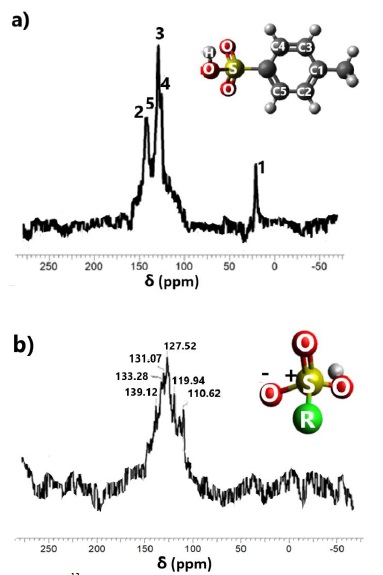
The adsorption induces an upward displacement of the C1, C2 and C5 carbon atoms, corresponding to a shielding effect. This is consistent with an electrostatic interaction of the SO3 function with the LDH surface. The PTSA adsorption induces an upward field shift for the C5 and C2 carbon atom. As before and underlined by the adsorption measurements, this is consistent with an interaction with the clay surface due to the resonance of the aromatic carbons, however, a large scattering is apparent at the C1 resonance peak.
When LDHs-PTSA is calcined at 400 °C and the structure collapses (Figure 8b). Previously, the assignment at C1 was due to the resonance effect in the aromatic ring, but for Figure 8bbthis signal disappeared, confirming the collapse of the aromatic ring by the signal at 127 ppm, corresponding to the C3 position (organic Figure 8a). Figure 8b shows in the range of 150-100 ppm the signals corresponding to alkenes and aromatics carbons, originated by the decomposition of the aromatic ring (R radical).
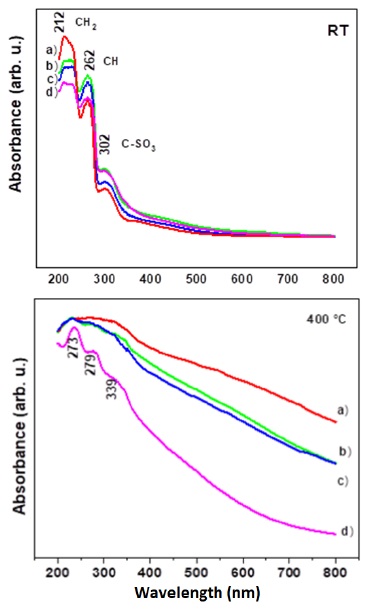
Comparing the NMR results by FTIR and Raman spectroscopies, it was realized that the radical groups are close to the sulphate group. Therefore, we propose that the structures were collapsed but contain the sulphate group in the structure. The decomposition of the organic portion of these materials occurred by partial combustion, giving rise to reduced species such as carbon and sulphide anions that have electronic transitions at 212, 262, and 306 cm-1. Such transitions are given by various energy lost excited states and no noticeable changes in the characteristics are shown, but only a decrease in intensity with decreasing PTSA concentration. Benzene strongly adsorbs at 202 cm-1 and other weak adsorption waves in the 230-270 cm-1 interval. In many reports, the benzene is reported at 260 cm-1 [30], this signal in particular, was altered by interactions of the sulfonic and substituents methyl groups on paring aromatics. The transitions at 212 cm-1 are due to S=O groups and the band at 306 cm-1 corresponds to the interaction of sulphonic groups with LHDs.
UV-Vis absorption
The UV-Vis spectra at room temperature present the signals of interaction between PTSA and LDHs (Figure 9a). The adsorption induces an upward shift of the C1, C2 and C5 carbon atoms, which corresponds to a shielding effect. This effect is consistent with an electrostatic interaction of the SO3 function with the LDH surface. The PTSA adsorption induces an upward shift for the C5 and C2 carbon atom, and the signals correspond to C1(CH2), C2(CH) and C5(C-SO3), respectively. As previously underlined by the adsorption measurements, this is consistent with an interaction with the clay surface due to the resonance of the aromatic carbons, however, a large scattering at the C1 resonance peak is observed.
Figure 9b depicts the UV-Vis spectra of LHDs with PTSA at different concentrations and calcined at 400 °C. Figure 9b shows again the collapse of the sulphonic p-toluene acid, whose possibility of rupture is demonstrated by 13C RMN and FITR spectroscopies. By UV-Vis method, signals at 273, 279, and 339 nm were observed, corresponding to transitions n→π* of C=C conjugates. The signal at 339 nm again corresponds to the electronic transitions of S=O with the interaction of the collapsed LDH surface.
Conclusions
According to the results, we can conclude that the interaction between the hydrophobic chains of PTSA is a very important feature to its intercalation into LDHs, not only due to its aggregation into micelles, but also due to its tendency to self-organize in the interlayer domain maximizing their interactions. The intercalated PTSA has a basal spacing ranging from 8 to 8.5 Å, the increase in the interlayer distance due to the intercalations of the explained in terms of the arrangement of PTSA molecules in the interlayer. This small increase is due to PTSA adsorption and is confirmed by the characteristic signals observed by UV-Vis, Raman, NMR 13C and FTIR spectroscopies. Excellent absorption capacity was shown in the interlayer space. When the LDH material was calcined at 400 °C, structure collapse was demonstrated by different characterization techniques, finding that aluminum and magnesium oxides matched with PCPDF charts 075-0788 and 077-2179, respectively, also the results were supported with UV-Vis and NMR 13C.

