


 nova página do texto(beta)
 Inglês (pdf)
 Artigo em XML
 Referências do artigo
 Enviar este artigo por email
 Citado por SciELO
  Similares em
SciELO
Similares em
SciELO 
 Permalink
Introduction
The degradation of organic based materials is a complicated process related to a wide variety of environmental and intrinsic aspects. Even though the understanding of this process is of common interest, its study is often a neglected area of research. In the particular case of paper, the comprehension of the degradation process plays an important role concerning dating and preservation of the material [1].
The use of paper in documents and artwork over history that extends to the present day highlights the importance of monitoring the deterioration process which includes aspects such as aging, loss of permanence and durability [2]. In this sense, internal and external factors influence the aging process of paper. In this work, we focus on the internal factors, namely those that correspond to structural properties of the paper and therefore its chemical composition. In particular, we monitor the structural evolution of the paper throughout its optical behavior as it ages.
Non-destructive techniques like ATR-IR spectroscopy [3-7], ultrasonic methods [8,9], IR and Raman spectroscopy [10-17], and atomic force microscopy [18], have been used to follow the deterioration process in different types of paper. These techniques exhibit the presence of a degrading effect on paper exposed to accelerated aging treatment [3]. Most of the previous studies on the paper deterioration analyzed pure cellulose and/or pulps [19], and no attention was given to the accelerated aging of real paper [20]. There is virtually no work on paper deterioration in real conditions, mainly due to the low rate of paper degradation for which many years of monitoring are necessary.
In previous work, we reported a new technique based on laser-induced fluorescence to evaluate the aging stage of different paper samples with the same manufacturing process at different times [21].
The primary purpose of this study is monitoring the conservation state of cultural heritage items, for which we analyzed laser-printer paper. In this case, cellulose being their main constituent, although the ancient paper was made entirely from linear long cellulose fibers while contemporary paper can be manufactured from short cellulose fibers as its main component and hemicellulose and lignin of wood as secondary components [22], this last degrades easily [6,23].
The method implemented uses emission fluorescence measurements to observe the aging behavior, this simple technique permits the distinction between ancient and modern documents, gives us information about the paper degradation in its first aging stages [21], allows to detect chemical variations, as well as to monitor its structural evolution. The method also provides an estimation of the manufacture date based on changes occurred at a structural level of the paper.
Cellulose is a linear polymer of β-D-glucose in the pyranose form linked between them by 1,4-glycosidic bonds. Two main reactions prevail during the paper degradation, one about the glycosidic bonds hydrolysis and the other related with the glucopyranose rings oxidation. These reactions take place simultaneously in the natural aging process of paper. In a first stage, the cellulose-glycosidic bonds are cleaved causing a reduction of their polymerization degree and in its aging stage. The deterioration is rapid, provoking the diminishing of the fluorescent band located at 620 nm, which we associated with the presence of short chains, a diminish intensity is interpreted as degradation or elimination of the short chains [21], whereas an increase of intensity, resulting from treatment paper, is interpreted as structural restitution of the short chains.
This work reports on the feasibility of studying the cellulose chains in paper subjected to natural aging by using emission fluorescence. This technique allowed registering the paper fluorescence emission and associate a fluorescence intensity reduction with a denaturalization of the cellulose chains. Also, the paper was subjected to a restoration procedure consisted in reintegrate to the paper structure the cellulose components contained in a solution based on wood extracts and ethyl alcohol. We proved that the treated paper recovers its first fluorescence emission as a result of the reincorporation of short chains in the paper structure.
Experimental details
As a first instance in the experiment, a stock solution was prepared using 25 pieces of pine wood (each one of about 1 g) without any further treatment. Each wood piece was left to rest in 500 ml of ethyl alcohol for about one month in a hermetic transparent glass recipient, in a dimly lit room, and under ambient conditions. This procedure allowed to extract the wood components similarly as the one used to age wine in oak barrels [24,25].
The experiment consisted of the analysis of four samples with the same original structure and a variation on their date of manufacture ranging between new paper and five-year-old paper, this last being corroborated by their content. Small pieces of each one of the samples were immersed in 50 ml of the previously prepared stock solution during 6, 12 and 24 h. Then, these samples were left to dry under ambient conditions during one week to later measure their optical behavior via fluorescence spectroscopy to determine the degree of short-chain restitution acquired. Each of these samples was subjected to fluorescence spectroscopy measurement before any treatment so that their optical behavior and therefore the short chain degradation state was evaluated.
The emission spectra were obtained by irradiating the paper with an excitation source, in this case using an Omnicrome argon ion laser with a maximum power output of 3 W, laser spot of 2 mm, and tube current of 10 mv/A, with a line at 488 nm. A fiber optic with a probe at 45° of incidence angle and a colored glass filter of 550 nm was used to guide the collected fluorescence light to a high-resolution spectrometer Ocean Optics, Inc. model SF2000. As a whole, this configuration allows to obtain the fluorescence contribution of the organic compounds in the paper and, measure the discrepancies between the original samples and the ones subjected to treatment for each different immersion time. The above configuration was maintained for all the samples to compare the fluorescence intensity between the paper samples. In this study, it does not consider non-fibrous components of the paper.
Results and discussion
The typical steady-state fluorescence emission spectra of the wood show broadband extended from 378 nm to 750 nm with a width at half-maximum (FWHM) of about 115 nm [26]. This band exhibits two maximums located at 488 nm and 580 nm. Then, the fluorescence emission spectrum of wood can be decomposed using two Gaussians curves, one maximum coincides with the Gaussian curve centered at 488 nm, and the second maximum corresponds with the Gaussian curve centered at 580 nm [26]. This last subband gives information related to the photosynthetic processes in components such as chlorophyll species, and cellulose. In the case of paper, the cellulose is formed as a result of the glucose’s photosynthesis [27]. In this sense, the subband located at 580 nm was selected to analyze the emission fluorescence of the paper samples, for that, an argon ion laser was used as excitation source due that its wavelength of 488 nm allows exciting between 520 to 940 nm. In previous work, we showed that this sub-band gives information related to structural changes in organic compounds. In particular, we proved that the relative intensity of this band is related with the concentration of wood extract components, showing that fluorescence emission is an appropriate technique to analyze the stored time of some alcoholic beverages [26].
Figure 1(a) shows the fluorescence spectra of print paper with one, two, and five years old, as well as one sample of new print paper. The age labels in the curves of Figure 1 were estimated from the paper content, even though this procedure is a crude approach to estimate the paper date, all samples correspond to the same type, but fabricated at different times. The emission spectra of the new paper show notorious changes in a few years, these changes have been related to structural aging of the short chains in the paper. The emission spectrum of the new paper shown in Figure 1(a) presents three peaks, one located at 616 nm (labeled as peak 1) and the second, centered at 622 nm (labeled as peak 2), and small contribution was observed at 561 nm (labeled as peak 3). Then, in the paper with one-year aging, the intensity of the peak 3 increases significantly, and, in general, it is accompanied of a red-shift [21], whereas the peak 1 present a blue-shift to finally be located at 575 nm; the intensity of the second peak diminishes and has a blue-shift toward 620 nm. This behavior has been related to changes occurred in the paper at the structural level.

In the two years aged paper, the intensity of the peak 2 continues decreasing while the peak 1 has a slight diminishing, that, viewed concerning to the one-year aged sample. Finally, the fluorescence emission of the paper with five-years aging shows more significant variations concerning one and two years aged paper. In this case, peak 1 remains at 579 nm while peak 2 shifts to 613 nm, both peaks intensities decreased significantly. Also, in the five-years-old paper, peak 3 is at 560 nm. The intensity of this last contribution increases rapidly and then remains approximately constant as it was previously reported in [21]. The contribution at 560 nm has been assigned to the prevalence of the cellulose large chains and its behavior is because these components degrade lesser than the short chains, like lignine. Figure 1(b) shows a deconvolution of the five-years aged paper, showing three contributions to the emission spectra. The intensities behavior of the emission fluorescence of the paper with 5-year aged shows is associated with a rapid denaturalization of the cellulose chains. In this sense, the intensity of the peak 2 decreases faster during the first years and then is maintained without important changes, on the other hand, the intensity of peak 3 grows rapidly and then it is maintained approximately constant. This behavior is due to a rapid paper degradation presented in the first times of the aging and which was associated with the denaturation of the short chains of the wood structure, and with the permanence of the large chains associated with the behavior of the peak 3. Also, when paper ages, the peak 3 tend to have a red-shift while the peak 2 presents a blue-shift with a tendency to decrease its intensity according to the paper age. This behavior is related to homogeneous depolymerization which takes place because of hydrolysis, oxidation and crosslinking reactions in the paper when ages. [19,20,28]. According to the fluorescence emission spectra, the blue-shift and the increasing intensity of the peak 1, together with decreasing intensity of the peak 2, results from a rapid denaturation of the cellulose compounds in the paper when it is naturally aged.
The structural components of wood are cellulose, hemicellulose, and lignin, together with a small number of pectic substances. Then, polysaccharides represent a significant component in both, softwoods and hardwoods, being the principal polysaccharide the cellulose. All these components contain hydroxyl groups, which are the most reactive sites. Results indicate that saccharides diminish, hemicelluloses degraded faster than cellulose, and hemicellulose to glucose ratio decreases linearly when paper ages. In general, in the first stage of aging, paper deterioration is rapid. This result agrees with artificial-accelerated aging of newsprint paper, in which a diminishing on the polymerization degree was observed [20]. In the first stage of deterioration, the cellulose glycosidic bonds are cleaved, which cause a rapid reduction of the polymerization degree in the first aging stage [20], causing a diminishing of the peak located above 600 nm.
One may wonder whether such modifications give a faithful description of those taking place in natural aging processes, accord with previous conclusions, by using spectroscopic measurements [29]. However, the observed changes in the emission spectra of the aged paper indicate that the paper denaturalization was given from changes occurred on its structure[21]. In this sense, the peaks intensity of the fluorescence spectra is related with the presence of large and short chains of the wood, mainly cellulose, hemicellulose and lignin, all these presents in the paper. Previous results indicate that the intensity of the second peak decreases faster during the first years and then is maintained with minor changes [21]. In the present case, Figure 2 shows the diminishing intensity of peak 2, normalized concerning the intensity of the new paper, which indicates a deterioration of the short chains in the paper. This behavior corroborates the discussion about the rapid paper degradation in the first times of its aging.
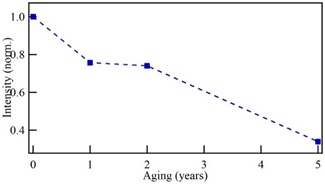
Figure 3 shows a fluorescence spectra comparison between new paper and the two-years sample without treatment (0 h), and the ones immersed in an alcoholic solution with the woods extract during 6, 18 and 24 h. The measurement of the emission spectrum of the original paper agrees with previous reports, indicating that it has around of two years old [21]. Fluorescence spectra were normalized to the maximum intensity; however, the comparison is possible because it was used intensity ratio between peak 2 with respect to peak 1 (i2/i1), which is independent of the total intensity of the spectra. This procedure is universal because is independent of the experimental fluorescence emission configuration and it allows to detect small changes in the fluorescence spectra. In the sample subjected to immersion treatment in alcoholic solution, the intensity of the peak 1 decreases with the immersion time. Then, for the aged paper without treatment, the intensity ratio between the second and the first peaks is i2/i1 = 1.00. This value increases according to the immersion time. For the paper with 6 h immersion, i2/i1 = 1.01. Then, immersed sample during 18 h presents a significant variation in its fluorescence spectrum, the intensity of the first peak decreases, whereas the intensity of the second peak increases, giving an intensities ratio i2/i1 = 1.05. Finally, the paper immersed during 24 h originates a spectrum with the most significant variations respecting the original aged sample. In this case, the intensities ratio is 2.50, which is similar to the intensity ratio of the new paper (i2/i1 = 2.54). Also, the sample subjected to immersion for 24 h acquires the typical shape of a non-aged paper.
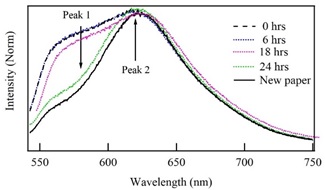
Figure 3 Comparison of the fluorescence spectra of the new paper with the two-years sample without treatment (0 h) and the ones previously immersed in a solution with alcohol and wood extracts during 6, 18 and 24 h.
Figure 3 also shows the emission spectrum of the paper subjected to an immersion of 24 h in the alcoholic solution with the wood extracts (green line) and the emission spectrum of one recent paper without any treatment (continuous black line). The fluorescence spectra of both samples exhibit similar characteristics, indicating the short cellulose chains have been re-incorporated to the aged paper structure. Also, the position of second peak maximum of the restored paper with 24 h of treatment in alcohol coincides with the maximum of the new paper, which ensures restitution of its original structure.
Figure 4 summarizes the peaks intensities behavior for aged paper subjected to cellulose chains restitution in alcoholic mediums. The obtained behavior corroborates the discussion on the rapid paper degradation at the initial stage of its aging, associated with a short chains denaturation and the permanence of the large chains of the wood structure. The first peak of the emission spectrum is associated with the behavior of the short chains while the second peak has been related with the permanence of the large chains. The reincorporation of short chains in the paper structure can be accomplished by immersing the paper in an alcohol solution containing wood extracts during 24 h. Then, by using alcohol as water media is obtained restoration efficiency of around 99%.
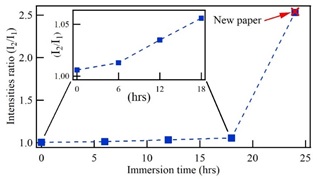
Figure 4 Intensity ratio of peak 2 to peak 1 in the fluorescence spectra regarding immersion time of the paper in alcoholic solutions with extracts of wood.
The increase of the first peak of the fluorescence spectra has been associated with a denaturalization of the cellulose short chains as a result of the natural aging of the paper. Thus, restitution of cellulose short chains in alcohol solution produces incorporation of these chains in the paper structure, resulting the fluorescence spectra recover their original characteristics. Then, by subjecting the paper in a solution with extracts of wood during 24 h, produces a reincorporation of short chains on the paper, recovering the structure that it had initially.
Figure 5 shows two photographs of an aged paper sample subjected to a restitution procedure for 24 h, in the alcoholic-based solution with the wood components. It is observed that paper does not lose its main properties and the print text remains unaltered after the treatment, indicating that this method could be used in the structural restoration of historical documentary.

Conclusions
Denaturalization of the short cellulose chains, mainly lignin, is an important aspect in the degradation and therefore aging of paper. Measurement of the fluorescent emissions corresponding to old and new paper with the same original structure has proved to be an excellent method to estimate differences in date of manufacture. This work proposes a method to restore the short cellulose chains in aged paper consisting of immersion of the material in a solution containing wood extracts, which include lignin, for a 24 h. The evidence obtained from the analysis of the fluorescence spectra indicates that this procedure allows the restoration of almost 100% of the original paper structure. Thus, providing a conceivable and low-cost scheme of preservation for the material

