


 nova página do texto(beta)
 Inglês (pdf)
 Artigo em XML
 Referências do artigo
 Enviar este artigo por email
 Citado por SciELO
  Similares em
SciELO
Similares em
SciELO 
 Permalink
Introduction
Zirconia (t-ZrO2, m-ZrO2 and c-ZrO2) is a very important material due to its wide range of applications, which include catalysis, gas sensors, solid-oxide fuel cells, biomaterials, among others [1-4]. For a long time ZrO2 has been used as dental implants and recently Gutierrez et al., have reported on the potential application of YSZ (yttria-stabilized zirconia) as cranial implants [5-6].
It is well known that amorphous zirconium hydroxide can be transformed into t-ZrO2 and subsequently this polymorph can be transformed into m-ZrO2 [7-11]. Li et al. have determined that the complete transformation of Zr(OH)4 follow the steps: Zr(OH)4 to t-ZrO2 to t-ZrO2+m-ZrO2 and finally to m-ZrO2 [7]. Sato has described the transformation as follows: Zr(OH)4 to amorphous ZrO2 to t-ZrO2 to t-ZrO2+m-ZrO2.Various research groups have extensively studied the t-ZrO2 to m-ZrO2 transformation [7,10,12]. While obtaining t-ZrO2 from zirconium hydroxide, these studies do not include the determination of both the time and temperature required to achieve the transformation. Livage et al. have reported that amorphous zirconia initiates its crystallization at 290 °C, reaching no more than 25 % of crystallinity for 7 days of treatment. Applying a thermal treatment at 300 and 315 °C for several days still produces an incomplete crystallization. On the other hand, 100 % crystallization is completed under a thermal treatment at 348 °C during 8 hours, with 90 % achieved during the first 4 hours. [13]. Glushkova et al. have reported the crystallization process as a function of time at 200, 250, 275 and 300 °C, and they compare their results with those reported by Livage et al. [14].
Roberts et al. have analyzed the influence of the thermal ageing on the tetragonal to monoclinic phase transformation in the near-surface regions of ZrO2 [15]. Denkewicz et al. have investigated the isothermal transformation of t-ZrO2 and m-ZrO2 prepared by the hydrothermal method [16]. Nishizawa et al. have obtained hydrothermally the cubic phase of zirconia (c-ZrO2) and studied its transformation to m-ZrO2[17]. To study the crystallization process for Ni78Si8B14 alloys, Baró et al. have used the DSC technique, by applying isothermal treatments [18]. They showed that the crystallization process can be studied if monitoring the heat flow as a function of time. The presence of an exothermic peak indicates the glass to crystal transition. To the best of our knowledge the DSC technique, as a function of time, has not yet been used to study the amorphous Zr(OH)4 to t-ZrO2 transformation.
In this work, we determined both the time and temperature necessary to transform commercially available zirconium hydroxide into tetragonal zirconia. Isothermal treatments were applied to the starting material using a calorimeter. The heat flow was monitored as a function of time by DSC. Finally, Raman spectroscopy helped following the formation of t-ZrO2. Our results show that the starting material transforms as follow: amorphous Zr(OH)4 to amorphous ZrO2 (a-ZrO2) to t-ZrO2, this is in well agreement with previously published results by several research groups.
Experimental details
Sample preparation
Commercially available Zr(OH)4 (Sigma-Aldrich, 97 % purity) without further treatment was used as the starting material. Isothermal treatments at 350, 365, 370, 375 and 380 °C were done utilizing a calorimeter (TA instruments, SDT Q600). A heating rate of 20 °C/min was applied to reach the temperature of the isothermal treatment. The thermal treatment time was variable depending on the temperature. Finally, the sample was slowly cooled down to room temperature. All experiments were carried out in an O2 flow (100 ml/min).
Sample characterization
Zr(OH)4 was studied by calorimetry with the equipment described earlier. Simultaneous TG and DSC measurements were done as a function of time. The time in each measurement varied depending on temperature. Raman spectra were acquired with a spectrometer Labram HR800 of Jobin-Yvon-Horiba. A He-Ne laser (wavelength: 632.8 nm and laser power: 25 μW) was focused on the sample with the objective lens of an Olympus BX-41 microscope. Finally, IR spectra were measured by using a FT-IR Spectrometer (IR Prestige 21, Shimadzu).
Results and Discussion
Figure 1 shows (a) Raman and (b) IR spectra corresponding to the commercial zirconium hydroxide. The Raman band at 560 cm-1 indicates that Zr(OH)4 is amorphous and it is in good agreement with the results reported by Picquart et al. [9]. Bands corresponding to OH vibrations (3315 and 1629 cm-1) are present in the IR spectrum 1(b), these bands are typical for zirconium hydroxide [10]. The total mass loss of the commercial Zr(OH)4 was 26 % when heated up to 1200 °C, obtaining the monoclinic phase (results not showed here). However, the tetragonal intermediate phase appears and disappears in the 300-400 °C range. Therefore, the aim of this work was to study the Zr(OH)4 to a-ZrO2 to t-ZrO2 transformation. Commercial zirconium hydroxide was isothermally treated at 350, 365, 370, 375 and 380 °C. These temperatures were chosen according to the work of Livage et al. [13].
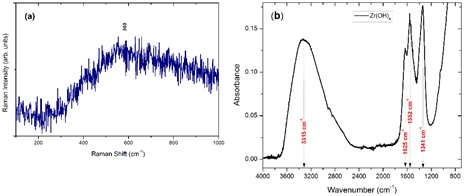
Figure 2 shows three graphs as a function of time: the temperature ramp 1 applied in the thermal treatment (black lines), the thermogravimetric curve (blue line) and the DSC profile (red line). This is an example of the thermal treatment as a function of time applied to the commercial zirconium hydroxide. As one can see the temperature ramp consist of three steps. First, an increment on the temperature under a heating rate of 20 °C/min, after that, an isothermal treatment for a fixed time is applied, and finally the cooling stage of the sample. The isothermal treatment time is established by the up rise of the exothermic peak as it can be observed in the DSC profile. In the first 18 minutes, during the heating, one can notice that the starting material losses 24 % of its mass (see blue line). In the same period of time, an endothermic peak appears in the DSC profile due to the heat consumption during the dehydroxylation of the Zr(OH)4. After that, the mass stays constant during the isothermal treatment and an exothermic peak appears. This peak indicates that an amorphous material to crystalline t-ZrO2 transformation takes place. Also, from this graph we can conclude that the material after the dehydroxylation is amorphous-ZrO2 (the mass is kept constant). We have corroborated by Raman spectroscopy that the t-ZrO2 phase is present when the exothermic peak has been formed. The presence and features of the exothermic peak depend on the isothermal treatment temperature. With these experiments one can determine with high precision the temperature and the time necessary for the t-ZrO2 formation.
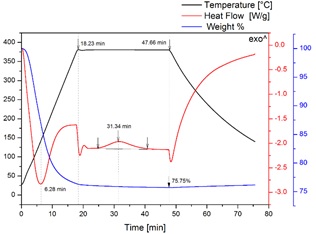
Figure 2 Temperature ramp (black lines), thermogravimetric curve (blue line) and the DSC profile (red line) during the thermal treatment of commercial Zr(OH).
Figure 3 shows a set of graphs of heat flow as a function of time, only for the isothermal interval (see Figure 2). Various experiments were carried out in a similar way to that described in the former paragraph. In all graphs, an exothermic peak is present, this behaviour is in good agreement with that reported by Baró et al. found in the crystallization process for Ni78Si8B14 alloys [18]. Therefore, the presence of the exothermic peak indicates the transition from amorphous-ZrO2 to t-ZrO2. The exothermic peak shifts to shorter times and becomes narrower when temperature Increases, as it can be observed in Figures 3(a)-3(e). The maxima of the peaks are at: 114.39, 41.26, 26.55, 18.56 and 11.85 min for 350, 365, 370, 375 and 380 °C, respectively. The broadening of the exothermic peak is related to the time necessary to complete the crystallization process.
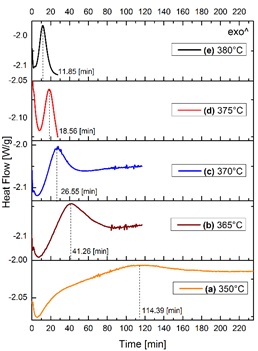
Figure 3 Heat flow as a function of time of zirconium hydroxide samples isothermally treated at different temperatures.
Figure 4 shows Raman spectra for commercial Zr(OH)4 and the samples obtained at various isothermal treatments in the calorimeter. When zirconium hydroxide was isothermally treated at 350 °C for 240 min, the Raman spectrum 4(a) shows bands corresponding to the t-ZrO2. All the Raman bands in the spectrum 4(a) correspond to the t-ZrO2 crystalline phase [19,20]. This Raman spectrum corresponds to the sample after thermal treatment accordingly to the DSC profile (Figure 2(a)). Therefore, this result indicates that the presence of the exothermic peak is directly related to the formation of t-ZrO2. At 365 and 370 °C treatment temperature for 120 min the Raman spectra 4(b)-4(c) present almost the same bands that the one at 350 °C.
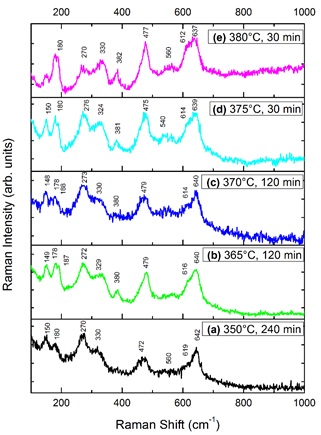
These Raman spectra indicate that ordering of the atoms to form the crystalline structure can initiate at temperatures as low as 350 °C, but the time of thermal treatment has to be longer. For the highest temperatures 375 °C and 380 °C, the isothermal treatment time necessary to crystallize the a-ZrO2 becomes shorter. The Raman spectra 4(d)-4(e) show peaks, which correspond to the t-ZrO2, indicating that 30 min of treatment are sufficient time to obtain the t-ZrO2 crystalline phase. We must notice that some of the peaks in the spectra 4(b)-4(e) correspond to the monoclinic phase of ZrO2 (m-ZrO2) [7,9,12]. This shows that the thermal stability interval of t-ZrO2 is very narrow.
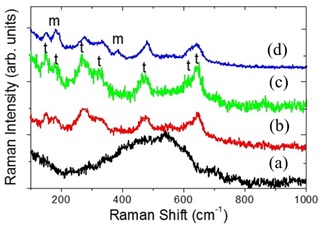
Figure 5 show Raman spectra corresponding to Zr(OH)4 isothermally treated at 370 °C for different times. For 10 min, spectrum 5(a), the presence of a wide band indicates that the material is amorphous ZrO2 [9]. For longer times, the crystallization process is completed, as it is evidenced by the presence of peaks in Raman spectra 5(b)-5(d), corresponding to the t-ZrO2 phase. For 30 min and 60 min, spectra 5(b) and 5(c), Raman peaks appear which correspond to the ZrO2 tetragonal phase. For 120 min, spectrum 5(d), the presence of two peaks at 181 and 380 cm-1 indicates that the monoclinic phase of ZrO2 can be induced by increasing the isothermal treatment time, producing a mixture of tetragonal and monoclinic phases of ZrO2 [7,9,12].
Conclusions
The potential of the time-resolved DSC to study the dehydroxilation process, and the amorphous-crystalline transitions to obtain metallic oxide crystalline phases, has been presented in this work. The Zr(OH)4 to a-ZrO2 to t-ZrO2 transformation thermally induced was studied in detail for the temperature range 350 to 380 °C. A calorimetric method to thermally treat commercial zirconium hydroxide was successfully employed. In this manner, dehydroxylation takes place in the first instance, while in the second step the crystallization of amorphous-ZrO2 gives rise to the formation of t-ZrO2. By means of isothermal treatments, it was possible to determine with high precision both the time and temperature necessaries to obtain the t-ZrO2 crystalline phase. Our Raman spectroscopy results indicate that it takes longer to form the crystalline structure at 350 °C. In contrast, it takes only a few minutes to obtain crystalline t-ZrO2 at 380 °C.

