


 nueva página del texto (beta)
 Inglés (pdf)
 Artículo en XML
 Referencias del artículo
 Enviar artículo por email
 Citado por SciELO
  Similares en
SciELO
Similares en
SciELO 
 Permalink
Introduction
In recent years, the studies for new nonlinear optical materials have been increasing interest, due to the numerous applications, such as characterization of biological nano-markers, chemical and biological sensors, energy transport, thermal materials, and photothermal therapy, in general in nanoscience and nanotechnology. For this, the Z-scan technique has been widely used, due to versatility of applications in optical study of nonlinear index of refraction, n 2 , and the nonlinear absorption coefficient, β [1, 2]. On the other hand, the cRIO9074 system is a reconfigurable embedded control and data acquisition system. This controller offers powerful stand-alone embedded execution for deterministic LabVIEW Real-Time applications. Additionally, cRIO9074 is programmed with LabVIEW. It is a graphical programming language that uses icons instead of lines of text to create applications. In contrast to text-based programming languages, where instructions determine program execution, LabVIEW uses dataflow programming, where the flow of data determines execution. In LabVIEW, the programmer builds a user interface with a set of tools and objects. The front panel is user interface, and the block diagram contains code of functions to control the front panel objects, using graphical representations. Then LabIEW can be used in a variety of embedded control and monitoring applications, like to Z-scan [3, 4]. To characterize different types of nanofluids the Z-scan technique was implemented using NI cRIO 9074 system. This technique was implemented in the Facultad de Medicina of the Universidad Autonoma del Estado de Mexico. In this work, the steps for the implementation of the Z-scan technique are described. Finally, the system was tested with Au nanofluids. The results showed the nonlinear optical properties of these samples.
NI cRIO9074 system and BSC203 driver communication
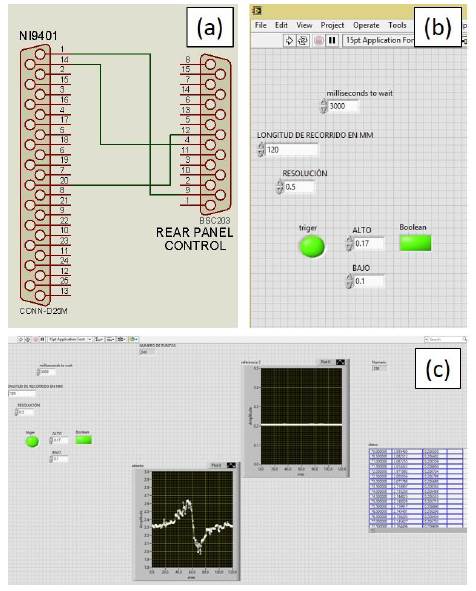
The BSC203 is a driver of THORLABS for linear translation stages and it has different protocols of communication like to USB, RS232, Ethernet and TTL signals (trigger in/out). TTL communication between cRIO9074 and BSC203 was used. For this communication, the cRIO9074 used NI9401 module was also used. This module is an 8-channel bidirectional digital, which received and send TTL signals to BSC203. In the Figure 1(a) this connection is shown, where the DB25 and DB15 connectors correspond to NI9401 and BSC203 respectively.
Construction of program on LabVIEW
The Z-scan program contains "while loop" and "case structure" instructions. The program has five parts. The first is the introduction of parameters for Z-scan such as scanning length, scan resolution and variation tolerance laser (Figure 1(b)). The second part is the start trigger, it has three conditions before of data acquisition, one is the trigger output of BSC203 and the other is the reference sensor signal (Dr). When the reference voltage is higher than "BAJO" and lower than "ALTO", the data acquisition begins. The module NI9234 provides this signal reference. These conditions are shown in Figure 2(a).

Figure 2 (a) Conditions to begin the data acquisition; (b) Data acquisition; (c) Data table in block diagram.
The next part is three-sensor data acquisition. The first sensor is the reference phototransistor (Dr); the second is the closed aperture (Dc) and third is open aperture (Do). These signals are the RMS values (Figure 2(b)).
The fourth part of program is the advance of linear translation stage. This advance depends on the scan resolution. In the case of Au nanofluid, it is 0.5mm. Finally, a table received the experimental data (Figure 2(c)). These data are processed and fits with the equation 2 in Origin to determine the nonlinear refraction index.
Then in general, the program in LabVIEW after the RUN, it calculates the number of measures, then it waits for the BSC203 trigger, takes the data, writes in the table and sends a trigger for next measure, and so on until the number of measures is completed. The control panel is shown in Figure 1(c).
Experimental set-up
The implementation of all optic parts of the z-scan technique begins with the characterization of diode laser. In this case ω 0 = 30.1 μm (this laser beam waist at the focus length was calculated with ω = 450 μιη) and the Rayleigh length was found to be satisfied the basic criteria of the Z-scan experiment, I 0 = 1.75 KW/cm2 is the on-axis irradiance at focus (z = 0), λ= 532 nm [6]. A microcontroller circuit modulated the laser to 10 Hz. The lens (L1) is 8 cm focal length. Other important part is the alignment; ensuring that the laser is perpendicular to the lens, sample and detectors. Also, the Linear Translation Stage should to be parallel to Z axis. The Figure 3 shows the experimental set-up.
To calculate the nonlinear refractive index (n2) were used the next equations [2,4].
Where L eff = (1 - exp(-a0L))/α0 is the effective length of nonlinear medium, k = 2π/λ is the wave vector, α0 is the linear absorption coefficient of the samples (L denotes the sample thick-ness), ΔΦ o is induced phase shift, proportional at the transmittance variation between peak and valley positions describe for Eq. 2.
Where z is the position, z 0 is the Rayleigh length, finally the induced phase shift is determinates by Eq. 3.
Here S is the linear transmittance of the aperture. The sample was scanned along a Z-axis by our system.
Results and Discussion
The synthesized sample was composed of Au nanoparticles of 30 nm in average diameter and the tested sample consists of an Au nanofluid with 0.033 mmol in 3 ml of water (initial concentration). After characterization, it had a SPR to 520 nm. The nanofluid was placed in a quartz cuvette of 1mm of optical thickness. All the experiments were performed at room temperature. In addition, was diluted two ml of nanofluid with 0.5 ml of water, until get four samples, the last was 50 % nanofluid and 50 % of water to observed the signal of Z-scan respect to concentration. Figure 4(a - e) shows the closed aperture Z-scan curves obtained for Au nanofluids.
Figure 4 Au nanofluid (a) Initial concentration (2 ml); (b) - (e) Successive dilutions with 0.5 ml, 1.0 ml, 1.5 ml and 2.0 ml water.
The circle symbols represent the experimental data and the solid lines is the theoretical fit. The experimental data show symmetry curves. The peak followed by valley illustrates a self-focusing effect for a negative change in refraction. The solid lines show the theoretical fitting using a well-known normalized transmittance. In Table 1 these experiments are summarizing.
Table 1 Data summary for Z-scan experiments
| Au nanofluid / water (mL) | ΔTp-v | ΔΦ0 | α (cm-1) | n2(cm2/W) x 10-7 |
|---|---|---|---|---|
| 2/0 | 0.55 | 1.61 | 0.65 | -8.02 ± 0.02 |
| 2/0.5 | 0.528 | 1.55 | 0.38 | -7.60 ± 0.03 |
| 2/1 | 0.403 | 1.18 | 0.30 | -5.78 ± 0.03 |
| 2/1.5 | 0.315 | 0.92 | 0.17 | -4.49 ± 0.04 |
| 2/2 | 0.274 | 0.80 | 0.22 | -3.91 ± 0.03 |
It is important to specify that there are many works on the synthesis of nanoparticles with different experimental conditions such as the size of the nanoparticle, the type of concentration, solvent stabilizer and solvent type [7-15]. Therefore, these differences cause different effects on colloid nonlinearities. Esmacil Shahriari et al. [11] found nonlinear refractive indices using nanoparticles of 30.5 nm particle size and concentration of 2.3 × 10⁻³ M in water. These results are very similar to those obtained in this work. In both papers, reduction reactions (redox) where a salt of gold is reduce for nanoparticles synthesis are used. These results are very similar to those obtained in this work.
Finally, Marcano et al. [14], in laboratory practice made inexpensive experiments for observing thermal lens and Z-scan for a sample of iodine in ethanol, in which there is no automatic control system for the experimental data with greater accuracy. Therefore, in this work, automation system by controlling the linear actuator and synchronization with the laser pulse with a more versatile and fast application was proposed.
Conclusion
The implementation of the Z-scan technique using NI cRIO 9074 system is functional and the results show coherence with other author's obtained values of refractive index coefficient nonlinear of similar order [11]. The implementation of this system with NI cRIO 9074 system offers flexible implementation and is relatively simple, compared to other techniques in optic laboratories [14]. In addition, it can be seen that the measurements are accurate and reliable.

