


 nova página do texto(beta)
 Inglês (pdf)
 Artigo em XML
 Referências do artigo
 Enviar este artigo por email
 Citado por SciELO
  Similares em
SciELO
Similares em
SciELO 
 Permalink
Introduction
Disorders such as arthritis, osteoporosis, osteonecrosis, bone tumor and bone fracture due to illness and trauma affect hundreds of millions of people across the world [1]. Particularly, osteoporosis is characterized by low bone mass that often results in fracture, the majority of these fractures occur in elderly patients [2].
In recent years, there have been researched on using biomaterials to treat bone loss or failure, because when they are used in human and animals, these are able to repair and positively influence the growth of cells [3]. Chitosan (Cs) is a very useful biomaterial in orthopedics for its excellent biocompatibility and physical properties, allowing to be applied in bone tissue engineering. Thus, this polymer has been widely used in bone regeneration alone or in combination with various materials. Beside Cs also has demonstrated antiseptic and antibacterial activities and its integration to bone do not represent septic problems [4].
Cs has potential for use in regenerative medicine to restore the functions of damaged tissues and organs. This has fostered the study of this biopolymer in artificial tissues, including bone, cartilage, nerves, blood vessels and skin. The knowledge of chemistry and biochemistry of Cs has given as result the use of this biopolymer in repairing or replace of diseased or wounded tissues [5].
The benefits that Cs offers to bone are attributed to its chemical structure. Cs is a copolymer of ß[1→4]-linked 2-acetamido-2-deoxy-D-glucopyranose and 2-amino-2-deoxy-ß-D-glucopyranose generally obtained by alkaline deacetylation of chitin [6]. These properties contrast with bone characteristics.
Bone is a complex biological material that contains between 10 and 20 wt% water. From the dry mass, approximately from 60 to 70 wt% is bone mineral and the rest is mainly a collagen fiber protein [7,8]. The crystal mineral phase is constituted of hydroxyapatite (HA), which is characterized by the presence of OH-1 and PO4 -3 ions [9].
All bones contain a compact and dense outer shell of cortical bone (CorBn), and a spongy structure named cancellous bone (CanBn), whose structures are composed of lamellas containing only subtle differences. The CorBn lamella presents repeating sets of unidirectional orientations, while the CanBn lamella shows one of the two unidirectional fibril sets, some of which are aligned with the long axis of the individual trabecular strut. Additionally, CanBn contains less mineral than CorBn [10,11].
In relation to the above mentioned Cs and bone show surfaces of different nature, for this reason they represent a suitable opportunity to analyze the interface behavior between. Therefore, the aim of this work is to study the interaction between Cs (thickness less than 0.1 µm) and a cow bone, in a system that mimics the human bone.
Materials and methods
Preparation of Cs thin films
Filmogenic Cs solutions were prepared by mixing acetic acid (AC) with Cs for 1 h at room temperature. These solutions were labeled according to the amount of Cs used (wt%), follows by the molarity of each AC solution (Table 1). Each one of these solutions were poured into plastic petri dishes (10 mL), and placed in an oven and dried for 30 h at 50 °C (0.60 atm) until a constant weight was obtained.
CS films on cancellous and cortical bones
CanBn and CorBn specimens were obtained from the hip of a healthy cow (3 years of age, 275 kg). These specimens were subjected to a mechanical treatment to remove the organic tissue. Then, the bare bones were cut into small pieces (1.0 × 0.5 × 0.30 cm3), which were coated using programmed equipment, with dip-coating speed of 20 mm/s with a residence time of 5 sec and 4 cycles of repetition. After that, the coating pieces were dried in a vacuum oven at 50 °C (0.60 atm) for 30 h.
Characterization
Fourier transform infrared (FTIR) spectra were obtained under standard ambient conditions (25 °C, 0.987 atm) in a Bruker Tensor 27 FTIR, with a wave number range of 400 - 4000 cm-1 by ATR. The deacetylation percent of Cs was calculated using the equation Brugnrott [12].
The surface morphology was analyzed by scanning electron microscopy (SEM) in a JEOL JSM-5300 electron microscope under a resolution of 100 nm. Previous to the SEM analysis, the samples were coated with graphite.
Microhardness measurements were carried out by means of a LEITZ WETZLAR tester (7756 model). The pre treatment consisted in dipping the sample into commercial resin, after curing a mirror-polishing process was applied. The tests were carried out under standard ambient conditions. The microindentation was held for 5sec with an applied load (P) at 0.025 Kgf. On each sample, 7 microindentation tests were performed.
Diffraction patterns of the samples were observed by diffraction X-ray (DRX) using an X-ray diffractometer Bruker D8 Advance with primary Göbel mirror optics and scintillation detector. The wavelength was 1.5406 Å of Cu Κɑ1 with 40 kV and 40 mA. Database Powder Diffraction File (PDF-2) International Center of Diffraction Data (ICDD) was used to identify the present phases.
Results and discussion
Structural analysis by FTIR
Figure 1 shows the FTIR spectra of all Cs dry films. Inset A and B show the zoomed view around 3120 and 1600 cm-1 respectively, which correspond to absorptions of OH and NH groups. In both cases, the highest and lowest intensity corresponded to the 1.17Cs and 3.17Cs films, respectively.
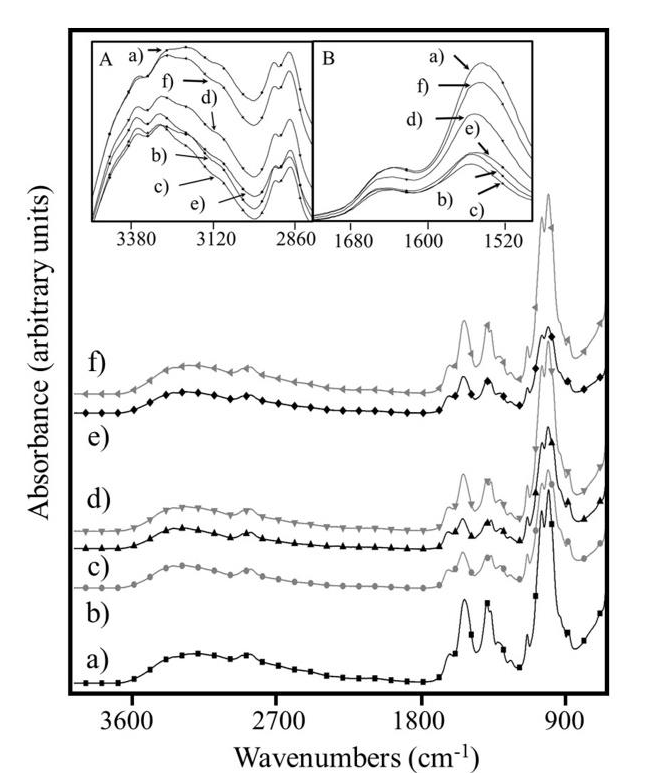
Figure 1 FTIR spectra of a) 1.17Cs, b) 1.30Cs, c) 3.17Cs, d) 3.30Cs, e) 7.17Cs and f) 7.30Cs. Inset A and B are a zoomed view in the range of 3120 and 1600 cm-1 respectively.
The film 1.17Cs exhibited the largest number of free polar groups and the film 3.17Cs presented the lowest number of these groups (with highest intramolecular interactions).
In order to relate the mechanical behavior with the Cs/bone interaction response the 3.17Cs and 3.30Cs films were selected. Based on FTIR data, the degree of deacetylation of Cs was confirmed about 81.77 %.
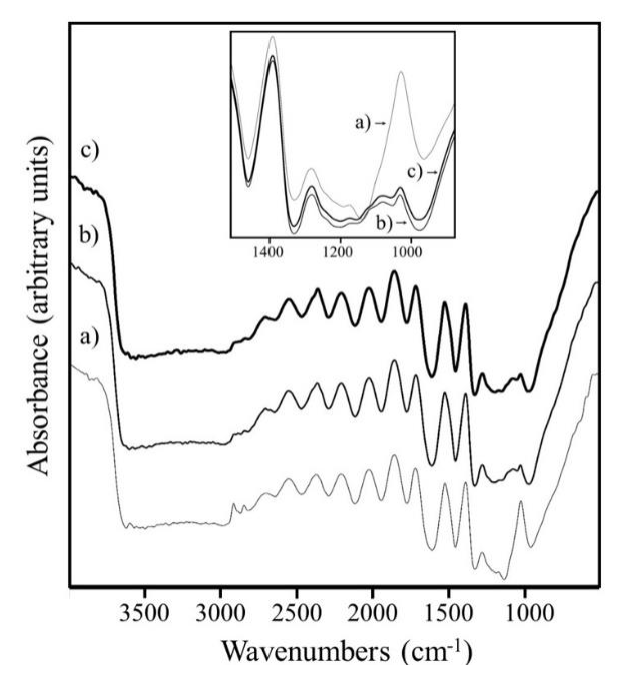
According to Figure 2, signals were related to the hydroxyapatite phase. The band at 1022 cm-1 was assigned to PO4 -3, where the highest intensity was shown for CorBn; so due to collagen, signals at 1550 and 1240 cm-1 showed the presence of organic phase derived of existence of primary and tertiary amides respectively [13,14].

Figures 3 and 4 show the FTIR results of Cs/CanBn and Cs/CorBn respectively. In both cases, the 1022 cm-1 signal (assigned to PO4 -3) decreased by the Cs addition, where samples such as 3.30Cs/CanBn and 3.17Cs/CorBn exhibited the lowest intensities.

Morphological analysis of Cs films, by SEM
Figure 5 shows the SEM analysis of Cs films, where some agglomerations were due to high Cs concentration.

Figure 5 SEM micrographs a) 1.17Cs, b) 1.30Cs, c) 3.17Cs and d) 3.30Cs (at 2000×), e) 7.17Cs and f) 7.30Cs (at 5000×).
The thickness as function of Cs and AC concentration are presented in Figure 6 and Table 2. The highest and lowest values of Cs were obtained at 7 and 1 wt% of Cs respectively. As consequence of the high AC concentration (0.30 M) the values of thickness decreased. This was because the Cs molecules were arranged closely due to an excess of AC.
Mechanical analysis by microhardness
Microindentation hardness testing was performed on Cs/CanBn and Cs/CorBn samples (Table 3). For the CanBn, the sample 3.17Cs/CanBn showed the highest hardness. It was 25.76 % harder than the uncoated bone. After this value, the hardness decreased as effect of an increment in Cs concentration.
Table 3 Microhardness of coated and uncoated bones
| Coating Bone | Microhardness(GPa) | Percent difference of micro-hardness (%) | |
| Bone Uncoated | Bone Coated | ||
| 1.17Cs/CanBn | 28.34 | 29.84 | 5.29 |
| 1.30Cs/CanBn | 28.34 | 34.44 | 21.521 |
| 3.17Cs/CanBn | 28.34 | 35.64 | 25.76 |
| 3.30Cs/CanBn | 28.34 | 22.05 | -22.19 |
| 7.17Cs/CanBn | 28.34 | 18.3 | -35.43 |
| 7.30Cs/CanBn | 28.34 | 19.5166 | -31.13 |
| 3.17Cs/CorBn | 35.65 | 34.67 | -2.75 |
| 3.30Cs/CorBn | 35.65 | 41.56 | 16.58 |
The sample 3.30Cs/CorBn showed the highest hardness, which was 16.58 % harder than the uncoated bone, from 35.65 to 41.56 GPa. This increase in hardness indicates the associations of Cs molecules, as well as the association of Cs molecules with bone. Thus, penetration resistance was the result of a tight arrangement between Cs chains.
Phase an alysis, XRD of bone and covered bone
XRD patterns of Cs/bone samples are shown in Figure 7. The existence of Cs in the sample was clearly reveled for signal at 20 °. This crystalline signal was more notorious for the 3. 17Cs/CanBn and 7.30Cs/CanBn samples. However, for the sample 1.30Cs/CanBn did not exist a detectable signal, indicating the absence of crystalline phases. The other signals were characteristics of the compact hexagonal crystal structure of hidroxiapatite [15, 16]. Additionally, strong signals of crystallinity are presented in 1.17Cs/CanBn, 3.17Cs/CanBn, 3.30Cs/CanBn, 7.17Cs/CanBn and 7.30Cs/CanBn samples. Thus, the crystallinity was increased as consequence of an increase in the AC concentration. Figure 8 shows the XRD patterns of CorBn 3.17Cs/CorBn and 3.30Cs/CorBn. These results gave evidence of the presence of Cs, indicating that Cs has been embedded into the bone matrix. Moreover, it was observed that crystallinity was increased because of AC concentration. Thus, the 3.30Cs /CorBn exhibited the higher crystallinity.

Figure 7 XRD patterns of a) CanBn, b) 1.17Cs/CaBn, c) 1.30Cs/CanBn, d) 3.17Cs/CanBn, e) 3.30Cs/CanBn, f) 7.17Cs/CanBn and g) 7.30Cs/CanBn.

Conclusions
The presence of inter- and intramolecular forces of attraction improved the orientation of chitosan chains. It occurred at intermediate chitosan concentrations (i.e. 3.17Cs and 3.30Cs), where the number of free polar groups were lower than other samples. According to this, for CanBn and CorBn the highest crystallinity on both surfaces was observed at intermediate chitosan concentrations (i.e. 3.17Cs/CanBn and 3.30Cs/CorBn). These results were also consistent with the increase of the hardness values, since in our study the 3.17Cs/CanBn and 3.30Cs/CorBn samples increased their hardness 25.76 % and 16.58 % respectively, in relation to the uncoated bone.

