


 nova página do texto(beta)
 Inglês (pdf)
 Artigo em XML
 Referências do artigo
 Enviar este artigo por email
 Citado por SciELO
  Similares em
SciELO
Similares em
SciELO 
 Permalink
Introduction
Biomolecular interaction without the fluorescent marking is a primary object of investigation in the biosensing area of study. In the field of biology, it is usually monitored and quantified by means of stable systems such as enzyme-linked immunosorbent assay (ELISA), fluorescent microarrays or the Western-Blott technique, among others [1,2]. These techniques usually use secondary probes joined with the captured analytes that at the same time are detected with fluorescent reagents or bound to enzymes converting in this way the appearance of biomolecules of interest into a measurable electric signal [3].
Efficient monitoring of the primary interaction between molecular targets and analytes could simplify these techniques significantly. On the other hand, the techniques of free detection of marking [4-6] based on the electric, electromechanic or optical methods, such as surface plasmon resonance (SPR) or surface plasmon resonance imaging (SPRi), have created the basis for the fabrication of the commercial detection systems [7,8]. Nevertheless, there have been scarce studies concerning the structure of biomolecular interactions in microarrays. For that reason, this work lays out the description of the protein-protein interaction of microsites of bovine serum albumin printed on the flat biofunctional gold/glass substrates by means of Atomic Force Microscopy (AFM) and optical profilometry using interferometer with Michelson configuration [3,9].
Phase Shifting Interferometry (PSI). This type of interferometric technique is based on the Michelson configuration and use it at least three sample intensities for extracting the optical phase where the desired information is. Then, the surface thickness, profile or roughness can be obtained by this technique with high resolution and accuracy. In this optical setup two light beams; one coming from a reference surface and the other one coming from the surface under test, are mixed at the photodetector surface (CCD), see Figure 2b, giving rise to an light intensity mathematically described by
where 𝜙 (х,у) is the optical phase difference, and I S and I R are the sample S and reference R beam intensities, respectively, which depend of the reflectivity of each surfaces. On the other hand, γ is related to the coherence length of the light source and, in our case, it can be discarded because it is almost constant in the measurement range.
The usefulness and versatility of optical interference for surface thickness measurement lies on the fact that at normal incidence, the polarization and oblique dependence of the reflected intensities are discarded, thus, the optical path difference can be expressed as:
where λ is the wavelength of the light source, ո is the protein effective refractive index, and d is the length difference in the path of the light beams which can be a function of the spatial coordinates x and y. In our proposal, it is assumed that the refraction index is uniform and when binding occurs, only the parameter d is changed because the rest of the setup remains constant. Thus, d is directly related to the spot thickness and it can be increased or reduced as a consequence of the interaction. Typically, the protein effective refractive index is around 1.57 [7].
Regarding to (1), we need only the optical phase difference 𝜙 to estimate the spot thickness d, having four unknown parameters, I S , I R , γ, and 𝜙(χ,y). Thus, to find d we use the well-known four-step method to get the optical phase 𝜙 [10]. In this method, the reference mirror is moved into four different positions whereas the optical intensity (interferogram) is recorded at each position by means of a Charge-Coupled Device (CCD). Then, four interferograms are recorded simultaneously at multiple points and at high velocity, in our case the speed was the composite video rate (30 frames per second).
At this context, the optical intensity at each position can be described as:
where
The four-step algorithm requires that four separate interferograms, of the sample under test, should be recorded and digitalized. For simplicity, a 90o optical phase shift is introduced into the reference beam between each of the sequentially recorded interferograms. Because we are using a He-Ne Laser at the red line emission (λ = 632.8nm) we need to move the reference mirror at four different positions separated by 79.1 nm, in order to achieve a 90o phase difference among each interferogram.
Thus, the four-recorded interferograms are described by
Where I 1(x,y), I 2(x,y), I 3(x,y) and I 4(x,y) are the pixel intensities at the four different positions of the reference mirror.
By means of simple algebraic manipulations we can solve for the optical phase,
Finally,
The above described procedure, so called the four-step phase shifting method, was automatized by means of a homemade Labview® virtual instrument (VI). Before the measurement, we calibrated the optical profiler by using a commercial Thick Step Height Standard.
The final step in the optical profilometry technique is related to the range of the optical phase. If the optical phase extends the 0 - 2π range, because the measured d is enough large greater than λ/2, then it will be wrapped, and an unwrapping algorithm is needed. The unwrapping algorithm give us the real range of the optical phase and consequently, the real extension of the measured d. Here we used the Flynn's Algorithm, because the signal to noise ratio was visually better and enough to identify the d measurements, among different samples having different concentrations.
Finally, the unpacked image is processed to convert it into the image with the altitude in the corresponding points (x,y), the same as the one shown on the screen by the software and from which we determine the values of the altitudes of interest [11,12]. The computational time spent to acquire and to process the four images is around forty seconds for a 640 pixels × 480 pixels image, but in general, it depends of the speed processor of the computer and the image size.
Experimental Details
Microrrays of proteins
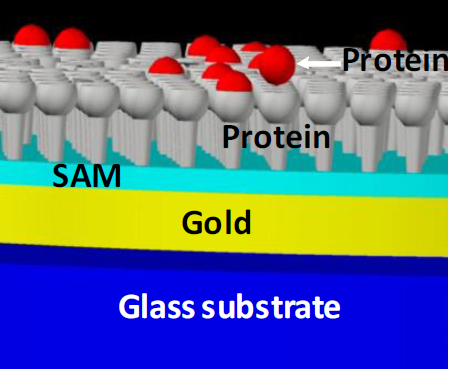
For the purpose of this work, we utilized SPR glass substrates with 45 nm of golden film (Gentel Bioscience) to fabricate the microarrays. The oxides on the surface were removed by the piranha solution (4:1, H2SO4:H2O2) for 10 seconds, washed profoundly with deionized water and ethanol and dried with N2 gas (Infra). Next, we employed the technique of self-assembled molecular (SAM) [13] for organic modification of the gold/glass surface. First, we immersed the substrate in a 10 mM of solution of ethanol of mercaptoundecanoic acid MUA (Sigma-Aldrich) for 48 hours. Next, the substrates were washed with ethanol (reagent grade, Sigma-Aldrich). Beforehand, the SAM was reactivated using a solution of N-(3- dimethylaminopropyl)-N-ethylcarbodiimide (EDC, 5 mM)/ N- hydroxysuccinimide (NHS, 8 mM) in Phosphate Buffered Saline (PBS, 1X, pH 7.4) for 2 hours and washed with deionized water. The microsites or spots were printed on the substrates activated by means of a Nanoprint LM60 robot arm (Arrayit) in lines of bovine serum albumin with the concentrations of 1.0, 0.75, 0.5 and 0.1 mg/ml, whereas the negative control line corresponded to human serum fibrinogen spots (FGN, Sigma-Aldrich) with the concentration of 1.0 mg/ml. From this point, we designed and fabricated a double microarray of 5 spots by 10 spots. The diameter of every spot was 150 μm, whereas the distance from center to center was 450 μm. After the printing the unwashed spots were described using AFM and optical profilometry. For the process of passivation of the surface without the microsensors we utilized a 1% solution of casein for 10 minutes and three PBS cleansings (1X). The interaction of fabricated microsites was performed with antibovine serum albumin or anti-BSA (1.0 mg/ml) for two hours, washing with PBS to eliminate noncovalent interactions [9,14,15-17]. Figure 1 shows a schematic draw of the layers of a typical protein spot printed on a functionalized gold/glass surface. Grey cups represent the printed protein whereas red spheres correspond to the interaction protein.
Michelson interferometer
As we mentioned before, we implemented and calibrated an experimental profilometer as a method to determine the density of the fabricated microarrays, acquired and processed by a homemade software created in Labview®. Figure 2a shows the experimental arrangement of the homemade optical profilometer whereas Figure 2b shows the schematic one.
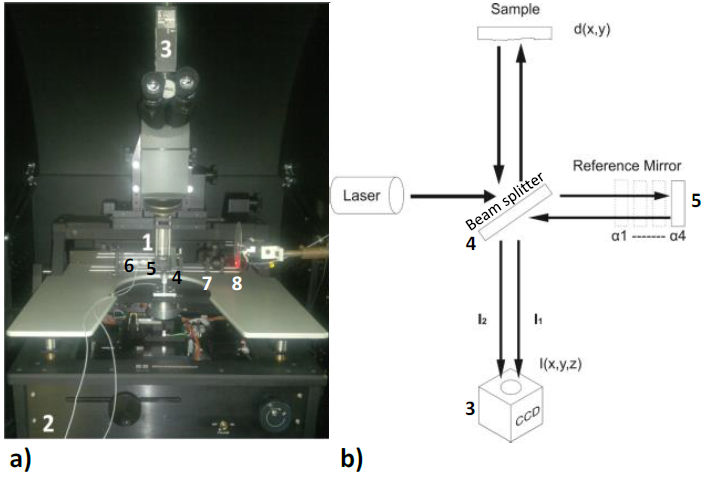
It consists of a red He-Ne laser source; 1) several microscope lens with extra-long working distance and powers of 2X-50X to focus a large number of spots in the microarray; 2) a probe station with the Cartesian system to move the described object; 3) a digital CCD camera Sony XC710 to capture the images; 4) a non-polarizing cube beam splitter; 5) a reference mirror with flat surface ~λ/100 (Optical Flat Edmund optics), which served as the reference plane and with which the beam of light is reflected; and 6) a low voltage nano-positioner (model PI 810.1, Physik Instrumente Inc.) controlled by a voltage piezo amplifier (model E663), used to move the reference mirror at the positions defined by the calibration process. The positions are separated by 79.1 nm to achieve the 90o phase difference among the corresponding interferograms.
The quasi-monochromatic light which emerges from the laser source is collimated with an 7) aspheric lens, and subsequently it is divided into two beams -one which travels to the studied sample and other which arrives to the reference surface.
To reduce the speckle noise, caused by the high coherence of the laser source, we
used a 8) rotating diffuser, which breaks the temporal and spatial coherence of
the light source. Thus, the coherent noise at the acquired interferograms is
highly reduced and the signal to noise ratio improved. In addition, our homemade
optical profiler has the option to acquire several images of the same
interferogram and then get an averaged final image. Regarding with the noise
reduction by the averaging process, it is well known that the noise is reduced
by a factor of
The averaging process helped to reduce the noise artifacts due to vibration mainly.The alignment of the implemented optical profilometer basically consisted in: 1) equalizing the optical paths of both beams (reference and sample) by means of focusing the surface of the reference mirror and the surface of the object of study so that the interference beams would show a high contrast; 2) reducing the noise in the image at signal to noise levels of at least 100. This is obtained by adjusting the CCD parameters like the exposure time, shutter and gain and the rotating diffuser. The interferograms were acquired at 30 frames per second. The above mentioned adjustment allowed us to minimize the shot noise, the blinking effects of CCD and undesirable effects of the rotary diffuser. The last step consisted in the nulling process, which has the purpose of minimizing the number of the observed interference fringes on the screen. It is achieved by modifying the relative inclination of the sample and the reference beams until a uniform background on the screen is observed.
A bright or dark field was achieved by adjusting the position of the reference mirror utilizing a nano-positioner. The implemented system was calibrated using a commercial Thick Step Height Standard of 87.7 nm ± 1.29 nm height (Model: SHS-880QC, VLSI Standards Inc., Serial number: 8897-08-11). The average image correspond at least to 20 measurements, which has an uncertainly close to ± 5 nm in comparison to the SHS-880QC standard.
Capturing the density of protein spots
The images of the microarray spots were captured by means of the CCD camera and they were processed with a homemade virtual instrument developed in the Labview®, software. Due to a tilt of the sample it is necessary to make adjustments by rotation on the screen until a flat surface with different heights on it is observed. Every peak corresponds to a spot in the microarray and the highest point corresponds to its density, whereas the lowest value corresponds to the substrate.
Atomic Force Microscopy
The topography of the surface of microsites was determined by means of an Atomic Force Microscopy (AFM Autoprobe CP Research) in air (Thermomicroscopes, Vecco). We used a RTESPA test probe of Si3N4 with a radius of curvature of 8 nm, resonance frequency of 300 kHz, high symmetric resolution and contact distance of -0.0357 μπι, and applying a constant force of 40 N/m to acquire the images in tapping or dynamic mode with the lens of 50X in the areas of 10, 5 and 2 μm of the surface of the microarrays before and after the protein-protein interaction in order to observe the structure of the adsorption on the functionalized surface as well as structure of the biomolecular interaction, respectively.
Results and Discussion
BSA spots on the functionalized gold/glass substrates
Figure 3 shows the AFM micrographs after the process of printing of the BSA and FGN microsites at the concentrations of 1.0 mg/ml (Figures 3c and 3d) and 0.5 mg/ml (Figure 3b). We observed that the similar forms of the protein adsorption, which look like fern leaves, appear in the area of 20 × 20 μm2, for the concentrations of 1.0 mg/ml, whereas for the concentration of 0.5 mg/ml the BSA structure changes. By comparison, we include an AFM micrograph of the functionalized surface of the gold/glass substrates used for the fabrication of the microarrays (Figure 3a) which presents the average roughness of 1.95 nm in the area of 10 × 10 μm2. In contrast to the reports of the other authors, we observed that the structures of the same proteins change with the nature of the protein and the surface [18,19]. We determined that in the area 5 × 5 μm2 the average roughness RMS (nm) of the FGN spots at the concentration of 1.0 mg/ml and BSA spots at concentrations of 1.0, 0.75, and 0.5 mg/ml corresponded to 44.1, 42.7, 75.9, and 80.5 nm, respectively.
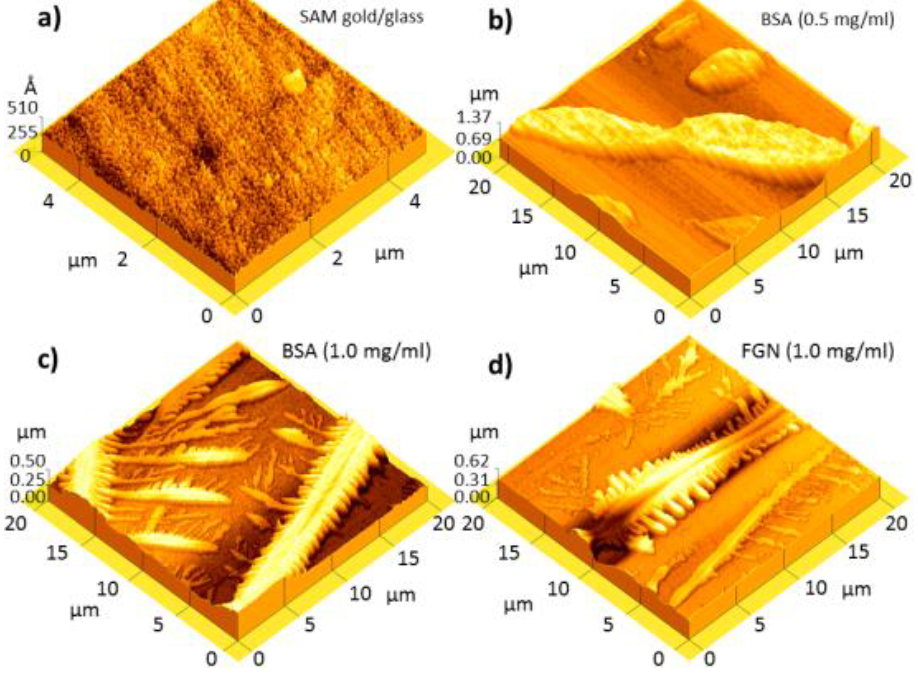
Figure 3 AFM micrographs in the tapping mode of a) functionalized gold/glass substrate (100 μm2) and printed microsites of b) BSA (0.5 mg/ml), c) BSA (1.0 mg/ml) and d) FGN (1.0 mg/ml) at 400 μm2
That is, for the high concentrations of FGN and BSA we obtained the averagely smaller roughness which increased when the concentration of the protein decreased in concordance with the AFM results reported by Vázquez et al. for the FGN and BSA adsorption on the flat substrates of hydroxyapatite [15].
Figure 4 shows the typical images captured by the experimental optical profiler based on the Michelson interferometer used in this work for the specific purpose for the spots printed at concentrations of 1.0 mg/ml of BSA and FGN. In the grey tones, we observed the lines corresponding to 5 repetitions, in two different sub-microarrays of the BSA spots at concentrations of 0.1, 0.5, 0.75, and 1.0 mg/ml, respectively, and of the ones corresponding to the same amount of the FGN control spots (1.0 mg/ml). The surface density (molecules/area) of the not-washed BSA spots is correlated to thicknesses of 957.9 nm (1.0 mg/ml), 636.6 nm (0.75 mg/ml), 639.7 nm (0.5 mg/ml), and 490.4 nm (0.1 mg/ml). The typical curves of the heights of the spots printed using the target solutions of BSA (1.0 mg/ml) and FGN (1.0 mg/ml) determined by the profilometer are shown in Figure 5 (see (8)). The axis z corresponds to the height of the spots and the axis x corresponds to the repeated concentrations of the printed target solution. The violet and red tones indicate the heights for the described spot. The curvature is observed due to the magnification of the lens used in the measurement which covers the area of 4.5 mm × 2.25 mm.
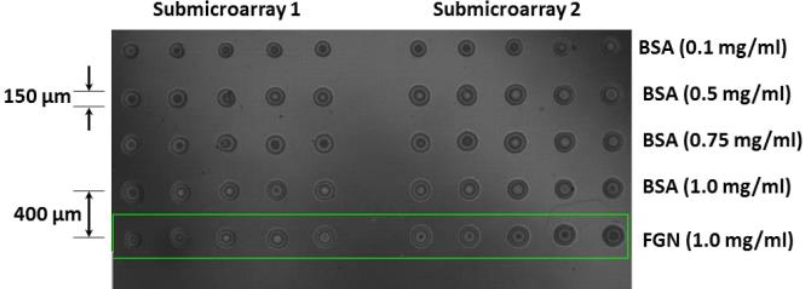
Figure 4 Microarrays of BSA proteins (0.1, 0.5, 0.75, and 1.0 mg/ml) and FGN proteins (1.0 mg/ml) printed by means of the contact technique on the functionalized gold/glass substrates and observed utilizing optic profilometry.
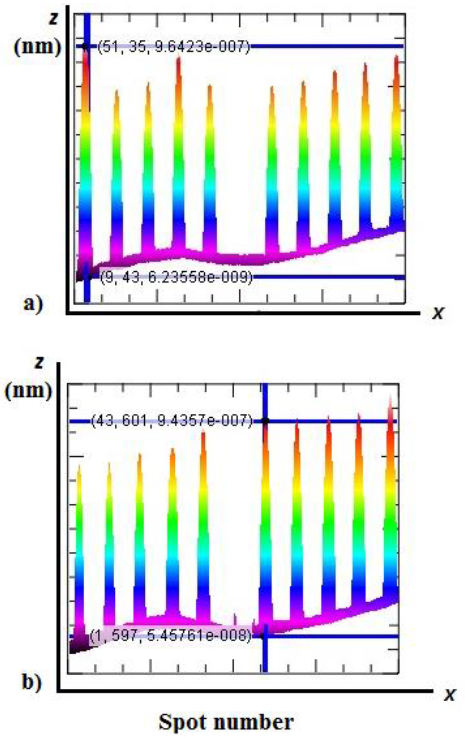
Figure 5 Profiles of the protein microarrays printed on the gold/glass substrates: a) BSA (1.0 mg/ml) and b) FGN (1.0 mg/ml).
Using a baseline in the developed virtual LabView instrument, we removed the pitches which appeared during the reading correcting in this way the discrepancy between the maximum and minimum values for all the spots in the same line.
The protein-protein interaction
After the interaction between the anti-BSA solution (1.0 mg/ml) and the microarray, the morphology and the density were determined again. Figure 6 shows the AFM topography of the BSA microsites fabricated at the concentrations of 1.0 mg/ml (left) and 0.5 mg/ml (right) after the antigen/antibody interaction. We observed that the same patterns of globular structure characteristic for the albumins appear in both samples and their protein density per area unit is smaller in the cases corresponding to spots fabricated at 0.5 mg/ml in comparison to the ones fabricated at BSA concentration (1.0 mg/ml). To be precise, the average RMS roughness in the area of 50 × 50 μm2 for the abovementioned spots was 35.4 and 20.7 nm, respectively due to the smaller number of anchor sites for the smaller concentrations than for the ones corresponding to target solution of 1.0 mg/ml used in the spot imprint. Since the AFM images obtained for the spots fabricated at any concentration show that the albumin did not completely cover the region when they were printed, we can conclude that the granular structure of the golden film only allowed it to anchor in certain regions or that the surface was indeed covered but the force used in the tapping mode only allowed us to obtain certain layers in the intergranular region both in the spots and after the interaction. On the other hand, the profilometry technique allowed us to observe qualitatively the interaction between antigen/antibody of BSA proteins of microarrays fabricated at different BSA concentrations.
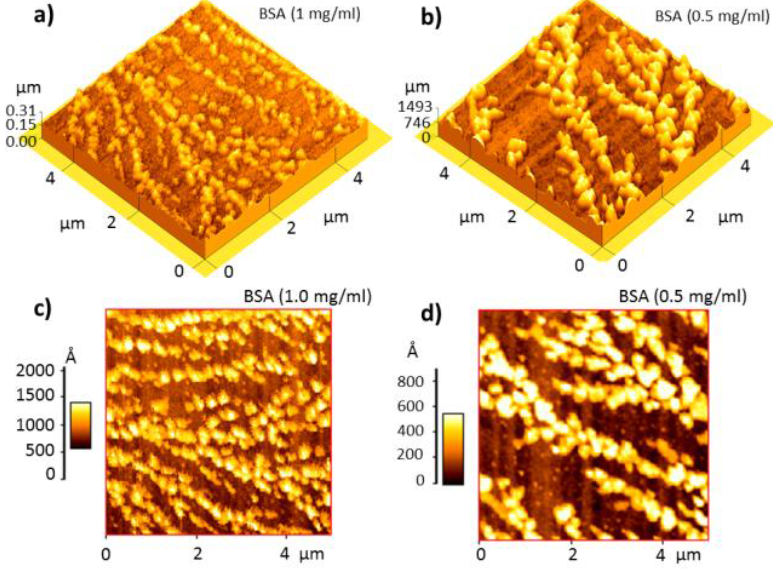
Figure 6 Topographic AFM images in the tapping mode of the antigen/antibody interaction of the anti-BSA (1.0 mg/ml) of the spots printed on the gold/glass of a)-c) BSA (1.0 mg/ml) and b)-d) BSA (0.5 mg/ml), at 5 × 5 μm2.
In Figure 7 we observe that for the FGN control spots (1.0 mg/ml) there is a little contrast between the analyte and the spot, which is expected due to the low homology presented by FGN and anti-BSA (~ 10-8 M), whereas the major luminosity appears in those corresponding to the anti-BSA/BSA interaction due to the fact that these biomolecules are antigen/antibody with a constant affinity of ~ 10-6 M [15,20,21].
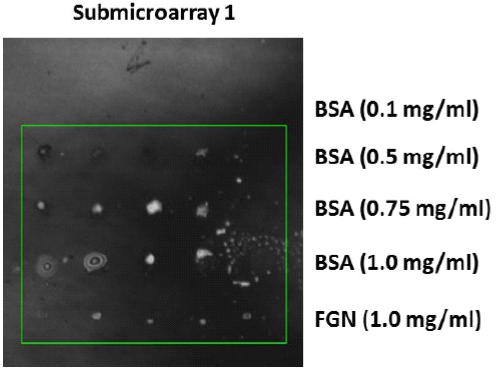
Figure 7 The interaction of the anti-BSA (1.0 mg/ml) with the microarrays of the BSA proteins (0.1, 0.5, 0.75, and 1.0 mg/ml) and FGN proteins (1.0 mg/ml) printed utilizing the contact technique and observed by means of optical profilometry.
For this case we determined that the heights of the profiles of the microarrays after the interaction with anti-BSA (1.0 mg/ml) corresponded to 508.6, 218.0, 170.7, and 130.8 nm for the target solutions of the BSA imprint of 1.0, 0.75, 0.5 and 0.1 mg/ml. Although it was not possible to observe the interaction with the BSA spots (0.1 mg/ml), it was possible to determine the height. It could be due to a low concentration of biomolecules used in the target solution of interest, even when the analyte was at the concentration of 1.0 mg/ml. The difference between the densities of the spots fabricated in the sub-microarrays before and after the interaction is due to not being washed after the imprint but after the biomolecular interaction. It allowed us to demonstrate the sensibility of the optical profilometry for this application.
Summary
We demonstrated that the combined use of AFM in dynamic mode with optical profilometry could be a complementary tool for reading techniques of protein microarrays without molecular marking since they provide information on the structure of the proteins adsorbed from the fabricated microsites, as well as on their densities before or after the biomolecular interactions.

