


 nueva página del texto (beta)
 Inglés (pdf)
 Artículo en XML
 Referencias del artículo
 Enviar artículo por email
 Citado por SciELO
  Similares en
SciELO
Similares en
SciELO 
 Permalink
1. Introduction
Nowadays there is an interest in obtaining LiNbO3 nanoparticles due to its ferroelectric properties and because they present a wide variety of applications in non-linear optics, thin film capacitors, pyroelectric detectors, optical memories, electro-optics modulators, and others [1-5]. As already known, there are several ways to produce LiNbO3, however wet chemical methods are a promising alternative because of its low time-consuming processing steps, moreover the ability to regulate the uniformity of nucleation and improvement in the control of size and morphology of the material [6].
When LiNbO3 is formed by high energy milling, it needs high temperatures and a long calcination time to complete the reaction. This brings up disadvantages like contamination and enlargement of the grain during the material processing period [7]; at the same time it tends to generate a lack of homogeneity in the stoichiometry composition and size of the particle. This is why a great need to develop an alternate synthesis method with a higher quality and an easier reproduction process arises [8]. In general, the wet chemistry method has some benefits with respect to the traditional method, and even compared to other materials, such as Pb and Ti nanoparticles [9,10]. The use of a wet process synthesis methodology is recommended to be performed, taking into consideration that Villegas et al. and Tabata et al. point out that the chemical process has an advantage over the traditional method because it works with lower temperatures and there is more control over the composition and the particle size [11,12].
The processing of LiNbO3 by the co-precipitation method uses H2O as a dispersion medium (solvent). First, the Li2CO3 reacts with the H2O producing LiOH and then we are able to produce solvation with the Nb2O5, and finally obtain the phase of LiNbO3 [13,14].
The synthesis and calcination temperatures were low to avoid phenomena like nucleation and synthetization. This led us to obtain LiNbO3 nanoparticles.
2. Experimental Details.
The precursors employed were Li2CO3 99.999% SigmaAldrich, Nb2O5 99.999% SigmaAldrich and DI H2O. Li2CO3 was mixed with DI H2O until dissolved for about 30 minutes at 85 ºC forming LiOH. After that, the Nb2O5 is added with vigorous agitation for 1 hour, then the powders are dried at room temperature. Finally, the samples are exposed to a thermal treatment at 650 ºC for 12 hours. Time and pH during the reaction were common parameters. The samples were characterized by using PANanalytical XpertPRO diffractometer with Cu Kα radiation and 2θ diffraction angle from 10 to 100 degrees. TGA and DSC analysis of powders were also carried out. Crystal morphology and size were analyzed by SEM. For XPS analysis, a JEOL JPS 9200 with monochromatic Al Ka source with resolution of 0.65 eV was employed.
3. Results
A. TGA, DTA and DSC analysis
In Figure 1, the weight change can be visualized (identified with green), showing a weight loss in the 500-700 oC range possibly because of some remaining water and carbonate vaporization, which is also corroborated by the peak in the temperature difference graph (identified with purple). Heat flow graph (identified with blue) shows the exothermic peak due to the physical structure change [15,16]. Those changes suggest the formation of LiNbO3 phase that will be supported with XRD data below. After 650°C the suggested formation of LiNb3O8 is observed.

B. XRD
The diffractogram shown in Figure 2 reveals that the reaction was successful and it was possible to obtain the LiNbO3 phase when the powders were treated at temperatures of 500, 650 and 800 °C. At 500 °C, the carbonate removal is not complete and signals of the precursor jet are present.
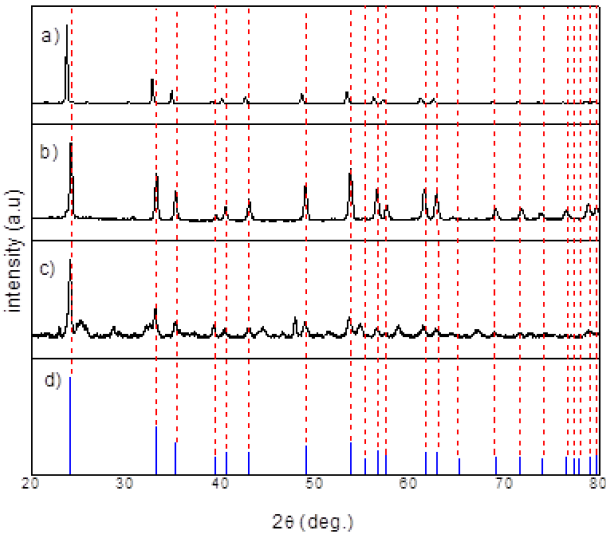
Figure 2 XRD a) 500 °C, b) 650 ° C, c) 800 °C for 12 hr and d) PDF of LiNbO3 [21], obtained LiNbO3 nanoparticle.
At 650 °C, the phase is formed and it should be noted that crystallite size is about 37.6 nm according to the Scherrer equation [17]. At 800 °C, the diffractogram related to LiNb3O8 appears and further increasing the temperature results in a decrease of the phase. Then, with high or low temperature it is possible to have lack or excess of lithium. In addition, the lithium excess is due to possible rearrangements of the structure as residual stress [18]. If there is lithium loss it is due to volatilization during annealing treatment while if there is lithium excess it is due to changes in the atomic structure. This result was observed by Bouquet et al. [19].
C. XPS
The core level signals obtained from the measured LiNbO3 particles were the Nb 3d and O 1s, which verify that the nanoparticles are stoichiometric and are formed without structural defects at the surface.
The Nb 3d signal at 206.8 eV allows the identification of the chemical environment and it was associated with chemically stable niobium. Therefore, it is bound to oxygen and neither oxidation nor reduction is present. The Figure 3 shows a small signal to larger binding energies that is associated with charge density of Nb-O-Li bond at the structure.
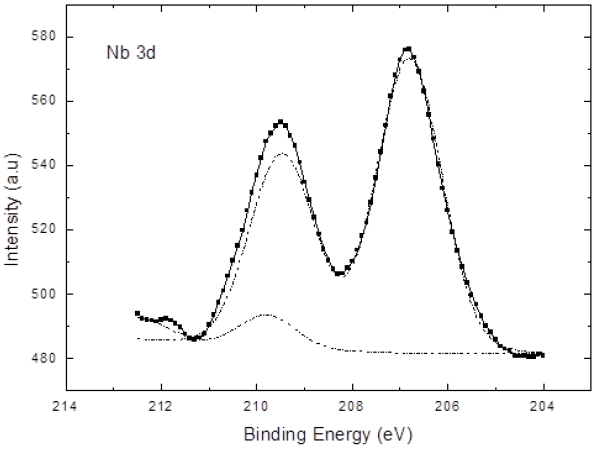
Figure 3 Nb 3d XPS signal is associated to niobium in LiNbO3 with an evidence of signal of low density charge due to Niobium-Oxygen-Lithium.
For O 1s, it is possible to see in Figure 4 that the signal associated to niobium-lithium bonds at 534.4 eV is a contribution of residual oxygen in the particles surface. For 532.4 eV signal, it is associated to LiNbO3 and the 530.5 eV signal is associated to lithium-oxygen bond due to the low binding energy [20].
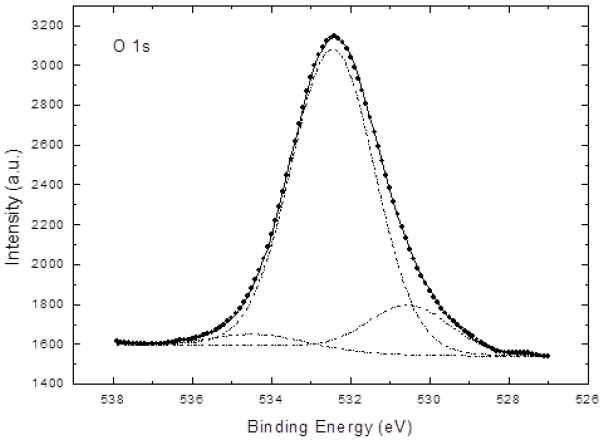
Figure 4 O 1s XPS signal. Identifiable peaks associated to surface oxygen, oxygen in LiNbO3 and oxygen with lithium bond.
These results for the sample treated at 650 °C for 12 h are evidence that with this method the correct phase is obtained and the results are satisfactorily supported by XRD. Therefore, the particles had the required structure and stoichiometry. Then, the stoichiometry is directly related with the loss or excess of lithium observed by XRD. The nanoparticles were stable and were formed without defects at the structure.
D. SEM
The morphology of the samples was qualitatively analyzed using SEM. Figure 5 shows the agglomerated spherical particles.
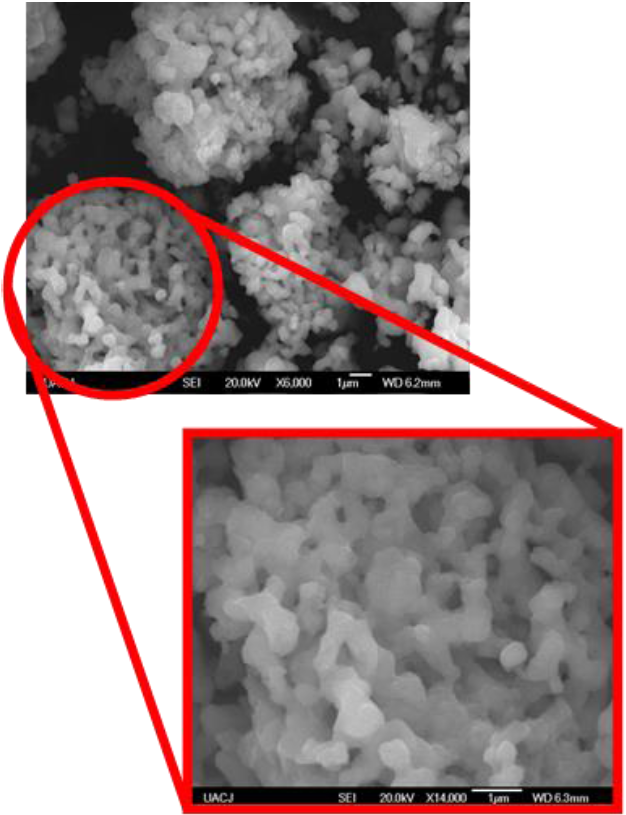
The size of the LiNbO3 nanoparticles was very uniform; it ranged from 100 to 400 nm. The size distribution of the nanoparticles is shown in Figure 6. The control over the particle size is an evidence since the majority are around 200 nm.

4. Discussion
Under low temperature annealing it was possible to achieve the phase of LiNbO3 nanoparticles. The LiNbO3 nanoparticles were obtained by the chemical method at low temperature-energy. This method allows a convenient mechanism in the synthesis of the nanoparticles. Compared to the traditional ceramic method, we can control the phase and particle size. XPS supported the method and there was evidence of the correct phase when compared to XRD results.
The size of the LiNbO3 nanoparticles was uniform (around 200 nm) by using this method. Samples with 85 ºC and 650 ºC thermal treatment at synthesis and sintering, respectively, are the best ways to obtain the desired phase.
Contribution of Li2CO3 dissolution is a principal factor for the reaction. This method has advantages compared with high energy thermal milling (traditional ceramic method), as it consumes less energy, has more control over the temperature, particle size, and the final phase of the nanoparticles. The results of this work could be useful for other LiNbO3 processing techniques to obtain thin films.

