


 nova página do texto(beta)
 Inglês (pdf)
 Artigo em XML
 Referências do artigo
 Enviar este artigo por email
 Citado por SciELO
  Similares em
SciELO
Similares em
SciELO 
 Permalink
1. Introduction
The cochlea is a bony structure conically coiled that encloses the organ of Corti, which is responsible for human hearing. Inside the organ of Corti is located the basilar membrane, whose thickness and stiffness vary along its length. The variation of the characteristics of the membrane allows for selectivity of frequencies. The extracted information is then transmitted by the hair cells to the brain through the cochlear nerve, also called the auditory or acoustic nerve [1][2].
Based on the operating characteristics of a human cochlea, which functions as a frequency analyzer, the intention is to emulate its behavior developing an array of MEMS devices able to discriminate the frequency components of an acoustic signal [3].
Like any structure, each MEMS device has its own natural frequency at which it will vibrate [4]. This feature can be used to design an array of MEMS structures, each one with its own natural frequency, which allows analyzing an acoustic signal in order to obtain the frequency components that comprise it. As an analogy these structures would behave like the strings of a guitar, which when producing a musical note with other instrument, the guitar string corresponding to that note will begin to vibrate without ever being touched.
The natural frequency of a structure is determined by its stiffness and its mass, as shown in the following equation:
where K is the stiffness of the structure and m is its mass [5].
2. Description of Structures
2.1. Cantilever Beam
The first structure to be analyzed is a cantilever beam, which is only used to familiarize, characterize and test the types of analyses that will be performed. The beam has a length of 100µm and a square cross section of 1µm per side, as shown in Figure 1. The beam is fixed in one end and free at the other. The beam material is structural steel with a Young's modulus of 200GPa, a Poisson's ratio of 0.3, and a density of 7850kg/m3.

The first analysis to be performed is a modal analysis in order to find the natural frequencies of the vibration modes. Once the frequency of a desired mode is determined a harmonic analysis is performed, in which an oscillating pressure of 20 Pa is applied to the upper surface of the beam [6]. The frequency of the applied pressure is varied within a known range, depending on the result of the modal analysis, in order to determine the harmonic frequencies and the deformation of the beam. The natural frequencies of the cantilever beam can be calculated using the following equation [7]:
Where E is the Young's Modulus; g is the gravitational force; l is the length of the beam; Kn is a factor that refers to the vibration mode as shown in Table 1; and ω is the load per unit length, including the weight of the beam, whose equation is shown below:
Table 1 Factors for the first five modes of vibrations of the cantilever beam.
| Mode of vibration | Kn |
|---|---|
| 1 | 3.52 |
| 2 | 22 |
| 3 | 61.7 |
| 4 | 121 |
| 5 | 200 |
In equation 3, h is the height, w is the width and ( is the material density of the beam.
Variable I is the second moment of inertia of the beam, which for a beam with rectangular cross section is:
Replacing equations 3 and 4 in equation 2, the natural frequencies of the cantilever beam can be calculated as:
Using equation 5 for the first five modes of vibration, the natural frequencies of the cantilever beam were calculated. These frequencies are shown in Table 2.
2.2. Capacitive Microphones
Other structures to be analyzed are two kinds of capacitive microphones, one of them with a rectangular diaphragm (Figure 2) and the other with a circular diaphragm (Figure 3) [8,9]. Both diaphragms are supported by a double spring arrangement, which allows them to move uniformly. The diaphragms have the same area (120nm2) in order to compare their response and, as in the cantilever structure, the same types of analysis were carried out on these two structures [10].


The rectangular diaphragm is 200 x 600µm and the diameter of the circular diaphragm is 391µm. Both diaphragms have a thickness of 3.5µm. The springs of both structures are 10µm wide, 2µm thick and a gap between them of 5µm. The material used for these two structures is polysilicon, which has a Young's modulus of 160GPa, a Poisson's ratio of 0.23 and a density of 2330kg/m3 [11]. Furthermore, using the structure of circular diaphragm, experiments are conducted through the ANSYS Workbench Optimization Tool, to determine the association of the natural frequency with the device dimensions.
3. Description of the Experiments
3.1. Modal analysis
As mentioned above, this type of analysis is used to determine the resonant frequencies of structures depending on the direction of the force that causes the device to vibrate, that is, the vibration mode [12]. In this analysis, it is important to obtain several modes in order to analyze them and choose the one that suits the type of vibration that the structure is expected to have. Some of the results that can be obtained with this type of analysis are the deformation suffered by the structure and the points of high stress due to each of the vibration modes. The analysis also provides a table (similar to Table 2) in which it can be observed the natural frequencies for each mode of vibration.
3.2. Harmonic analysis
Harmonic analysis is used in order to find the frequency response of a structure when it is subjected to an oscillating load in a certain mode of vibration [13]. This type of analysis is very useful, since there are structures that have harmonic frequencies that are often not considered and may prove to be a major failure factor. Among the results that can be obtained with this type of analysis is the amount of deformation suffered by a structure at a given frequency. Another important result is a graph that shows the deformation of the structure within a defined range of frequencies. Harmonic frequencies are also shown in the graph mentioned above, in the event that they exist in this range.
3.3. Goal driven optimization tool: Design of experiments
Using the goal driven optimization tool is possible to run different experiments with the structures, varying some input parameters within defined ranges, in order to determine the relation of these with a particular response of the structures. Such response could be, for example, deformation, stress, natural frequency, etc. In this tool, three experiments with the circular diaphragm structure are developed, in which the radius of the diaphragm, the width of the springs and the gap between the springs, are change to obtain the variation of the natural frequency and the deformation of the structure when these dimensions vary.
4. Results of the Analysis
4.1. Results for the cantilever beam
The results of the modal analysis of the cantilever beam for the first five modes of vibration are shown in Table 3. Harmonic analysis was performed on the cantilever, forcing a pressure of 20Pa at its upper surface, within a frequency range from 0 to 5 MHz. In the results of this analysis was observed that its natural frequency is around 82kHz (Figure 4).
Table 3 Results of the modal analysis for the first five modes of vibrations of the cantilever beam.
| Mode of vibration | fn (calculated) | fn (simulated) |
|---|---|---|
| 1 | 81.630kHz | 81.582kHz |
| 2 | 510.19kHz | 511.05kHz |
| 3 | 1.4309MHz | 1.4300MHz |
| 4 | 2.8060MHz | 2.7994MHz |
| 5 | 4.6381MHz | 4.6216MHz |

Because the deformations due to the other modes of vibration are much smaller than in the first mode, they cannot be seen in the harmonic analysis. In Figure 4 only the second harmonic can be seen as a small nub around 510kHz. The type of deformations corresponding to the five modes of vibration are shown in Figure 5.

4.2. Results for the rectangular diaphragm
The first simulation performed on the rectangular diaphragm structure described above was a modal analysis. It was determined that the natural frequency of the device for the desired mode is 3.349kHz (Figure 6), which is located within the range of human hearing (20Hz to 20kHz) [14].

Once the natural frequency was known, a harmonic analysis was performed to the structure, which was subjected to a pressure of 80dB within a frequency range from 0 to 10kHz. The response of this analysis can be seen in Figure 8, which shows that in this frequency range there are no harmonic frequencies, only the natural frequency of 3.35kHz exists.
In addition Figure 7 shows that the maximum displacement of the structure at the natural frequency is 24.58µm which is too high if the objective is to build these devices with MEMS technology for surface micromachining.

4.3. Results for the circular diaphragm
A modal analysis was also performed to the circular diaphragm structure. It was determined that the natural frequency of the device in the desired mode is 4.437 kHz (Figure 8), also within the audible frequency range of the human ear.

The next analysis applied to the circular diaphragm structure was the harmonic analysis, where the circular diaphragm was subjected to the same pressure and the same range of frequencies as the rectangular diaphragm structure.
Figure 9 shows that within this frequency range there are no harmonic frequencies and the natural frequency is 4.45kHz.
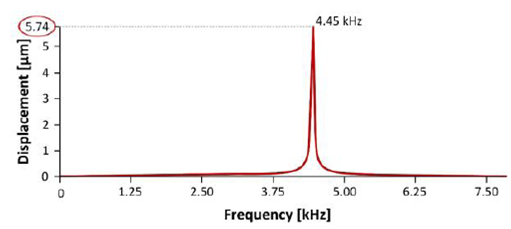
Although the two structures have the same area, this structure has a natural frequency slightly higher than the rectangular diaphragm structure. However, an important aspect found in the frequency response of this structure was that the displacement of the diaphragm is only 5.74µm, which is well below the rectangular diaphragm, but would still need to be reduced, due to the characteristics of the MEMS manufacturing technologies for surface micromachining.
4.4. Results of the experiments
Finally, as mentioned above, three simulation experiments were performed in which some of the dimensions for the circular diaphragm structure were varied. The initial diaphragm with a radius of 250µm, 3.5µm thick, springs with a width of 10µm, a thickness of 2µm and a gap of 5µm was proposed.
With these physical characteristics, both harmonic and modal analysis were performed, determining that the resonance frequency is 2.48kHz (Figure 10).

In the first experiment, the width of the springs was varied from 5µm to 20µm. As shown in equation 1, by increasing the size of the spring, it becomes more rigid, and thus also increases the natural frequency of the device (Figure 11).

Figure 11 also shows the graph of the maximum displacement of the diaphragm. It is clear that there are peaks at some of the natural frequencies, this is important in order to determine how to avoid these dimensions, which could cause the structure to be destroyed.
In the second experiment, the separation between the springs was also varied from 5µm to 20µm. According to equation 1, by increasing the separation between the springs, its flexibility is increased, causing the natural frequency to be reduced, as shown in Figure 12.
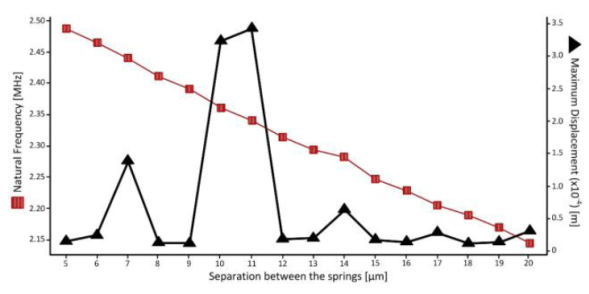
Also in Figure 12 it can be seen that the maximum displacement for the structure contains several peaks, which are preferable to avoid in order to ensure proper device operation.
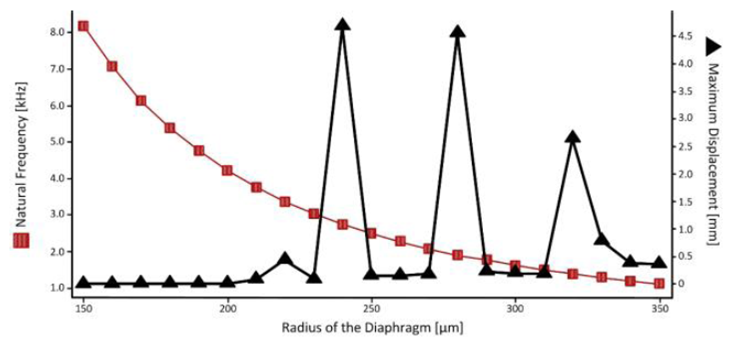
In the third and last experiment, the radius of the diaphragm was varied from 150µm to 350µm, thus increasing the mass of the device. The natural frequency was reduced, as can be seen in the graph of Figure 13. Peaks are also observed in the deformation of the diaphragm.
5. Conclusions and Future Work
Performing the analysis described in this paper is of paramount importance in understanding the relation of the physical characteristics of MEMS devices with their natural frequencies. For acoustic applications to which this research focuses, it is necessary to design devices with natural frequencies in the range of human hearing. However, it is important to ensure that the physical dimensions of the device do not correspond to deformation peaks at the natural frequency. The reason for this is that MEMS devices possess very limited movement due to manufacturing technologies for surface micromachining and there is a risk of destroying them when large displacements occur [15]. To avoid a greater deformation of the diaphragms, stoppers will be placed using a polysilicon layer over the diaphragms, which will limit the upwards deflection. Also, to prevent that the diaphragm touches the backplate, dimples will be placed. These dimples will contact isolated sections on the backplate.
The next step for future work is to mathematically analyze the structures, in order to provide guidelines to choose the right configuration and dimensions. After this a series of devices with different natural frequencies can be design to be integrated in an array intended to emulate the behavior of a human cochlea. As shown in Figure 9, corresponding to the circular diaphragm, the maximum deformation at the natural frequency was 5.74µm, so it is considered that this type of circular structure will be appropriate to form part of the device that will emulate the human cochlea.
However, it is necessary to recalculate the dimensions so that the deformation can be reduced, as the SUMMiT VTM manufacturing process will be used for its construction, which has an interlayer separation of approximately 2µm. Another process that could be used is the PolyMUMPsTM, which also has a separation between layers of 2um. These two processes have their own advantages and disadvantages, so it will be important to choose one of them for the design of the structures, based on the rules for manufacturing of these processes [11,16].
Once the structures are constructed, an FPAA (AN231E04 dpASP) and a capacitometer will be used to measure the capacitance variation of the structures.

