


Servicios Personalizados
Revista
Articulo
 Inglés (pdf)
 Artículo en XML
 Referencias del artículo
 Enviar artículo por email
Indicadores
-
 Citado por SciELO
 -
 Accesos
Links relacionados
-
 Similares en
SciELO
Similares en
SciELO
Compartir

 Permalink
Superficies y vacío
versión impresa ISSN 1665-3521
Superf. vacío vol.27 no.3 Ciudad de México sep. 2014
Quantification of phase content in TiO2 thin films by Raman spectroscopy
Castrejón-Sánchez V.H.1,2,3, Camps Enrique3 y Camacho-López M.4
1 Facultad de Química, Universidad Autónoma del Estado de México Paseo Colón y Tollocan, Toluca, México, CP. 50110.
2 Tecnológico de Estudios Superiores de Jocotitlán carretera Toluca-Atlacomulco Km. 44.8, Ejido de San Juan y San Agustín, Jocotitlán, México, CP. 50700.
3 Departamento de Física, Instituto Nacional de Investigaciones Nucleares Apartado postal 18-1027, México D.F., CP. 11801.
4 Laboratorio de Investigación y Desarrollo de Materiales Avanzados, Facultad de Química, Universidad Autónoma del Estado de México Km 14.5 Carr. Toluca, Atlacomulco, México.
Recibido: 20 de febrero de 2014;
Aceptado: 30 de julio de 2014
Abstract
Recently, it has been reported that TiO2 with mixture of phases (anatase/rutile) exhibit higher photocatalytic activity than TiO2 with pure anatase phase. Therefore, the production and correct quantification of the ratio of phases becomes an important task. In this work, anatase TiO2 thin films were obtained by the DC reactive magnetron sputtering technique. TiO2 with mixture of phases (anatase/rutile) were prepared by thermal annealing of the as-deposited thin films. The value of the anatase/rutile ratio in the titanium dioxide thin films was estimated using Raman spectroscopy. Additionally, it is reported the dependence of the bandgap of the TiO2 thin films as a function of the anatase/rutile ratio. The band gap of the TiO2 thin films was determined from diffuse reflectance measurements.
Keywords: Anatase-rutile TiO2; Raman spectroscopy; Reactive sputtering.
1. Introduction
Titanium dioxide is a material of growing interest due to its proven ability to function as a photocatalyst and to facilitate important environmentally beneficial reactions, such as water splitting to generate hydrogen and therefore treatment of polluted air and water [1, 2]. The most important requirement for a photocatalyst is its ability to generate electron-hole pair near the catalyst surface by harvesting a significant portion of solar spectrum. Unfortunately, the use of TiO2 in anatase phase is hindered by its large bandgap (3.33 eV) which allows photoconversion of only UV radiation (λ < 372 nm), so the bandgap must be decreased if TiO2 is to be used for visible light applications.
Titanium dioxide occurs as three important polymorphs, the stable rutile, the metastable anatase andbrookite [3, 4]. These polymorphs exhibit different properties and consequently different photocatalytic performance. The anatase phase shows useful level of photocatalytic activity, which has a great potential in applications such as self-cleaning windows, anti-fogging windows and lenses, air cleaning and water purification devices an self-sterilizing antibacterial tiles. On the other hand, the rutile phase shows a high refractive index and stability, which can be used as dielectric, gas sensor and anti-reflective coating [5]. The photocatalytic activity of the brookite phase has been practically unstudied.
Mixed phase photocatalysts with anatase/rutile compositions have been reported to exhibit enhanced photoactivity relative to single phase TiO2. It is considered that the high catalytic activity of mixed phase TiO2 catalyst is mainly due to the synergistic activation of the rutile by anatase. The rutile phase extends the photoactive range into the visible, harvesting more light, and electron transfer from rutile to anatase trapping sites [6]. However, a detailed study in order to determine the suitable ratio of phases for photocatalytic purposes, has not been done yet. In the present work, there were prepared a series of thin films with different values of the anatase/rutile ratio, and their optical properties (band gap) were studied.
The determination of the value of the anatase/rutile ratio was determined by MicroRaman spectroscopy, that has been employed effectively to differentiate the anatase and rutile phases. The TiO2 polymorphs exhibit distinct Raman spectra that can be used for qualitative and quantitative analysis. The main strength with MicroRaman spectroscopy is its applicability to nanoscale thin films [7, 8, 9]. Finally it is shown the influence of the mixture of phases on the value of the bandgap, which was determined from diffuse reflectance measurements.
2. Experimental
2.1. Material formation
2.1.1. DC Magnetron Sputtering
Thin films of titanium dioxide were prepared using a DC Magnetron Sputtering System, at the base pressure of 3.33 x 10⁻⁴ Pa and an operating pressure of 1 Pa. The working gas used was an 80/20 mixture of Ar/02. The equipment was operated in regulated power mode, which was set at 250 W; with a 2 inches high purity Titanium target. Fused silica was used as the substrate. The substrate temperature was fixed at 250° C and the deposition time at one hour.
2.1.2. Thermal Treatment (Annealing)
The as-obtained titanium dioxide thin films were thermally treated using an electric furnace. In order to prepare samples with mixture of phases, all thin films were treated at 850° C in air during different periods of time ranging from 90 to 160 minutes.
2.2. Material Characterization
2.2.1. Raman Spectroscopy
The crystalline structure of the TiO2 films was determined by microRaman spectroscopy. Raman spectra were measured with a microRaman (LabRAM HR-800) system. Raman scattering was induced by a Nd:YAG laser in the second harmonic (λ = 532 nm) with a maximum laser power of 60 mW on the sample. A 50x lens was used to focus the laser beam on the sample surface and for collecting the scattered light, 100 acquisitions were averaged with an exposure time of 5 seconds each one.
2.2.2. Optical Bandgap
The optical properties of TiO2 samples were determined using UV-Vis spectroscopy. The diffuse reflectance spectra of the TiO2 thin films, were obtained using a PerkinElmer Lambda 35 spectrophotometer with integrating sphere. Each spectrum was obtained in the range 200-1100 nm, with a scan rate of 480nm/ min.
2.2.3. Thickness
The thickness of the samples was measured using a profilometer KLA Tencor D-120. The measurement was done at the step left for this purpose during the deposition of thin films. The sweep was done at a length of 0.7 mm. Under the experimental conditions used for deposition of films an average value of thickness of 380 ± 15 nm was obtained. The error in the measurement is the standard deviation of at least 3 measurements in different areas of each sample.
3. Results and discussion
3.1. Raman Spectroscopy
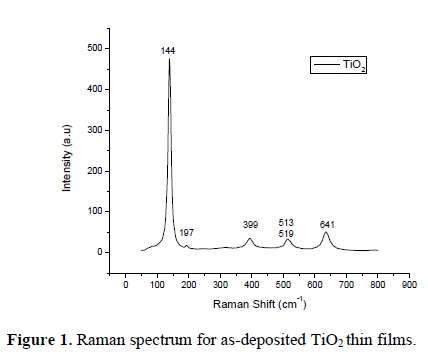
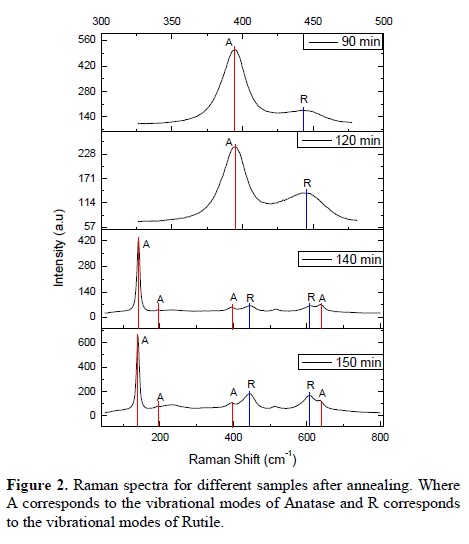
All the as-deposited thin films in the sputtering system showed the anatase phase. Figure 1 shows a representative Raman spectrum of the as-deposited thin films, this spectrum corresponds to the pure anatase phase. After annealing at 850 °C during different periods of time, the rutile phase was induced. Raman spectra of the TiO2 thin films after annealing are shown in Figure 2. As can be seen, different proportions of the rutile phase were induced as a function of the annealing time. In the next section it will be explained the way the proportion of each phase was calculated.
3.2. Determination of the anatase/rutile ratio
Two calibration curves were constructed using mixtures of titanium dioxide powder with different proportions of the anatase and rutile phases, starting at 100 wt. % anatase down to 0 wt. % of anatase, or 100 wt. % rutile. The mixtures were made in steps of 10 wt. % of rutile. It is well known that the anatase phase has six Raman active modes: a peak with strong signal appears at 144 cm-1 followed by low intensity peaks located at 197, 399, 513, 519 and 641 cm-1. The bands located at 513 and 519 cm-1 overlap and our equipment shows only one band. However, to calculate the phase proportions these bands are not used, and therefore the final result is not affected. Meanwhile, the rutile phase has four active modes appearing at 143, 236, 447 and 613 cm-1.
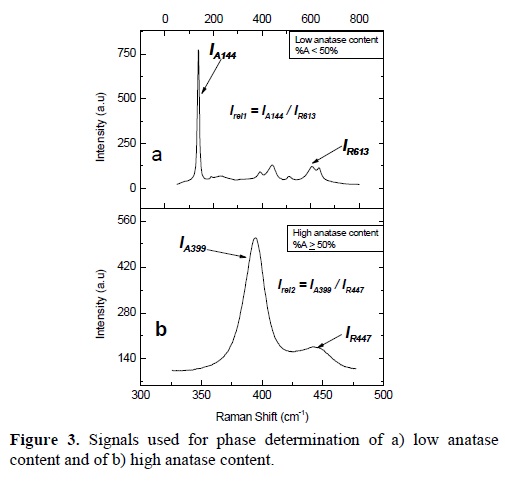
According to the methodology proposed by Clegg et al. [10] it is possible to use the signals located at 144 and 613 cm-1 which correspond to anatase and rutile respectively. The peak at 144 cm-1 is used because it is very sensitive to anatase content, even when low percentages of anatase (<50%) are present. A problem in this method comes out when the anatase content exceeds the 50%, as the signal at 144 cm-1 is too strong and the intensity of all other bands is very small. In this way, the determination of the intensity of the peak at 613 cm-1 becomes very difficult due to its closeness to the peak of anatase at 641 cm-1.
For this reason, we propose the use of the peaks located at 399 and 447 cm-1, corresponding to anatase and rutile, respectively, in order to quantify the anatase/rutile ratio. We will show that these peaks are useful, when a mixture of phases with high content of anatase (≥50%) constitute the material. Raman spectra of each mixture were taken and fitted in order to obtain the intensities of the peaks located at 144 and 399 cm-1, which belong to the anatase phase (called IA144 and IA399) and those located at 447 and 613 cm-1, which correspond to rutile (designated as IR447 and IR613). Figures 3a and 3b show the corresponding spectra for low and high contents of anatase and the signals that were used.
Subsequently the relative intensities were calculated as follows:

where Irell corresponds to the relative intensity of the case of low anatase content, and Irel2 for the case of high anatase content. Then the relative intensity is plotted as a function of the ratio WA / WR, where WA and WR are the mass fraction of anatase and rutile respectively. Once the value of WA/WR is determined from the plot and knowing that WA + WR = 1, the percentage of each phase can be determined. The calibration curves are shown in Figure 4a and 4b. These calibration curves were used to determine the anatase/rutile ratio in the annealed TiO2 thin films, determining the relative intensity in each of them.
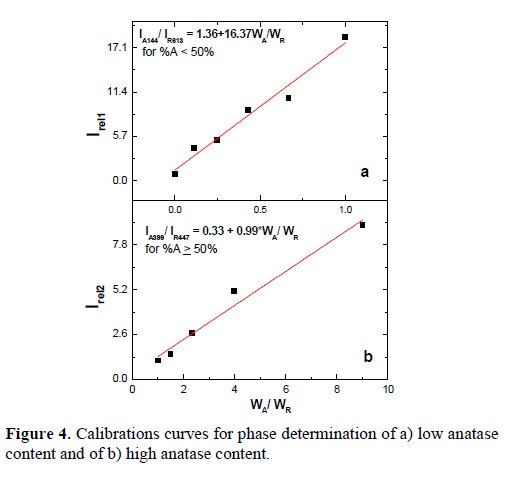
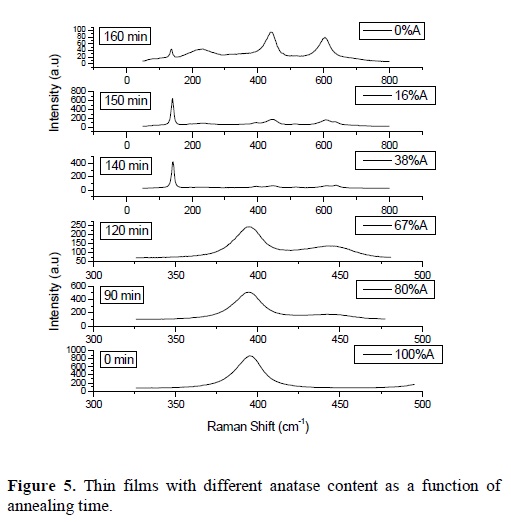
In order to determine what calibration curve must be used, it was established a criterion. When the value of Irell (obtained from the Raman spectrum of a sample with unknown composition) has a value less than 20, indicating that the anatase content in thin films is less than 50%, the calibration curve Irell (fig. 4a) should be used, otherwise the calibration curve Irel2 should be used. The change of calibration curve when the anatase content approaches the 50%, is due to the fact that the intensity of the band centered at 613 cm-1, becomes less sensitive to further increase of the anatase content and its behavior becomes erratic. Meanwhile the intensity of the bands located at 399 and 447 cm-1, can be easily measured in the case of high anatase contents (> 50%). Figure 5, shows the Raman spectra for some thin films and contents of anatase calculated using the described method.
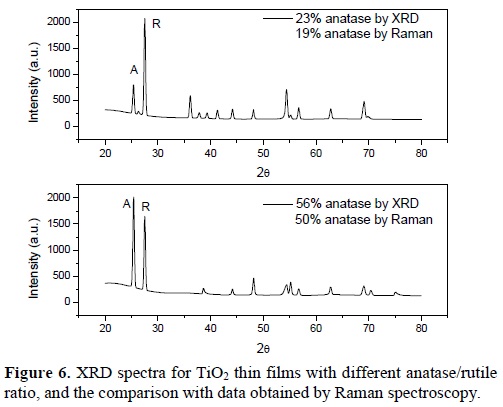
In some samples the anatase content was also calculated using the X-ray data and the model proposed by Spurr and Myers [11]. Figure 6 shows the case of two samples with different content of phases. There exists a slight difference between the measurements by X-ray diffraction and by Raman spectroscopy. The main difference is due to acquisition method. The spot size of the X-ray equipment is about 20 mm2, meanwhile the spot size in the microRaman used is about 1 μm. By X-ray diffraction an average value of a big area is reported, and by microRaman spectroscopy a few measurements must be done and the mean value is reported. Nevertheless, the same trend was observed when using both techniques to measure the phase content.
3.4. Optical Bandgap
Figure 7 shows the Tauc plot of a film without any treatment (pure anatase thin film) and of two films with mixture of phases. From this figure it is observed a shift towards lower photon energies as the anatase content reduces. This is a qualitative indication of the change of the bandgap. The bandgap value of the thin films was determined using the Kubelka -Munk model:

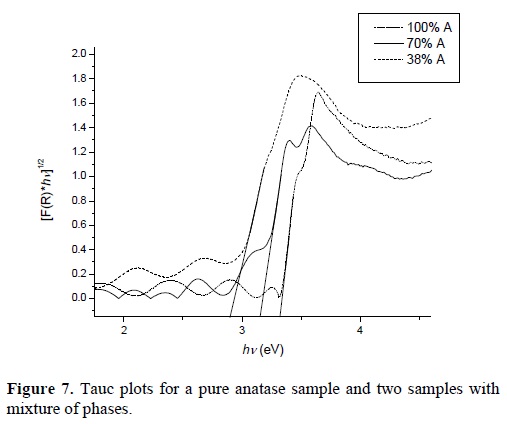
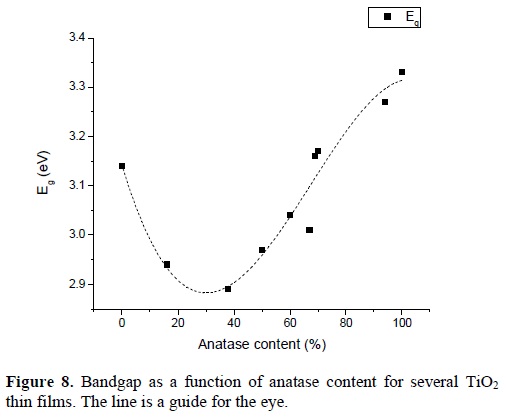
Where F(R) = (1-R)2/2R is the Kubelka-Munk function, hv is the energy of the incident photons, C1 is a constant and x takes values of ½ or 2 depending if the material has an indirect or direct bandgap respectively . The bandgap (Eg) is determined by plotting [F(R)hv]x as a function of hv and extrapolating the linear portion to [F(R)hv]x= 0, as can be seen in figure 7. The effect of the rutile phase content on the bandgap is shown in Figure 8. One can observe that the band gap diminishes with the reduction of the anatase phase content reaching a minimum of 2.89 eV at 40 %. From this value the band gap increases again obtaining a value of 3.14 eV for the sample without anatase phase content (or 100% rutile content). The reduction of the bandgap to values lower than that of the pure rutile phase is an effect that has been observed in partial measurements done by other authors [12, 13, 14]]. They attributed this reduction of the bandgap to defects induced in the band structure due to defects in the contacts between the anatase and rutile phases. On the other hand, based on the model proposed by Hurum [15], the decrease in bandgap could be due to the fact that rutile modifies the response of anatase to longer wavelengths, and due to this, there is an electron transference from the rutile to the anatase trapping sites, that hinders the recombination of generated charges, allowing in this way that the mixture of phases could be useful when this material is used for photocatalytic tests in the visible range.
4. Conclusions
TiO2 thin films in pure anatase form were obtained using the magnetron sputtering technique. A post deposition annealing allowed obtaining different mixtures of phases in a wide range of the anatase/rutile ratio. MicroRaman spectroscopy has proven to be a useful technique for the rapid identification of the phases present in the samples, and for the quantification of the value of the anatase/rutile ratio. The bandgap value of the TiO2 films is a function of the anatase/rutile ratio of phase content and its value was found to achieve values lower than that of the pure rutile phase. These low values of the bandgap could be useful in some applications such as photocatalysis using visible light.
References
[1]. Jianling Lin, Bo Wang, William D Sproul, Yixiang Ou, Isaac Dahan; J.Phys. D: Appl. Phys., 46, 9 (2011). [ Links ]
[2]. Shu-Hai You, Ming-Hua Guo; International Journal of Photoenergy, article ID 796421 (2013). [ Links ]
[3]. Dorian A.H. Hanaor, Charles C. Socorrel; J Mater Sci, 46, 855 (2011). [ Links ]
[4]. F .D. Hardacastle; Journal of Arkansas Academy of Science, 65,65 (2011). [ Links ]
[5]. K. Prabakar, T. Takahashi, T. Nezuka, K. Takahashi, T. Nakashima, Y. Kubota, A. Fujishima; Renewable Energy, 33, 277 (2008). [ Links ]
[6]. Deanna C. Hurum, Alexander g. Agrios, Kimberly A. Gray; J. Phys. Chem. B, 107,4545 (2003). [ Links ]
[7]. Fritz J. Knorr, Candy C. Mercado, Jeanne L. McHale; J. Phys. Chem. C, 112, 12786 (2008). [ Links ]
[8]. Jianliang Lin, Bo Wang, Willim D Sproul, Yixiang Ou, Isaac Dahan; J. Phys. D: Appl. Phys., 46, 9 (2013). [ Links ]
[9]. Hua Chang, Pei Jane Huang; Journal of Raman Spectroscopy, 29, 97 (1998). [ Links ]
[10]. Ian M. Clegg, Neil J. Everall, Bert King, Hugh Melvin, Colin Norton; Applied Spectroscopy, 55, 1138 (2001). [ Links ]
[11]. Robert A. Spurr, Howard Myers; Anal. Chem. 29, 760 (1957). [ Links ]
[12]. Susmita Paul, Amarjyoti; Appl Nanosci 2103, DOI 10.1007/sl 3204-013-0264-3. [ Links ]
[13]. Mu-Hsuan Chan, Fu-Hsing Lu; Thin Solid Films, 518, 1369(2008). [ Links ]
[14]. Lei Zaho, Mandi Han, Jianshe Lian; Thin Solid Films, 516, 3394 (2008). [ Links ]
[15]. Deanna C. Hurum, Alexander G. Agrios, Kimberly A. Gray; J. Phys. Chem. B, 107,4545 (2003). [ Links ]

