


Serviços Personalizados
Journal
Artigo
 Inglês (pdf)
 Artigo em XML
 Referências do artigo
 Enviar este artigo por email
Indicadores
-
 Citado por SciELO
 -
 Acessos
Links relacionados
-
 Similares em
SciELO
Similares em
SciELO
Compartilhar

 Permalink
Superficies y vacío
versão impressa ISSN 1665-3521
Superf. vacío vol.25 no.2 Ciudad de México Jun. 2012
Effect of the phase composition and crystallite size of sol-gel TiO2 nanoparticles on the acetaldehyde photodecomposition
Carrera-López R. A
Instituto Politécnico Nacional Sección de Estudios de Posgrado e Investigación Av. Ticomán 600, C.P. 07738, México, D.F. rcarrera@ipn.mx
Castillo-Cervantes S.
Instituto Mexicano del Petróleo Programa de Ingeniería Molecular Eje Lázaro Cárdenas 152, C.P. 07730, México, D.F.
Recibido: 13 de octubre de 2011
Aceptado: 28 de abril de 2012
Resumen
TiO2 nanoparticles with attractive physicochemical properties have synthesized by means of the sol-gel method and acid hydrolysis. The obtained nanoparticles have characterized by the XRD-Rietveld refinement, BET and TEM techniques, and tested in the photodecomposition of acetaldehyde. The degree of decomposition of acetaldehyde by the sol-gel TiO2 nanoparticles was directly proportional to the brookite mass fraction but inversely proportional to the anatase mass fraction and crystallite size.
Keywords: Ti, Sol-gel, Photodecomposition, acetaldehyde, anatase, brookite.
1. Introduction
Recently, a great deal of research work has carried out on the photocatalytic process with TiO2 nanoparticles because it is a promising method for the purification and remediation of polluted air due to its low cost, environmental friendliness, high photosensitivity, nontoxicity and easy availability [1]. Nowadays, TiO2 nanoparticles are interesting materials, since one of the most relevant targets in the VOCs control is the decomposition of low concentrations of formaldehyde and acetaldehyde in indoor environments through photoassisted reactions. Acetaldehyde has produced by the oxidation of volatile organic compounds when they are in contact with ozone in carpets, furniture, etc., and it is one of the most toxic VOCs [2]. TiO2 nanoparticles have synthesized by many techniques, such as sol-gel method [3], chemical vapor deposition [4], solvothermal process [5], reactive sputtering [6], liquid phase deposition [7], electrochemical method [8], and hydrothermal treatment [9]. From these methods, the sol–gel method is one of the most widely used for preparing TiO2 nanaoparticles because it is possible to obtain solids in which the brookite, anatase and rutile phase composition ratios can be varied [10].
It has demonstrated the presence of anatase and rutile phases on TiO2 nanoparticles are beneficial to enhance the photocatalytic activity [11]. In this way, the mixture of the anatase and rutile phases has been widely studied and evaluated for various applications concerning heterogeneous photocatalysis. However, the role in the photoactivity of the brookite phase present in small quantities as a by-product in the formation of TiO2 [12, 13] has scarcely studied. The aim of the present research work was to synthesize, by means of the sol-gel method and acid hydrolysis, TiO2 nanoparticles in which the relative abundance of anatase (higher proportion) and brookite phases with nanometric crystallite size can be varied. The effect of the brookite/anatase ratio and that of their crystallite size on the acetaldehyde photodecomposition were investigated quantitatively.
2. Experimental
2.1 Preparation of sol-gel TiO2 nanoparticles
In a three-neck reactor, 50 ml of either 2-propanol or ethanol (Baker 99.9 %) were mixed and put under reflux and stirring. Afterwards, the solution was adjusted to pH 2 by adding hydrochloric acid (HCl). Then, added dropwise 0.2 mol of titanium IV isopropoxide (Aldrich 99.9 %) to the solution and maintained under reflux and uniform stirring until the sol formed. After, added 3.2 mol of deionized water to the mixture until the gel obtained. The final product dried at 70 ºC for 12 h, and we obtained powder. Finally, the fresh sol-gel TiO2 nanoparticles calcined at 200 and 500 ºC for 3 h. The sol-gel catalysts labeled as follows: TiO2-P-2000C (prepared with 2-propanol and calcined at 2000C), TiO2-P5000C (prepared with 2-propanol and calcined at 5000C), TiO2-E-2000C (prepared with ethanol and calcined at 2000C) and TiO2-E-5000C (prepared with ethanol and calcined at 5000C).
2.2 Characterization of sol-gel TiO2 nanoparticles
The nitrogen adsorption and desorption isotherms at 1960C were measured using Micrometrics ASAP-2000 equipment. The specific surface area and the pore size distribution (average pore diameter and mean pore volume) were measured from the adsorption isotherm using the Brunauer–Emmett–Teller method and from the desorption isotherm using the Barret–Joyner–Halender (BJH) method, respectively. The XRD patterns were obtained using a D500 Siemens difractometer with a copper target and Kα radiation (λ=1.5405Ǻ), operating at 35 KeV and 15mA. The reflection intensities were recorded in the 2θ interval ranging from 20 to 80º. To refine the spectra, the Rietveld analysis was applied by using the Full Prof software developed by Rodríguez Carvajal [14, 15]. The crystallite size was determined by means of the Scherrer's equation [16]. The presence of the mixture of phases in the sol-gel TiO2 nanoparticles was analyzed by transmission electron microscopy (TEM) using a Jeol 100 CX STEM with aresolution ranging from 2 to 5Å, all analyses performed at 100 kV. From the obtained micrographs, the average crystallite size calculated by the surface/volume equation [17].
2.3 Evaluation of the photocatalytic activity
The photocatalytic activity tests for the sol-gel TiO2 nanoparticles and bare semiconductor (Degussa 2 P25) were carried out in an automated experimental equipment at microreaction level. A quartz cell was used as photoreactor with a 365-UV lamp (UVP-Light-Sources) and a100 µW/cm2 intensity. The tests were carried out at ambient conditions with an acetaldehyde (CH3CHO) concentration of 300 ppmv and 2% of dried oxygen by means of a 365-nm UV lamp. Acetaldehyde photodecomposition studies and carbon dioxide formation have investigated by infrared spectroscopy and gas chromatography.
3. Results and Discussion
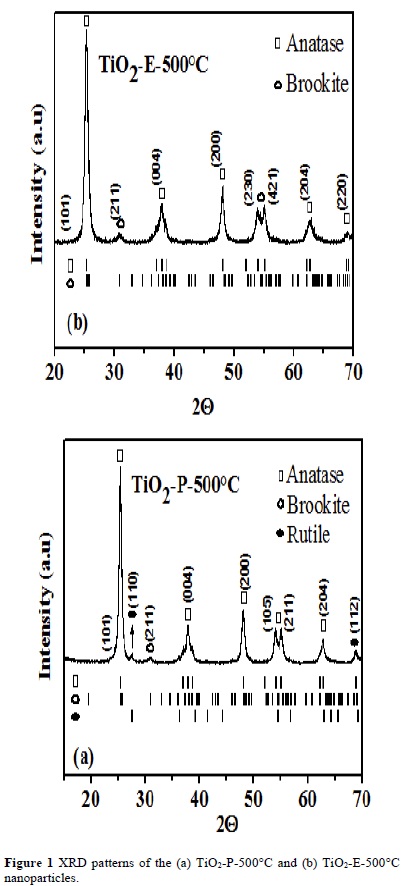
In Table 1, we reported the phase composition, crystallite size, lattice parameters and the phase composition for the sol-gel TiO2 nanoparticles. The XRD Rietveld refining results show anatase is the main phase, with tetragonal structure; the brookite phase also presented with an orthorhombic structure; and just in the case of the TiO2-P500ºC nanoparticles, the rutile phase exists with a tetragonal structure. By means of the empirical equation (1) developed by Zhu et al. [19], the brookite critical crystallite size (Dc) calculated:
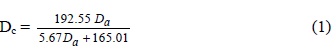
"Da" and "Db" correspond to the anatase and brookite crystallite size, and "Dc" is the transition sequence between anatase and brookite. When the crystallite size of brookite (Db) is larger than (Dc), brookite directly transforms into rutile, whereas when Db is smaller than Dc, brookite transforms into anatase, and then anatase into rutile. According to equation (1), the TiO2-P-200ºC nanoparticles present Dc=6.6 nm and Db=18.26 nm (Table 1), then Db > Dc, which can be explained by the fact that the brookite phase could grow sufficiently (34.02 nm) to transform into rutile during the calcination of these nanoparticles at 500°C. According to the aforementioned, in the TiO2-P500ºC nanoparticles, the presence of the anatase-brookiterutile mixture was confirmed Figure 1 (a). In the case, of the TiO2-E-200ºC nanoparticles, Dc=7.56 nm and Db=6.66 nm were obtained (Table 1), then Db < Dc. When these nanoparticles calcined at 500°C (TiO2-E-500ºC), the brookite phase could not grow enough (14.78 nm), transforming itself into anatase without going through the anatase-rutile transformation, Figure 1 (b).
It is hard to prepare sol-gel TiO2 nanoparticles, with more brookite percent, and larger crystallite size by faster hydrolysis rate. Many times these nanoparticles prepared are amorphous, and easily transforms to anatase when heated above 300°C.
The surface specific area determined by the BET method in the sol-gel TiO2 nanoparticles calcined at 200 and 500°C listed in Table 2. It can be seen that the surface areas of the samples annealed at 200°C (189-212 m2/g) are three times higher than those annealed at 500°C (60-70 m2/g). Nanoparticles, characterized by lower mean pore diameters, as well as higher pore volumes, annealed at 200°C in comparison with those calcined at 500°C. The main reason for this change in the pore structure in the 500°C calcined nanoparticles attributed to sintering and /or phase transformations occurring in these sol-gel TiO2 nanoparticles [20].
The crystalline structure and the mixture of phases present in the sol-gel TiO2 nanoparticles observed by transmission electron microscopy (TEM), Figure 2. The mean crystallite size of the nanoparticles reported in Table 2. Through the selection, of a crystallite size in different zones of the micrographs the individual diffraction patterns obtained, and the corresponding interplanar distances were measured by means of the Digital Micrograph program which compared with the classified cards of the (J.C.P.D.S.) for TiO2, thus to find the crystalline structure in the corresponding direction, Table 3.
Figure 2 shows the mixtures of phases: anatase, brookite and rutile phases present in the nanoparticles, indicating the selection region in the crystallite and the corresponding diffraction pattern. A magnification of the crystallites corresponding to the anatase phase is also shown. The obtained mean crystallite sizes and the mixture of phases identified by TEM for the sol-gel TiO2 nanoparticles are in satisfactory agreement with the XRD results (Table 2). Figure 3 shows the results of the photocatalytic evaluation of the sol-gel TiO2 nanoparticles (see also Table 2), and those of the TiO2-P25 bare semiconductor, in the acetaldehyde photodecomposition under UV irradiation as a function of time.
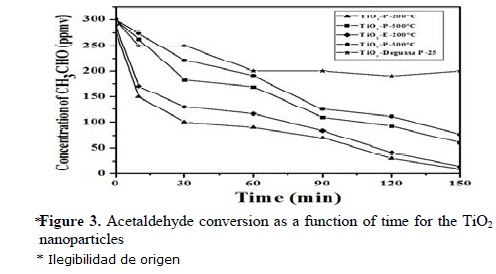
The sol-gel TiO2 nanoparticles with a lower crystallite size, higher surface area and lower average pore diameter (Tables 1 and 2) present higher efficiency in the photodecomposition of acetaldehyde, Figure 3. Thermal annealing produced an increase in the crystallite size, a reduction of the specific area and a lower activity in the acetaldehyde photodecomposition. This property is remarkable in the TiO2-E-500ºC with efficiency of 74.3%, Figure 3. According to the aforementioned, the acetaldehyde photodecomposition is higher in the solids with high specific surface area; then, the specific surface area and crystallite size of these nanoparticles make important contributions to the acetaldehyde photodecomposition activity. Fan et al [21] reported the results indicate that the specific surface area of the sol-gel TiO2 nanoparticles is, the more reaction sites are, which is in favor of the activity. On the other hand, with a smaller crystallite size, the number of active surface sites increases, and so does the surface charge carrier transfer rate in the photocatalytic reaction.
The selectivity to complete mineralization was followed by the formation of CO2. In Figure 4, it can be seen that the CO2 formation follows a similar trend to that observed for the conversion evolution (Figure 3). The high selectivity to showed by the sol-gel nanoparticles is of great saturation of the surface is decomposed, and importance since total mineralization is one of the most appreciated results. In Figure 4, it can be seen that an induction period of around 30 min is needed to identify appreciable formation of CO2. This induction period was attributed by Sano et al., [23] to initial oxidation of acetaldehyde giving adsorbed acetic acid, which after saturation of the surface is decomposed, and then, total mineralization is reached.
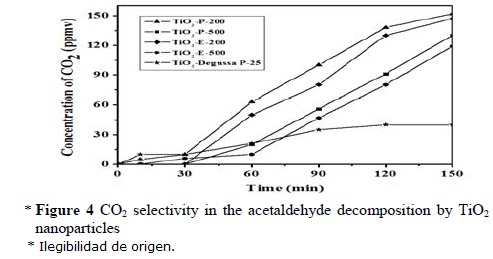
The selectivity to total mineralization was followed by the formation of CO2. In Figure 4, it can be seen that the CO2 formation follows a similar trend to that observed for the conversion evolution (Figure 3). The high selectivity to CO2 showed by the sol-gel nanoparticles is of great importance since total mineralization is one of the most appreciated results. In Figure 4, it can be seen that an induction period of around 30 min is needed to detect appreciable formation of CO2. This induction period was attributed by Sano et al., [23] to an initial oxidation of acetaldehyde giving adsorbed acetic acid, which after saturation of the surface is decomposed, and
From the obtained results, it can be assumed that the acetaldehyde decomposition reached by the TiO2 nanoparticles under 365-UV light was directly proportional to the brookite mass fraction, but inversely proportional to both the anatase mass ratio and crystallite size.
The high selectivity to the formation of CO2 in the acetaldehyde decomposition reaction depends on the intensity of light and the initial reactant concentration. Sopyan et al [22] reported that the optimum initial concentration of acetaldehyde is 300 ppm, since at this concentration the quantum yields for CO2 production were much higher than those for acetic acid production, with a constant UV intensity.
While concentrations in the ppm range are typical for chemical stream concentration, sub ppm levels or parts per billion (ppb) concentrations are commonly indoor VOCs, (buildings, trains, vehicles, planes, etc.) VOCs [23], it would be expected to sol-gel TiO2 nanoparticles can be effectively used for decomposing the acetaldehyde indoor, as it is re then, total mineralization is reached. markable that do not lose their photocatalytic efficiency at high concentrations of this pollutant (300 ppmv) due to saturation of the active sites of its specific surface area.
The high selectivity to the formation of CO2 in the acetaldehyde decomposition reaction depends on the intensity of light and the initial reactant concentration. Sopyan et al [22] reported that the optimum initial concentration of acetaldehyde is 300 ppm, since at this concentration the quantum yields for CO2 production were much higher than those for acetic acid production, with a constant UV intensity.
While concentrations in the ppm range are typical for chemical stream concentration, sub-ppm levels or parts per billion (ppb) concentrations are commonly indoor VOCs, (buildings, trains, vehicles, planes, etc.) VOCs [23], it would be expected to sol-gel TiO2 nanoparticles can be effectively used for decomposing the acetaldehyde indoor, as it is remarkable that do not lose their photocatalytic efficiency at high concentrations of this pollutant (300 ppmv) due to saturation of the active sites of its specific surface area.
According to the Rietveld-XRD results (Table 1), it can be seen that the photoactivity of the sol-gel TiO2 nanoparticles can be related to the relative abundance of titania phases. By comparing the sol-gel TiO2 nanoparticles, it was found that the highest acetaldehyde decomposition was obtained with the sample having the highest brookite abundance (Tables 1 and 2). The photocatalytic activity of the sol-gel TiO2 nanoparticles can be attributed to both the crystallite size and the relative abundance of the crystalline phases; variations in these two factors modify the TiO2 band gap, and important effects on the photocatalytic properties can be expected [24, 25]. The photocatalytic activity of the TiO2 nanoparticles prepared by the method sol-gel consisted of anatase and brookite phases were more active than those containing anatase, brookite and rutile phases. All the sol-gel TiO2 nanoparticles exhibited higher phocatalytic activity than TiO2-Degussa-P-25.
Previous reports indicated that brookite may be used as an effective photocatalyst. Pure brookite nanocrystals obtained by reaction of a mixed solution of urea and TiCl3 showed good photocatalytic properties for the degradation of acetaldehyde [26] and 4-chlorophenol [27] but the activity of these samples was relatively lower than that of TiO2-Degussa-P-25. Di Paola et al [28] reported that the powders obtained by thermolysis of TiCl4 in aqueous NaCl solutions consisted of anatase, brookite and rutile phases were more active than those containing only brookite and rutile phases obtained in HCl solutions. These discrepancies may be ascribed to different preparation methods and hydrolysis conditions
4. Conclusions
TiO2 nanoparticles presenting various crystallite sizes and different compositions of the anatase-brookite phases were synthesized by the sol-gel method. The crystallite size and the weight percent composition of the anatase phase ranged from 7.03 to 22.04 nm and from 62.88 to 82.67% respectively, and from 6.66 to 34.02 nm and from 14.90 to 37.12% for the brookite phase. The photocatalytic properties of the sol-gel TiO2 nanoparticles concerning the acetaldehyde photodecomposition were investigated in terms of the crystallite size and the presence of a mixture of the anatase and brookite phases. The highest acetaldehyde photodecomposition rate displayed by the sol-gel TiO2 nanoparticles under 365-UV light was reached with those samples presenting the lowest crystallite size and the highest brookite phase composition. It can be concluded that the acetaldehyde decomposition was directly proportional to the brookite mass fraction and inversely proportional to the anatase mass fraction and crystallite size.
References
[1]. O. Carp, C. L. Huisman, A. Reller, Prog. Solid State Chem. 32, 33 (2004). [ Links ]
[2]. E. Obuchi, T. Sakamoto, K. Nakano, Chem Eng Sci. 54 1525 (1999). [ Links ]
[3]. M. Zhou, J. Yu, B. Cheng, H. Yu, Mater. Chem. Phys. 93, 159 (2005). [ Links ]
[4]. T. Maekawa, K. Kurosaki, T. Tanaka, S. Yamanaka, Surf. Coat. Technol. 202, 3067 (2008). [ Links ]
[5]. C.-S. Kim, B.K. Moon, J.-H. Park, S.T. Chung, S.-M. Son, J. Cryst. Growth. 254, 405 (2003). [ Links ]
[6]. M. R. Teresa Viseu, M.I.C. Ferreira, Vacuum 52, 115 (1999). [ Links ]
[7]. 12. J.G. Yu, H.G. Yu, B. Cheng, X.J. Zhao, J.C. Yu, W.K. Ho, J. Phys. Chem. B 107, 13871 (2003). [ Links ]
[8]. N.R. de Tacconi, C.R. Chenthamarakshan, G. Yogeeswaran, A. Watcharenwong, R.S. de Zoysa, A.N. Basit, K. Rajeshwar, J. Phys. Chem. B 110, 25347 (2006). [ Links ]
[9]. D.S. Kim, S.-Y. Kwak, Appl. Catal. A Gen. 323, 110 (2007). [ Links ]
[10]. R. Carrera, A. L. Vázquez, E. Arce, M. Moran-Pineda, S. Castillo, J. Alloys Compd. 434-435 788 (2007). [ Links ]
[11]. J. C. Yu, J. G. Yu, W. K. Ho, J. C. Zhao, Chem. Commun. 19 1942 (2001). [ Links ]
[12]. N. Venkatachalam, M. Palanichamy, V. Murugesan, Mater. Chem. Phys. 104 454 (2007). [ Links ]
[13]. N. Mahdjoub, N. Allen, P. Kelly, V. Vishnyakov, J. Photochem. Photobiol. A 210 125 (2010). [ Links ]
[14]. R. Carbajal, Phys. B 192, 55 (1993). [ Links ]
[15]. X. Orlhac, C. Fillet, P. Deniard, A. M. Dulac, R. Brec, J. Appl. Cryst. 34, 114 (2001). [ Links ]
[16]. J. W. Reid, J. A. Hendry, Appl. Cryst. 39 536 (2006). [ Links ]
[17]. S. Castillo, M. Morán-Pineda, V. Molina, R. Gómez, T. López, Appl. Catal. B 15 203 (1998). [ Links ]
[18]. R. C. Nádia, F. Machado, V. S. Santana, Catal. Today 107-108 595 (2005). [ Links ]
[19]. K. R. Zhu, M. S. Zhang, J. M. Hong, Z. Yin, Mater. Sci. Eng. A 403 87 (2003). [ Links ]
[20]. A. J. Patil, M .H. Shinde, H. S. Potdar, S. B. Deshpande, Mater. Chem. Phys. 68 7 (2001). [ Links ]
[21]. X. X. Fan, T. Yu, L.-Z. Zhang, X.-Y. Chen, Z.-G. Zou, Chin. J. Chem. Phys. 20 733 (2007). [ Links ]
[22]. I. Sopyan, M. Watanabe, s. Murasawa, K. Hashimoto, J. Photochem. Photobiol. A 98 79 (1996). [ Links ]
[23]. S. Wang, H. M. Ang, M. O. Tade, Environ. International 33 694 (2007). [ Links ]
[24]. T. López, R. Gomez, E. Sanchez, F. Tzompantzi, J. Sol-Gel Sci. Technol. 22 99 (2001). [ Links ]
[25]. S. Boujday, F. Wünsch, P. Portes, J. F.Bocquet, C. Colbeau-Justin, Sol. Energy Mater. Sol. Cells 83 421 (2004). [ Links ]
[26]. J.-G. Li, C. Tang, D. Li, H. Haneda, T. Ishigaki, J.Am. Ceram. Soc. 87 1358 (2004). [ Links ]
[27]. S. Bakardjieva, V. Stengl, L. Subrt, J. Lukac, N. Murafa, D. Niznansky, K. Cizek, J. Jrkovsky, N. Petrova, J. Mater. Chem. 16 1709 (2006). [ Links ]
[28]. A. Di Paola. G. Cufalo, M. Addamo, M. Ballardita, R. Campostrini, M. Ischia, R. Ceccato, L. Palmisano, Colloid Surface A 317 366 (2008). [ Links ]

