


 nova página do texto(beta)
 Inglês (pdf)
 Artigo em XML
 Referências do artigo
 Enviar este artigo por email
 Citado por SciELO
  Similares em
SciELO
Similares em
SciELO 
 Permalink
1 Introduction
A failure can be defined as any malfunction in a dynamic system that leads to an unacceptable anomaly in its behavior. Failures can occur in sensors, actuators or components of the process. The early detection of these failures can prevent an undesirable behavior of the plant or catastrophic events such as damages to the plant or its operator (Frank, 1990).
FDI systems are used to estimate failures in complex industrial systems. FDI systems are based on physical or analytical redundancy. Analytical redundancy has been widely used in industrial processes because, being based on models, does not require additional hardware that can increase maintenance costs in the plant (Chetouani, 2013; Escobar et al., 2014).
FDI systems based on analytical redundancy use a mathematical model of the process under analysis; the model must represent adequately the behavior of the process under the selected operation range.
Observers are widely used in FDI systems because they can estimate variables not directly measurable in the plant due to nonexistent or high-cost sensors. In order to perform adequately the FDI tasks the value of the state variables is required (Pierri et al., 2008; Manuja et al., 2009; Velardi et al., 2009; Tian et al., 2013; Shen et al., 2012).
FDI systems used for linear systems have been widely studied, however, not many papers dealing with the problem of designing FDI systems to isolate simultaneous failures (Garcia-Morales et al., 2015) nor based on nonlinear observers can be found in literature (Rusinov et al., 2013; Ahmed et al., 2009; Ben 1997).
Diverse interesting problems arise when the on- line implementation of FDI systems is required, such as how to deal with the problem of performing a continuous estimation of the system without exceeding the available computational capabilities. A solution to deal with this problem consists in using continuous- discrete observer-based FDI system for state-affine systems (Deza et al., 1992; Nadri et al., 2004). Continuous-discrete observers are an alternative of solution when relatively long-time sampling periods are available (Goffaux et al., 2009; Astorga et al., 2002; Ibrir, 2007; Frogerais et al., 2012). In the cited papers, the gains of the continuous-discrete observers need to be computed after a variation of coordinates of the original nonlinear system. The selected observer for the FDI system developed in this work is the continuous-discrete constant-gain observer, presented in Hammouri et al., (2002).
The main objective of this paper is to implement an FDI system based on a continuous-discrete high- gain observer to detect on-line sensor faults in a distillation column. The FDI system is based on the estimation of molar fractions and temperatures of the light component of a binary mixture; the effectiveness of the FDI system is proved by inducing failures in different temperature sensors of the plant.
2 Continuous-discrete observer
High-gain observers have been suggested for uniformly-observable non-linear systems, one of the advantages of high-gain observers is their robustness. Choosing a high enough gain can lead to an arbitrarily small observer error. Besides, the observer gains cannot depend on the system inputs if a canonical (triangular) form of the system is used (Hammouri et al.,, 2002).
An extension of a continuous-discrete form of the continuous high-gain observer described in Nadri et al., (2004); Goffaux et al., (2009); Escobar et al., (2011) is presented in Téllez et al., (2012).
A continuous-discrete observer is suitable when measurements are available in relatively long sampling periods. A continuous-discrete observer consists of (i) a mathematical model of the process in the prediction step and (ii) a correction term composed of the observer gain and the error of the measured process output (with respect to the estimated output) in the correction step. Considering this fact, the following proposition is stated.
Proposition. Given the continuous-time system with discrete measurements given by:
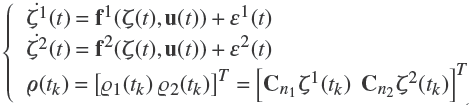 (1)
(1)
where the states ζ j (t), the input vector u(t), the disturbance vectors ε(t) j , the vector fields f j (·) and C nj =[1 0 ... 0],(n=dimension of state and j = 1,2) are defined as the continuous case, and the output vector ρ is defined in a discrete time tk ; a continuous-discrete observer is described in two steps:
Step 1: A prediction step in the semi-open time interval t ϵ [tk ,tk+1 ):
 (2)
(2)
Step 2: A correction step at time t = tk+1 :
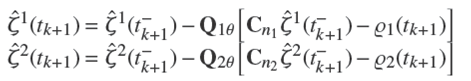 (3)
(3)
where the observer gains Q jθ are given by
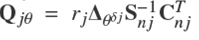
for j=1,2
Where

and
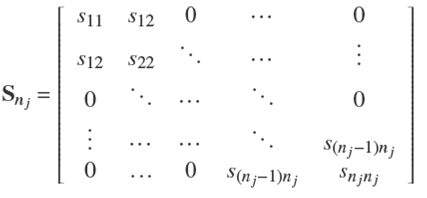
The tuning parameters of the proposed observer are rj (j = 1,2) and θ. Snj is a symmetric positive definite (SPD) matrix. The system is shown in Eq. (2) fulfills the existence conditions of the observer presented in Deza et al., (1992). The constant gain is obtained because the structure of the system in Eq. (2) satisfies the conditions given in Hammouri et al., (2002). The convergence properties of the continuous observer are theoretically verified in Hammouri et al., (2002). The convergence properties of the continuous- discrete observer are experimentally verified in Téllez et al., (2012).
3 Application to a distillation column
Distillation columns have been widely used in chemical industries to perform the separation process for liquid chemical mixtures. Currently, they are used to produce biofuels (such as ethanol); there are several distillation column designs (Meski and Morari, 1995).
The distillation process involves not only flammable chemical mixtures but also high temperatures and pressures that may provoke that the system under failure is dangerous for both, the process, and its users. This is the main reason to perform an early on-line failure detection, in order to ensure the safe and proper operation of industrial distillation systems (Skogestad, 2004).
In this work, molar compositions and temperatures of the components of an ethanol-water mixture are required to perform FDI tasks. Authors as Olsen et al., (2002); Quintero-Mármol et al., (1991); Han and Clough, (2006) propose estimating molar compositions by using secondary measurements such as temperature and pressure because the equipment required to perform this measurement can be very expensive.
3.1 Distillation column model
A distillation column consists of a condenser, n trays, and a boiler (see Fig. 1). The condenser is labeled with number 1, the boiler with number n and the intermediate trays are numbered ascending from the condenser to the boiler. The feeding mixture is deposited in tray number f , named the feeding tray.

The heating power is provided by an element located in the boiler, which causes the evaporation of the liquid stored into it. The condenser is located at the top of the column; its function is to cool and to condense the vapor that arrives from the body of the column until it becomes liquid. In this part of the column the reflux is performed, where all or a fraction of the condensed liquid returns to the column allowing the equilibrium phase.
There are several approaches for distillation column models in the literature. Since distillation is a process used to separate chemical mixtures, it needs to perform the balance of vapor and liquid phases depending on the mixture into the process. By definition: If a vapor and a liquid are in contact for a long time the equilibrium between the two phases is achieved, i.e. there is no flow of heat, mass, and momentum between the two phases.
A mathematical model of the system is required to design a state observer; this model provides the structure on which the observer is based.
The following assumptions are considered to model the distillation column:
Binary mixture (Ethanol-Water).
Constant pressure inside the column.
Insignificant vapor molar mass compared to the liquid molar mass.
Constant process enthalpy in every tray.
Constant molar mass retention in every tray.
Known feed stream molar flow F and liquid composition x f .
Total condenser.
Under the above considerations, the following simplified model is obtained:
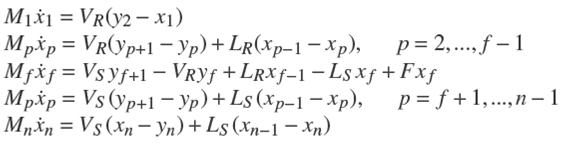 (4)
(4)
where xp and yp are, respectively, the liquid and vapor molar fractions of the light component in tray p. VR , VS and LR , LS are the vapor and liquid molar flows of the system; subindex R and S correspond to the rectifying and stripping sections of the column, respectively.
Temperature and molar composition are related inversely by the vapor-liquid equilibrium phenomena in distillation columns, this equilibrium is considered in the presented model, which makes possible to determine trays temperatures from molar compositions and vice versa.
3.2 State-Space Model
The state-space model of the distillation column presented in this section is derived from the mathematical model described in subsection 3.1. The triangular form of the distillation column model guarantees the uniform observability of the system (Hammouri et al., 2002). The states of the model are the liquid compositions xi (i = 1,...,n), where n is associated to the number of trays in the column. They are represented in one vector:
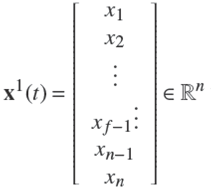
Physically, the elements of the vector x1 (t) represent the liquid compositions in both, the rectifying and the stripping section.
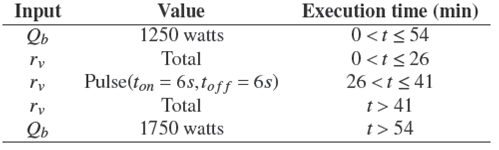
The two control variables are u(t) = [u 1(t) u 2(t)] T = [V L] T . These input variables can be manipulated by varying the heating power applied on the boiler, Qb (t), and the opening period of the reflux valve, rv (t), respectively.
If the bottom product composition x 12 can be measured, the measured output is ρ12(t) = x 12(t) T .
These notations allow to obtain the following compact representation of the dynamical mathematical model of the distillation column, considering discrete- time measurements:
 (5)
(5)
where x(t)=[x1(t)]T ϵRn,

And

Considering the distillation column model given in Eq. (5) the following assumptions are physically verified:
According to the Proposition given in Section 2, the continuous-discrete observer given by Eqs. (2) and (3) allows estimating the molar compositions x 1...x 12, based on the measurement of the bottom molar composition, x 12(t) = ρ(t).
4 FDI System
The continuous-discrete observer described in section 2 is used in the FDI system developed for a distillation column. The FDI system performance is validated, on-line, in a distillation column pilot plant (Figure 2) which is located at the Centro Nacional de Investigación y Desarrollo Tecnológico (CENIDET). The plant has 12 plates, including the boiler (tray 12) and the condenser (tray 1), 8 temperature sensors, located in plates 1, 2, 4, 6, 7, 9, 11 and 12. The temperature measurements obtained by these sensors are the secondary measurements used to estimate molar compositions and temperatures of the components in the distillation column using an azeotropic binary mixture (Ethanol-Water).

The FDI system detects additive failures at the (8) RTD Pt-100 temperature sensors located in the body of the column. The failure detection is performed by using a bank composed of continuous-discrete high- gain observers.
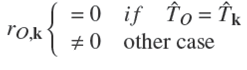
This work is based on the Dedicated Observer Scheme (DOS) (Chen y Patton, (2012); Frank, (1990), as shown in Figure 3. The DOS configuration allows detecting and locating simultaneous faults in the system by using a relatively simple procedure, easy to be implemented on-line.
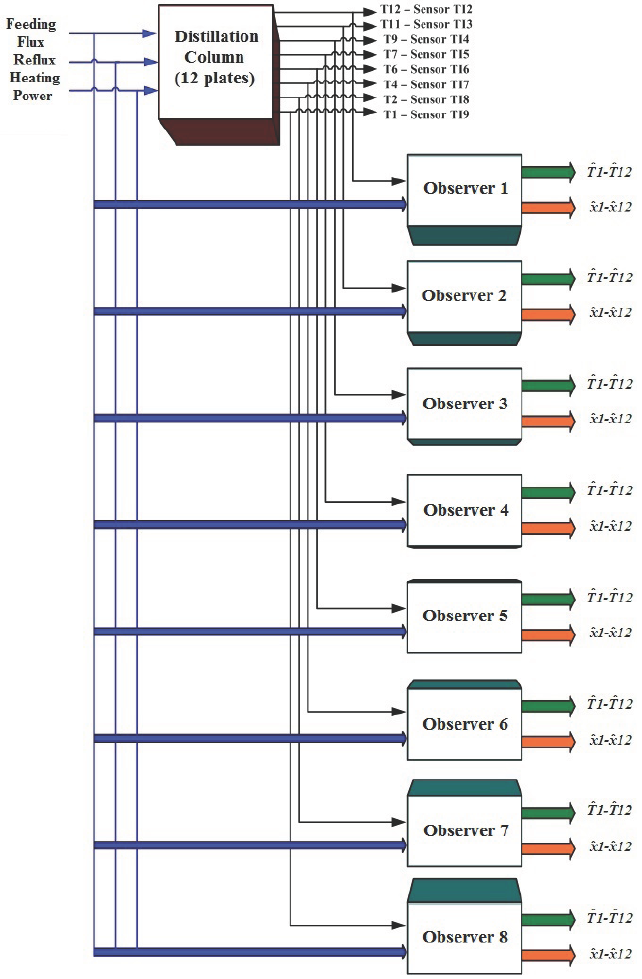
Figure 3 shows that every observer estimates temperatures and compositions for the 12 trays, using the manipulable variables of the system (reflux, feeding mixture and heating power) as well as the reference signal (measured temperature) used to obtain the estimation error.
Every reference temperature is measured by one temperature sensor, so the DOS bank has 8 observers. Because the observers used in the DOS bank require one temperature measurement, the bank can detect only 6 simultaneous failures in the temperature sensors.
4.1 Residual generation
The residual generation stage of the FDI system compares the estimated temperatures by the DOS bank.
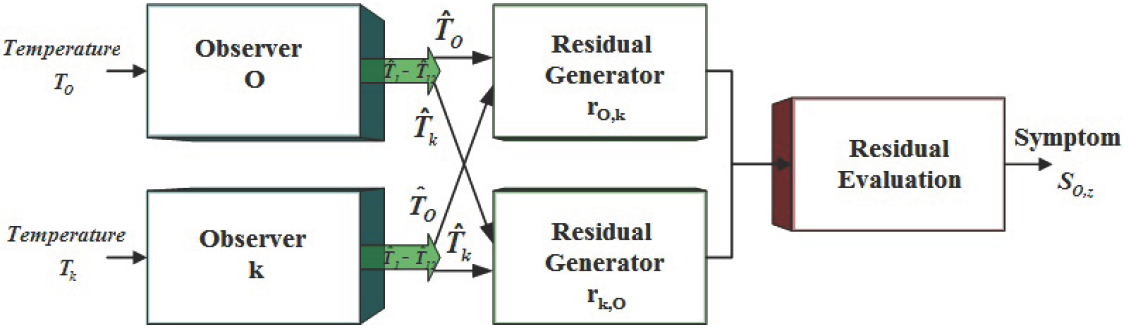
Because the estimation error is small in the tray whose measurement is taken as reference (less than 1%) (Téllez et al.,, 2012) the estimated value for this tray is considered as the measured value (without losing reliability). Table 1 presents the number assigned to every observer and the corresponding tray number.
Residual generation is based on comparing the temperature value estimated by the reference observer with the temperature value estimated by the rest of the bank observers for this particular tray, i.e.:
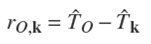 (6)
(6)
where O = 1, ..., 8 is the number of the observer considered as the measured value and k={1,...,8} ϶ {O} is the number of the observer to which it is compared.
By Eq. (6) it is possible to determine that
consistent measurement -estimation
Figure 4 shows the actual temperature behavior in tray 12, estimated by observers 8 and 7. As can be seen in Figure 3, the estimated measurements deviate from each other at t = 116 min due to the input conditions.

4.2 Failure signature generation
The main objective of the failure signature generation stage is determining if a failure exists in any sensor of the system. The signature generation is obtained by comparing the residual calculated in Eq. (6) to a reference threshold ξ.
The signal obtained by comparing two simultaneously-evaluated related residuals is called a symptom (Figure 6).

i.e.
 (7)
(7)
where ξ is the detection threshold, O = 0,...,7 is the number of the observer that represents the measured signal and ȥ = (O + 1),...,8 is the number of the observer used to compare the measured signal.
The FDI detection threshold is empirically determined to generate binary symptoms. A statistical analysis was performed over more than 50 experiments to obtain the minimum threshold.
Figure 7 shows the binary behavior of the symptom corresponding to the residual shown in Figure 5. The residual is compared to a threshold set at 0.5 oC , as can be seen, the symptom changes from 0 to 1 when the residual value is higher than the threshold value.

The 8 observers generate 28 symptoms (Eq. 7), allowing determining the failure signatures of the system. In the decision block, in order to locate the faulty sensor, a failure tree is designed for every sensor (Figure 8). The failure tree compares the signature generated by the obtained symptoms to the reference failure signatures to determine if a sensor failure occurs.

The FDI system can detect and locate simultaneous failures in 6 sensors. It can even detect transitory failures due to the dynamic characteristics of the system.
5 FDI experimental validation
The FDI system is validated, on-line, by using experimental data from the distillation column pilot plant. In both cases, the detection threshold was fixed in 3.5 oC , considering that the temperature deviation selected to simulate a failure was 4 oC (values under 3°C are considered as uncalibrated sensor, not as a failure, according to the sensor manufacturer specifications).
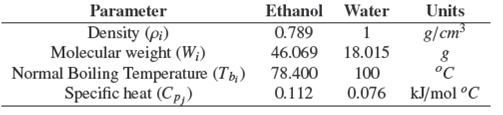
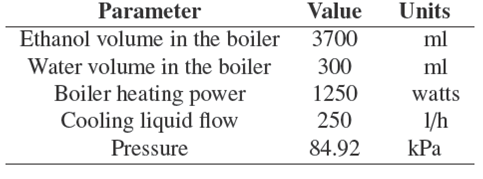
Two different experiments were performed: failure in one sensor and simultaneous failures in multiple sensors. An Ethanol-Water mixture is used in this experiment. The mixture characteristics are shown in Table 1, the initial operating conditions are shown in Table 2 and the process inputs in Table 3.
5.1 Failure in one sensor
In this experiment, a failure occurs when the temperature deviation in one sensor is induced to be equal or higher than 4°C. There are 8 available temperature measurements in the pilot plant, obtained by 8 RTD Pt-100 temperature sensors, which are located in plates: 1, 2, 4,6, 7, 9, 11 y 12.
In order to simulate a failure in tray 7, the selected deviation is induced in this sensor tray by adding an offset to the temperature measured by the corresponding sensor.
Every observer compositions and temperatures in the 12 plates of the plant, based on the measured temperature used as the reference input. The experimental validation is performed considering the plant in steady-state.
5.2 Simultaneous failures in multiple sensors
In this experiment a failure occurs when a temperature deviation is induced to be equal or higher than 4°C, simultaneously, in multiple sensors of the distillation pilot plant.
In order to simulate simultaneous failures in plates 1, 4 and 9 the selected deviation is induced in these trays by adding an offset to the temperatures measured by the corresponding sensors.
6 Results and discussion
The obtained results are presented graphically to facilitate their interpretation.
Obtained results - Failure in one sensor
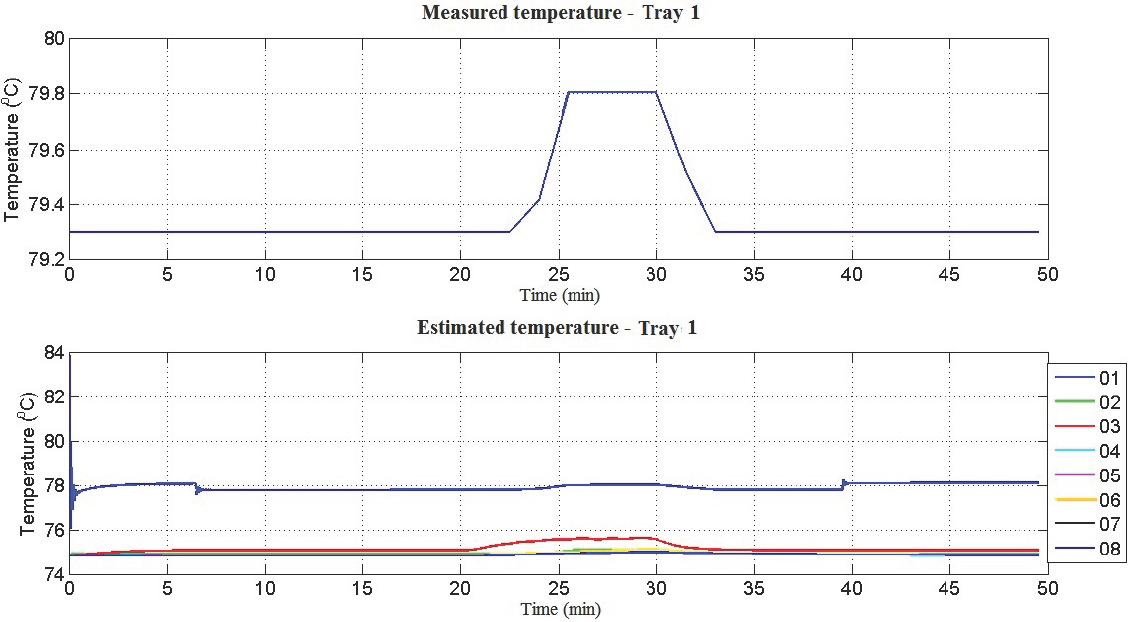
Figure 9 presents the temperature estimated by the 8 observers for the tray 7, where the failure occurs.

As can be seen in Figure 9, the estimated temperature by the observer corresponding to tray 7 has the 4 oC deviation induced as failure, while the rest of the observers estimate the temperatures corresponding to sensors without failures.
Figure 10 shows the residuals obtained by comparing the temperatures between the observer that present the deviation and the rest of the bank observers. The obtained results have a 4 oC value, which implies the failure is adequately detected.

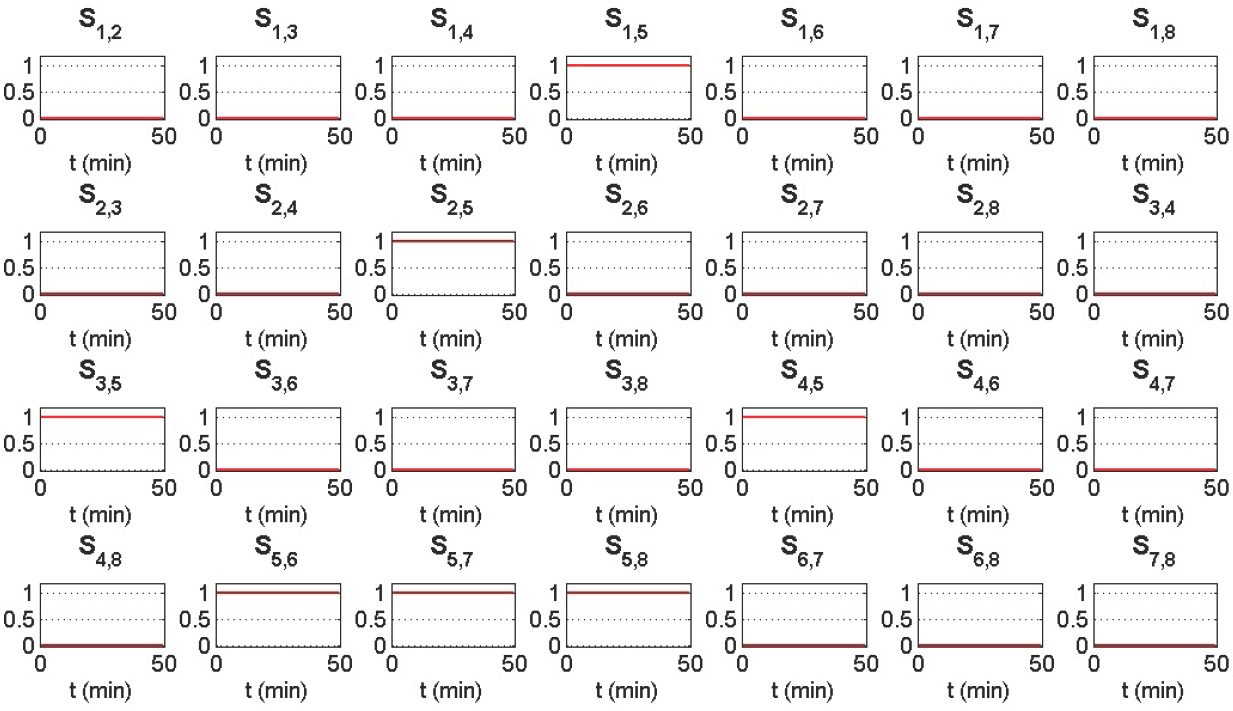
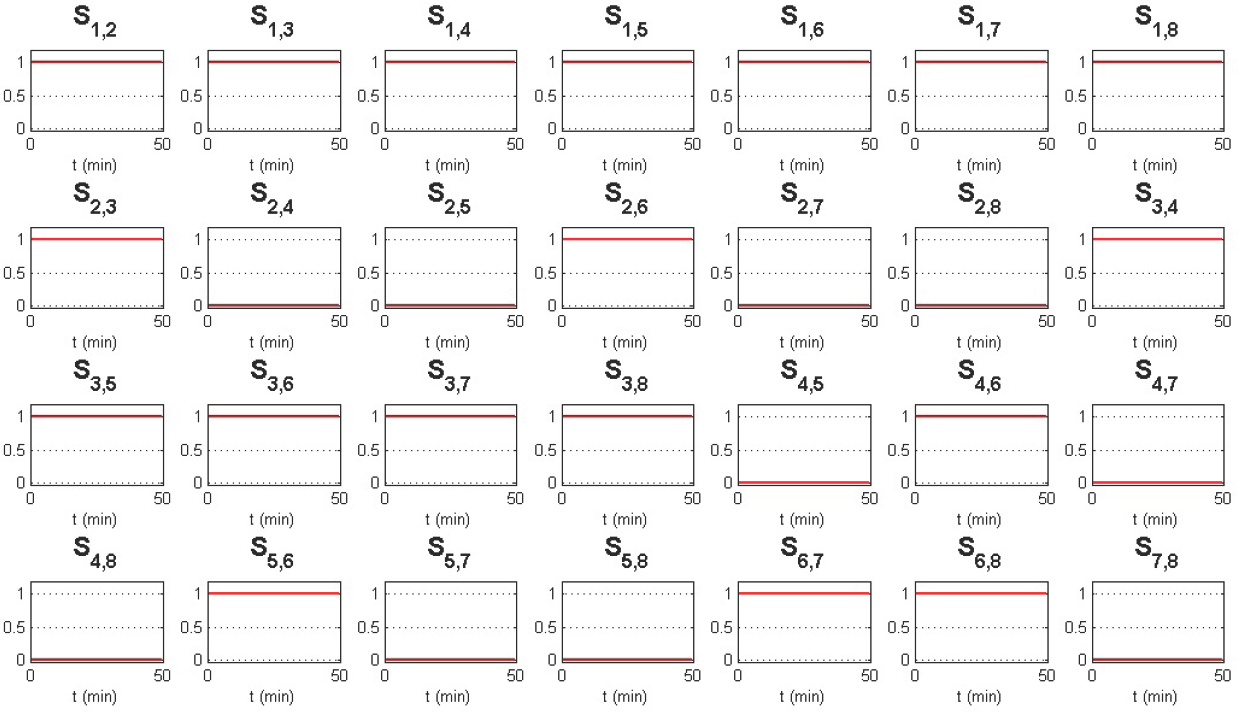
The reference threshold (ξ) is set at ±3.5°C to get the symptoms. Figure 11 shows the 28 obtained symptoms, as can be seen, the residuals involving observer 5 (S 1,5, S 2,5, S 3,5, S 4,5, S 5,6, S 5,7 and S 5,8) are equal to 1, indicating the sensor located in tray 7 fails.
Obtained results - Simultaneous failures in multiple sensors
Figures 12 to 14 show the estimated temperatures for plates 1, 4 and 9, respectively, by the 8 observers of the DOS bank.

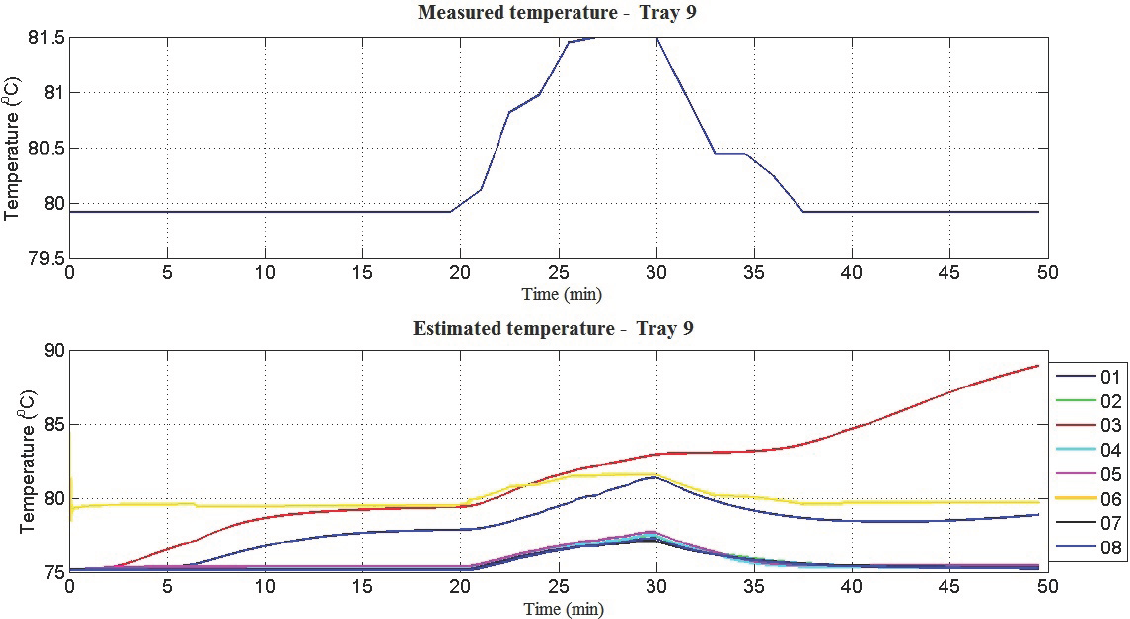
As can be seen in Figs. 12 to 14, the estimated temperatures in plates 1,4 and 9 by the corresponding observers have important differences compared to the rest of the observers without sensor failures.
Clearly, modifying the reference input signal of the observer implies a visible variation of the estimated temperatures in the 12 plates of the column.
Figure 15 shows the residuals obtained by comparing the estimated temperatures. As can be seen, residuals corresponding to sensors where failures occur have a higher deviation (r > 3°C) compared to residuals corresponding to sensors without failures (r < 1°C).

The reference threshold is set at ±3°C to get the corresponding symptoms. Figure 15 shows the 28 obtained symptoms, as can be seen, the residuals involving observers 1, 3 and 6 are equal to 1, indicating failures in the sensors located in plates 1, 4 and 9.
Discussion
As can be seen in the obtained results, the FDI system detects adequately the sensor induced failures in both cases, single and multiple and simultaneous.
Although the distillation column model selected in this work is simple and considers several simplification assumptions, the observer estimates the plates temperatures with a maximum estimation error lower than 2% (Téllezetal.,2012),which makes model and observer suitable to perform FDI tasks.
The noise measured by the sensors located at the body column is less than 0.05°C, due to the analog/digital converter included in the distillation pilot plant, which is lower than the minimum detection threshold determined for the FDI system, so it does not affect the failure detection.
Perturbations due to reflux, feeding flow, and heating power are common inputs for every observer, modifying every observer response. Although the effect for each observer has a different magnitude due to the selected model, this difference is small enough to be eliminated through an adequate sensor failure tree, meaning these perturbations do not affect the FDI results.
Conclusion
In this work, the development and on-line implementation of an FDI system based on continuous-discrete high-gain observers for a class of nonlinear systems having a triangular structure are presented. Due to the slow dynamics of the temperature in distillation columns it is possible to acquire the corresponding measurements neglecting the delayed effects.
The FDI system is designed by using a DOS bank and it was experimentally validated in a distillation pilot plant. The obtained results demonstrate that the FDI system detects, adequately, if a failure occurs in one or several sensors located in the pilot plant. The FDI system allows not only to detect simultaneous but also transitory failures due to the dynamic characteristics of the system.
By setting the reference threshold the system is capable of determining the magnitude of the failures, so it can provide valuable information to the user. Early detection of failures avoids damages in the plant. It also prevents high repair investment, if a failure occurs.

