


Servicios Personalizados
Revista
Articulo
 Inglés (pdf)
 Artículo en XML
 Referencias del artículo
 Enviar artículo por email
Indicadores
-
 Citado por SciELO
 -
 Accesos
Links relacionados
-
 Similares en
SciELO
Similares en
SciELO
Compartir

 Permalink
Revista mexicana de ingeniería química
versión impresa ISSN 1665-2738
Rev. Mex. Ing. Quím vol.10 no.3 Ciudad de México dic. 2011
Fenómenos de transporte
Analysis of the capillary extrusion of low–density polyethylene by using velocimetry
Análisis de la extrusión en capilar de un polietileno de baja densidad usando velocimetría
F. Rodríguez–González1, J. Pérez–González2* and B.M. Marín–Santibáñez3
1 Departamento de Ingeniería Química Industrial, Escuela Superior de Ingeniería Química e Industrias Extractivas.
2 Laboratorio de Reología, Escuela Superior de Física y Matemáticas. *Corresponding author. E–mail: jpg@esfm.ipn.mx Tel. 55–57–29–60–00, ext. 55032, Fax 55–57–29–60–00, ext. 55032.
3 Sección de Estudios de Posgrado e Investigación, Escuela Superior de Ingeniería Química e Industrias Extractivas. Instituto Politécnico Nacional, U. P. A. L. M., Del. Gustavo A. Madero, México D. F., México.
Received 30 of June 2011.
Accepted 17 of October 2011.
Abstract
The knowledge of the flow kinematics of polymer melts is relevant for their processing; as well as for the de sig n of molds and dies. However, the analysis of the flow behavior of polymer melts during extrusion has been typically performed by using rheometric measurements and numerical simulation. In this work, a description of the kinematics of a low–density polyethylene flowing under continuous extrusion through a transparent capillary die was performed by using the particle image velocimetry (PIV) technique coupled with rheometric measurements. The velocity maps for the polymer melt exhibited fully developed flow, meanwhile the flow rate data obtained from the velocity profiles agreed very well with the rheometric ones. The maximum difference in the volumetric flow rates by using the two methods was 6.5%, which shows the reliability of the PIV technique to describe the flow behavior of the polymer melt. The true flow and viscosity curves for the polymer melt were obtained from the measured wall shear stress and velocity profiles, in a wider shear rate range ihan the accessible by the capillary measurements, including the transition between the Newtonian and power–law regions. This allowed the viscosity data to be very well fitted by a Carreau constitutive equation.
Keywords: rheology, particle image velocimetry, polymer processing, extrusion, low–density polyethylene.
Resumen
El conocimiento de la cinemática de flujo de polímeros fundidos es relevante para su procesamiento, así como para el diseño de moldes y dados. Sin embargo, el análisis de su comportamiento en extrusión se ha realizado típicamente a través de medidas reométricas y simulaciones numéricas. En este trabajo se realizó una descripción detallada de la cinemática de flujo de un polietileno de baja densidad en extrusión empleando un dado transparente y acoplando la técnica de velocimetría por imágenes de partículas (PIV) con mediciones reométricas. Los mapas de velocidad del polímero fundido exhibieron flujo totalmente desarrollado, mientras que las medidas de flujo volumétrico obtenidas de los perfiles de velocidad mostraron una excelente concordancia con las reométricas. La máxima diferencia porcentual entre ambos métodos fue de 6.5%, lo cual indica la confiabilidad de la técnica de PIV para describir el comportamiento en flujo de polímeros fundidos. Las curvas de flujo y de viscosidad verdaderas se obtuvieron en un intervalo de razones de corte más amplio que el accesible mediante el uso del reómetro de capilar a partir del esfuerzo de corte en la pared y de los perfiles de velocidad, incluyendo la transición entre la región de flujo newtoniana y de ley de potencias. Esto permitió que los datos de viscosidad se ajustaran muy bien por una ecuación constitutiva de Carreau.
Palabras clave: reología, velocimetría por imágenes de partículas, procesamiento de polímeros, extrusión, polietileno de baja densidad.
1 Introduction
With the advent of modern technologies that permit the measurement of the velocity of particles moving in very short time intervals it has been possible to determine velocity maps in fluids, which provide precise details of their flow kinematics. However, the analysis of the flow behavior of polymer melts during extrusion has been typically performed by using rheometric measurements and numerical simulation. In spite of the large amount of publications on the extrusion flow of polymer melts, only a few works have been dedicated to the analysis of the underlying flow kinematics by using velocimetry. This may in part be due to the difficulties to implement velocimetry techniques during the extrusion of polymer melts at high temperatures and high pressures. The knowledge of the velocity field in polymer melts, however, is relevant for their processing as well as for the design of molds and dies.
The analysis of the flow field in fluids has been mainly done by using optical techniques like laser Doppler velocimetry (LDV) and particle image velocimetry (PIV), which are powerful non–invasive techniques to describe the flow kinematics in transparent fluids. Nevertheless, while LDV is a single–point measurement technique, PIV is a whole–field method that allows for the determination of instantaneous velocity maps of the flow region.
The pioneer work in the description of the flow kinematics in polymer melts by using velocimetry techniques includes the work by Mackley and Moore (1986), who measured the velocity profiles of high–density polyethylene (HDPE) during the steady state flow in a slit die by using LDV. Previously (as cited by Mackley and Moore (1986)), Kramer and Meissner had reported velocity profiles for low–density polyethylene (LDPE) flowing through and abrupt contraction in a rectangular duct.
Piau et al. (1995) carried out LDV measurements in a polybutadiene flowing through a slit channel and showed that slip, characterized by a nearly plug flow, occurred when the die surface was fluorinated. Munstedt et al. (2000) reported the first detailed description of the velocity profiles during the slit flow of HDPE by using LDV. These authors described the typical characteristics of the velocity profiles in the three regimes of the non–monotonic flow curve of HDPE. Later, Migler et al. (2001) developed an optical technique to visualize how polymer processing additives (PPA) eliminate the sharkskin defect in linear low–density polyethyelene (LLDPE). These authors measured tracking velocity profiles and the coating process of PPA in a sapphire capillary, and showed the presence of slip in the coated die and adhesion when this was uncoated. A more detailed description of the stick–slip kinematics of HDPE in a slit die was provided by Robert et al. (2004) also by using LDV. These researchers reported that slip was not homogeneous across the slit die, and suggested that the measured slip velocities were of the same order of magnitude as those measured in a capillary rheometer. Nigen et al. (2003) studied the entry flow of polybutadiene and its relation to flow instabilities in channel flow by using PIV. Recently, Rodríguez–Gonzalez et al. (2009) described for the first time the flow kinematics of the unstable flow of HDPE in a glass capillary die by using PIV. These authors sowed that the polymer exhibited shear thinning effects without slip at low shear rates, followed by an alternating behavior between full adhesion and slip in the unstable stick–slip regime, whereas both, the maximum velocity and the slip velocity of the melt, changed continuously during pressure oscillations. In addition, these authors showed that the velocity profiles cannot become plug–like in the presence of shear thinning effects in the melt and provided a proof for the basic assumption of the Mooney method by comparing velocity profiles obtained under slip and no slip flow conditions. Finally, Fournier et al. (2010) characterized the extrusion flow of polycarbonate and polystyrene in a rectangular die by using PIV. The measured velocity profiles in this case, showed good agreement with numerical simulations that considered the influence of slip at the die wall.
Capillary flow is very important since it is found in rheometers as well as in different polymer processing operations, particularly in extrusion dies and runners in molds. In the present work, we describe the kinematics of a low–density polyethylene (LDPE) flowing under continuous extrusion through a transparent capillary die, which to our knowledge has not been done before. In contrast to the flow behavior reported for HDPE, LDPE does not exhibit stick–slip instabilities or slip at the wall. Instead, its flow curve is monotonic, which allows the determination of the true flow and viscosity curve from a few velocity profiles, as well as to reach low shear rate values that are not accessible by using the macroscopic physical quantities provided by capillary measurements. To accomplish this goal, the two dimensional particle image velocimetry (2D PIV) technique has been coupled with rheometric measurements (rheo–PIV).
2 Experimental
2.1 Materials and rheometry
The polymer used in this work was a LDPE (Aldrich 428027) with a relative density in the solid state of 0.922 and melt index of 1.5 g/10 min (190ºC/2.16 kg). The relative density of the melt at T = 190 ° C was calculated from flow rate measurements at constant piston speed in a Rheotester 1000 Goettfert capillary rheometer, a value of 0.775 was obtained.
The experiments were carried out at a temperature of 190 ºC under continuous extrusion with a Brabender PL2100 single screw extruder of 0.019 m in diameter and length to diameter ratio of 25/1. The pressure drop (Δp) between capillary ends was measured with a DyniscoTM pressure transducer. The volumetric flow rate (Q) was determined by collecting and measuring the ejected mass as a function of time. From these data, the wall shear stress (τw) and the apparent shear rate ( app) were calculated as:


where L and D are the length and diameter of the capillary, respectively. Equation (1) is independent of the type of fluid, since it is obtained from a force balance in the capillary. Equation (2), however, is only valid for Newtonian fluids. The apparent s hear rate term is used to denote a calculation assuming a Newtonian flow behavior. For non–Newtonian fluids, the Rabinowitsch's correction should be applied to the apparent flow data [Bird et al. (1977)]. For a power–law fluid, τ = mn, (as is LDPE often assumed) the non–Newtonian shear rate is given by:
where m and n are the consistency and shear thinning index, respectively.
2.2 Capillary die fixture
A capillary die (D = 0.0017 m) made up of borosilicate glass, with an entry angle of 180º and L/D = 20, was attached to the extruder to carry out the measurements and no corrections for end effects were performed. This type of glass capillaries has been successfully tested in previous rheometric studies with polymer melts, and have been proved to produce reliable results [Pérez–González and de Vargas (1999)].
A fixture made up of stainless steel was adapted to the extruder die head in order to support the die as sketched in Fig. 1a. The fixture has two pairs of perpendicular windows, one pair was used to pass a laser light sheet through the flow region and the other for visualization. Image distortions produced by the curved geometry of the capillary were eliminated by using an aberration corrector, which was made up of a small rectangular prism with glass walls containing a fluid as shown in Fig. 1b. For this purpose, the refractive index (n) of the borosilicate glass capillary (nglass = 1.43) was closely matched by filling the prism with glycerol (ngly = 1 .47). In order to perform the PIV measurements, one part of the capillary corresponding to a length of 15D was kept inside the extruder die head at controlled temperature, and the rest of the capillary was inside the aberration corrector, in which the temperature was continuously monitored and supplied with preheated glycerol at the extrusion temperature before each measurement.

2.3 PIV measurements
PIV measurements were performed along with flow rate ones, right after achieving steady state flow conditions for each studied shear rate. The analysis of the flow kinematics in the capillary was performed with a 2D–PIV Dantec Dynamics system as sketched in Fig. 2. The 2D–PIV technique provides instantaneous measurements of the velocity vectors in a plane of the flow (velocity maps). For this purpose, the observation plane, in this case the center plane of the capillary, is illuminated by a laser light sheet, where two consecutive single exposed images of particles seeded in the fluid are obtained. This requires the fluid to be transparent. Each image is divided into subsections called interrogation areas, and the statistical displacement of the seeding particles between corresponding interrogation areas of the two consecutive images gives a displacement vector. This vector is calculated by a cross–correlation analysis of the light intensity scattered by the particles in the interrogation area. The resulting displacement vector is divided by the time elapsed between the two consecutive images to obtain the corresponding velocity vector. The seeding particles need to be small enough to follow the flow with minimal drag, but sufficiently large to scatter light to obtain a good particle image. In this case, the particles used were solid copper spheres < 10μm in diameter (Aldrich 32,6453) at a concentration of 0.5 % wt. (0.0425 v/v). This small amount of particles does not affect the rheological behavior of the polymer. Using the Einstein relation for spherical particles in a fluid, the increase in the viscosity due to the presence of particles is 0.1%, which is negligible.
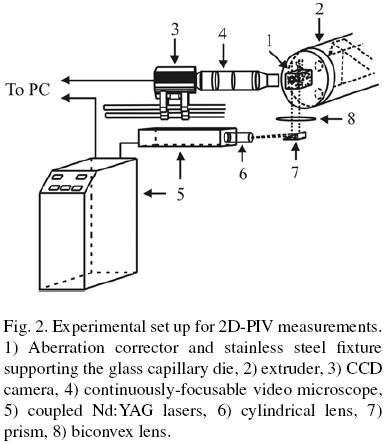
The PIV system utilized in this work consists of a high speed and high sensitivity HiSense MKII CCD camera of 1.35 Mega–pixels, two coupled Nd:YAG lasers of 50 mJ with λ = 532 nm and the Dantec Dynamic Studio 2.1 software. The light sheet was reduced in thickness up to less than 200pmi by using a biconvex lens with 0.05 m of focal distance, and then sent through the center plane of the capillary by using a prism oriented at 45° relative to the original direction of the laser beam. The prism was mounted on a rail carrier with a micrometer to measure horizontal displacements. The center plane of the capillary was found by horizontal displacements of the mirror up to see the longest chord on the image plane.
An InfiniVarTM continuously–focusable video microscope CFM–2/S was attached to the CCD camera in order to increase the spatial resolution. The images taken by the PIV system covered an area of 0.00171 m × 0.00323 m and were centered at an axial position z = 17D downstream from the contraction. Series of fifty image pairs were obtained for each flow condition and all the image pairs were correlated to obtain the corresponding velocity map. Then, the velocity as a function of the radial position (velocity profile) was obtained for a given axial position in each map and the fifty profiles were averaged in time to finish with a single velocity profile for each shear rate.
An adaptive correlation algorithm with a central difference approximation was used to calculate the velocity vectors. The interrogation windows were chosen as rectangles of 256 pixels long (axial direction) and 16 pixels wide (radial direction), which were equivalent to 615 μm × 38.4 μm. An overlap of 50% was used in both directions. With this size of the interrogation areas and the particle size used for seeding, the closest distance to the capillary wall at which we could measure was around 19 μm.
Finally, the velocity profiles, v(r), were integrated according to Eq. (4) to obtain the volumetric flow rate:

3 Results
3.1 Rheometry
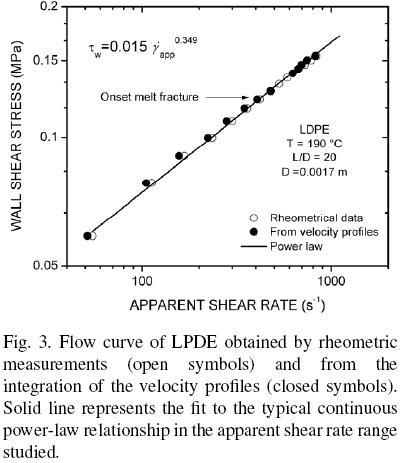
The rheometric flow curve for the LPDE is shown in Fig. 3, along with the one obtained from the integration of the velocity profiles according to Eq. (4). Even though the rheometric data show a slight deviation at the onset of the melt fracture regime, they are well fitted by the typical continuous power–law relationship in the apparent shear rate range studied (see the equation inserted in Fig. 3). Also, the data obtained from the velocity profiles agree well with the rheometric ones; the maximum difference in the volumetric flow rates obtained by using the two methods was 6.5%, which shows the reliability of the PIV technique to describe the behavior of the polymer melt in capillary flow.
3.2 PIV
Figure 4 shows the velocity maps in the capillary for different flow conditions. Note that almost all velocity vectors in each map are parallel to the flow direction, which shows that the flow in the observation region for the LDPE was unidirectional for the different apparent shear rates studied, with a velocity field simply given by vz = vz(r), as it is expected for a fully developed shear flow. Due to the large viscosity of polymer melts, the flow is laminar for typical extrusion rates. In this work, the Reynolds number (Re) for the maximum shear rate reached was only 1.82 × 10⁻³, which shows that the flow was always laminar during the experiments.

The PIV velocity profiles for the different apparent shear rates are shown in figures 5a–b along with the profiles calculated by considering the melt as a power–law fluid (continuous lines), namely:


where r is the radial position, R is the capillary radius and m and n are the power–law parameters of the equation inserted in Fig. 3. Observe that the velocity profiles are very well matched by the power–law relationship, while there is good agreement between the rheometric and PIV data (see Fig. 3). In addition, the standard deviation of the time average of the fifty profiles, which is represented by the error bars, shows variations below 5%, which indicates that the flow was steady. Also, it is interesting to note that all the velocity profiles in Figs. 5a–b extrapolate to zero value at the capillary wall, indicating the absence of slip. This result agrees with the well known fact that branched polyethylene do not exhibit slip at the die wall.
3.2.1 Determination of the flow and viscosity curves from velocity profiles
Due to the radial distribution of the shear stress in capillaries, i.e., τ = τ(r), the true flow curve for the polymer may be obtained from the velocity profiles if a proper determination of the true shear rate as a function of the radial position is performed. There is a range of shear rates and stresses in a capillary for a given flow rate, namely, 0 < r < R and 0 < τr < τw, which enables one to obtain the flow curve from the velocity profiles and the measured wall shear stress. The local shear rate may be calculated from the numerical derivative of the velocity profiles with respect to the radial position. Such a calculation was performed in this work by a central difference approximation as shown below:

where v and r represent the local velocity and radial position, respectively. Meanwhile, the corresponding shear stress was calculated from the measured τw by:

The flow curve calculated by using the velocity profiles corresponding 54.78, 112.31, 167.1, 359.79 and 834.31 s–1, respectively, is displayed in Fig. 6 along with that obtained by applying the Rabinowitsch correction to the rheometric data [Bird et al. (1977)]. The segments of the flow curve reconstructed from the velocity profiles are represented with different symbols for the sake of clarity. It may be clearly observed that the data obtained from the velocity profiles follow the trend of the rheometric ones very well. Moreover, the PIV data extend to lower shear rate values than the rheometric w. This is a valuable fact, since allows one to reach low shear rate values that are not accessible by using the macroscopic physical quantities provided by capillary measurements. In this case, the low shear rate values obtained from velocity profiles extend well into the transition between the Newtonian and power–law regions, which is clearly observed in the shear viscosity curve shown in Fig. 7.

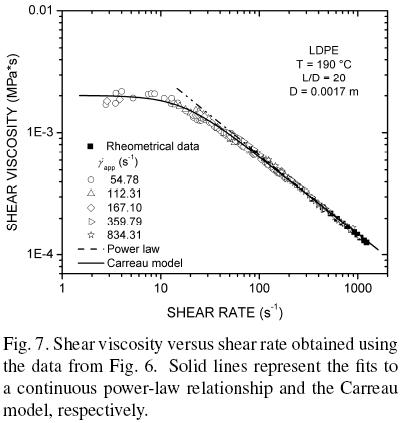
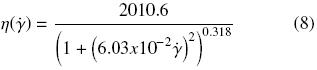
The wider shear rate range covered by the data in Fig. 7 permits the fitting of the viscous behavior of the LDPE, η = η(), by a more realistic constitutive equation that includes the response at low shear rates. In this case, the data are very well fitted by the Carreau model as given below:
Finally, the results in this work show the benefits of using the PIV technique to analyze the flow behavior of polymer melts and its reliability. The most limiting issue to implement this technique in polymer processing is the design of transparent molds and dies able to withstand the high pressures generated in polymer processing operations. However, the insight that may be obtained from the analysis is indeed valuable.
Conclusions
The flow kinematics of the LDPE was analyzed in this work by using the PIV technique coupled to rheometric measurements (Rheo–PIV). PIV has been proved to be a reliable characterization technique for polymer melts. The flow curve obtained from PIV data showed very good agreement with the rheometric measurements. The true flow and viscosity curves for the polymer obtained from the velocity profiles extend to lower shear rate values than the rheometric one and showed a transition between Newtonian and power–law regions. This is a valuable fact, since the flow curve may be extended to low shear rate values that are not easily accessible by using a capillary rheometer. Then, the data may be well fitted by a more realistic constitutive equation.
Acknowledgments
This research was supported by SIP–IPN (No. Reg. 20111119). J. P.–G. is COFFA–EDI fellow. B. M. M.–S. has a fellowship under the CONACyT program for Consolidacion Institucional de Grupos de Investigación (Sol. 147970).
References
Bird R.B., Armstrong R.C., Hassager O. (1977). Dynamics of Polymeric Liquids. Vol. 1. John Wiley & Sons. USA. [ Links ]
Fournier J.E., Lacrampe M.F., Krawczak P. (2009). Characterization of extrusion flow using particle image velocimetry. Express Polymer Letters 3, 569–578. [ Links ]
Mackley M.R., Moore, I.P.T. (1986). Experimental velocity distribution measurements of high density polyethylene flowing into and within a slit. Journal of Non–Newtonian Fluid Mechanics 21, 337–358. [ Links ]
Migler K.B., Lavallee C., Dillon M.P., Woods S.S., Gettinger C.L. (2001). Visualizing the elimination of sharkskin through fluoropolymer additives: Coating and polymer–polymer slippage. Journal of Rheology 45, 565–581. [ Links ]
Münstedt, H., Schmidt, M., Wassner, E. (2000). Stick and slip phenomena during extrusion of polyethylene melts as investigated by laser–Doppler velocimetry. Journal ofRheology 44, 413–427. [ Links ]
Nigen S., El Kissi N., Piau J.M., Sadum S. (2003). Velocimetry field for polymer melts extrusion using particle image velocimetry stable and unstable flow regimes. Journal of Non–Newtonian Fluid Mechanics 112, 177–202 [ Links ]
Pérez–González J., de Vargas L. (1999). On the rheological characterization of polyethylene melts by using glass capillaries. Polymer Testing 18, 397–403. [ Links ]
Piau, J. M.; Kissi, N., Mezghani, A. (1995). Slip flow of polybutadiene through fluorinated dies. Journal of Non–Newtonian Fluid Mechanics 59, 11–30. [ Links ]
Robert L., Demay Y., Vargnes B. (2004). Stick–slip flow of high density polyethylene in a transparent slit die investigated by laserDoppler velocimetry. Rheologica Acta 43, 89–98. [ Links ]
Rodríguez–González F., Pérez–González J., Marín–Santibanez B. M., de Vargas L. (2009). Kinematics of the stick–slip capillary flow of high–density polyethylene. Chemical Engineering Science 64, 4675–4683. [ Links ]

