


 text new page (beta)
 English (pdf)
 Article in xml format
 Article references
 Send this article by e-mail
 Cited by SciELO
  Similars in
SciELO
Similars in
SciELO 
 Permalink
INTRODUCTION
Chronic hepatitis C (CHC) is a major public health issue, affecting over 174 million people worldwide, leading to cirrhosis and hepatocellular carcinoma and being the most frequent cause of liver transplantation in many countries.1 Recently, direct-acting antiviral drugs have revolutionized the treatment of CHC, allowing patients to reach sustained virological response in around 90% of cases. Nevertheless, these treatments are extremely expensive, which has caused widespread concern.1 - 4
Currently, treatment is recommended for all patients with CHC, but, if resources limit the possibility of treating everyone, patients with advanced fibrosis or cirrhosis (METAVIR stages F3 and F4) should be prioritized.5 , 6 Yet, when the cost-effectiveness of treating patients with early stages of fibrosis was specifically evaluated, one study demostrated that treatment was cost-effective mainly for patients with METAVIR stage F2 or worse,4 and the other showed that treating patients with METAVIR stage F2 or greater was highly cost-effective and that treating patients with METAVIR stage FI was borderline cost-effective.3 The above mentioned demonstrates the importance of staging liver fibrosis in patients with CHC.
Liver biopsy is the reference standard for staging fibrosis. Even though, it has several limitations: it is an invasive procedure, carrying a risk of rare, but severe complications; there could be sampling error and interobserver variability; it is costly; it is poorly accepted by many patients, especially when it is recommended for long term follow-up. These limitations have led to the development of non-invasive methods for staging fibrosis. Many non- invasive methods have been studied with this purpose, and liver stiffness measurement through transient elastography (TE) and aspartate aminotransferase (AST) to platelet ratio index (APRI) are probably two of the most frequently used.7
Performing TE requires an expensive equipment, which is not widely available, especially in developing countries. On the other hand, calculating APRI is easy and it involves parameters which are already part of the routine workup of CHC patients, thus not implying new costs to the management of such patients. Therefore, the objective of the present study is to verify if TE is superior to APRI for staging liver fibrosis in patients with CHC through a systematic review with meta-analysis.
MATERIAL AND METHODS
In order to evaluate if TE is superior to APRI for staging liver fibrosis in patients with CHC, a systematic review and meta-analysis of studies was performed. MEDLINE, EMBASE and Cochrane Database of Systematic Reviews databases were searched by two independent researchers (AZM and AAM) between August 25th and September 8th, 2015. The search strategy used in MEDLINE was the following: "Hepatitis C" or "HCV" and "Elasticity Imaging Techniques" or "Elastography" or "Fibroscan" and "AST to Platelet Ratio Index" or "APRI" and "Liver Biopsy". Similar search strategies were used in the other databases. Reference lists of the retrieved studies were hand searched.
Retrieved studies were evaluated based on their titles and abstracts, and those identified as relevant for the present systematic review were analyzed based on their full-text. Studies were considered eligible if they evaluated adult patients with CHC and compared staging of liver fibrosis determined by TE and by APRI to the results obtained by liver biopsy (reference standard). Exclusion criteria were the following: studies with patients younger than 18 years of age; studies in which data on patients with CHC were not provided separately from data on patients coinfected with HIV or HBV or from data on patients with liver diseases other than CHC; studies on specific populations of CHC patients (for instance, transplanted patients, patients on dialysis, patients with hemoglobinopathies or bleeding disorders); studies that did not provide data on all three diagnostic methods (TE, APRI and liver biopsy). Besides, studies written in languages other than English, Portuguese and Spanish were excluded, as well as those published only as abstracts (with no full-text available).
Data extraction was performed by two independent investigators (AZM, AAM), and a predefined data collection sheet was used. Disagreements were resolved by consensus. Authors were contacted for clarification of their studies whenever necessary. Quality of evidence was evaluated according to Quality Assessment of Diagnostic Accuracy Studies-2 (QUADAS-2).8
Regarding the meta-analysis, a random-effects model was used, anticipating a possible heterogeneity among studies. Diagnostic odds ratio (DOR) (with a 95% confidence interval - 95% Cl) was chosen as the main effect measure, and the DerSimonian-Laird method was used in the analysis. Summary receiver operating characteristic (SROC) curves were created, according to Moses' method. Besides, summary sensitivity, specificity, positive likelihood ratio (PLR) and negative likelihood ratio (NLR) were also pooled. Statistical significance was set at p < 0.05. Heterogeneity was assessed by the I2 statistic and by the heterogeneity χ2 test (p < 0.05), as well as by a visual analysis of the forest plots. After data extraction, if any study had a cell with the value of zero, 0.5 was added to every cell of that study in order to make the meta-analysis possible. A sensitivity analysis was planned, in which the meta-analysis would be repeated excluding each study at a time. MetaDiSc 1.4 (Unit of Clinical Biostatistics of the Ramón y Cajal Hospital, Madrid, Spain) and Review Manager 5.3 (The Nordic Cochrane Centre, The Cochrane Collaboration, Copenhagen, Denmark) software were used in the analysis. The study protocol was registered in PROSPERO database (CRD42015029838).
RESULTS
The search strategy retrieved 205 references. After analyzing titles and abstracts, 15 studies were excluded for being reviews (not providing original data), 37 for not providing data on at least one of the three required diagnostic methods (TE, APRI and liver biopsy), 67 for addressing a different subject or a different population of patients, 29 for not being published as a full-text paper (studies published only as abstracts), two for being published in other languages than those prespecified and 27 for being identical duplicates. Therefore, 28 references were selected for full-text analysis.9 - 36 After full-text evaluation, one study was excluded for addressing a different population of patients than the prespecified one,9 seven articles were excluded for not providing data for patients with CHC separately from data for patients with other causes of liver diseases10 - 16 and 11 studies were excluded for not providing data on at least one of the three required diagnostic methods.17 - 27 One study28 was suspected of being a non-identical duplicate of another.32 An attempt to contact an author by electronic mail was made in order to clarify this, but there was no answer, and the study with the smaller sample was excluded.28 Finally, eight studies were included in the meta-analysis.29 - 36 The flowchart for the search strategy is shown in figure 1.

Figure 1 Flowchart for the search strategy. The number of studies retrieved from each database is shown, as well as the number of included and excluded studies, with the reason for exclusion.
Seven of the included studies presented data on prediction of significant liver fibrosis (METAVIR stages F2- 4) .29 , 31 - 36 Only one of the included studies presented data on prediction of advanced liver fibrosis (METAVIR stages F3-4),33 and, therefore, this outcome was not evaluated in the meta-analysis. According to this study, TE at a cut-off of 9.00KPa had a sensitivity of 69.57%, a specificity of 84.73%, a PLR of 4.56, a NLR of 0.36 and an accuracy of 79.66% for the prediction of advanced liver fibrosis. On the other hand, these values for APRI at a cut-off of 1.69 were 61.40%, 77.47%, 2.73, 0.50 and 72.38% respectively.33 Prediction of liver cirrhosis (METAVIR stage F4) was evaluated by four studies.30 , 32 , 34 , 36 Two studies evaluated the prediction of Ishak stages 5-6 of fibrosis,31 , 35 but they were not pooled together with the other four which evaluated prediction of METAVIR stage F4 in the main analysis because Ishak stage 5 of fibrosis still cannot be considered as established cirrhosis. Table 1 shows the characteristics of the included studies.
Regarding to the evaluation of the quality of the evidence according to QUADAS-2, there were high risk of bias and low applicability concerns. Overall, the quality of the evidence was considered to be low. Figure 2 summarizes the evaluation of the quality of the evidence.
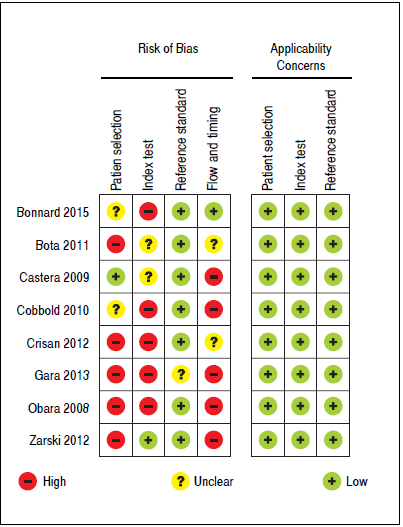
Figure 2 Methodological quality summary according to Quality Assessment of Diagnostic Accuracy Studies-2 (QUADAS-2).
Concerning prediction of significant liver fibrosis as the outcome, the meta-analysis assessed data on 1,579 patients. The pooled DOR for TE was 11.70 (95%CI = 7.13- 19.21), without significant heterogeneity among studies (heterogeneity 2 = 11.92, p = 0.064,12 = 49.70%). Figure 3A presents the forest plot for this analysis. Pooled sensitivity, specificity, PER and NER are shown in table 2. The analysis of diagnostic threshold suggested a threshold effect (Spearman correlation coefficient = 0.786, p = 0.036). Figure 4A presents the SROC curve for this analysis (area under the curve of 0.83).
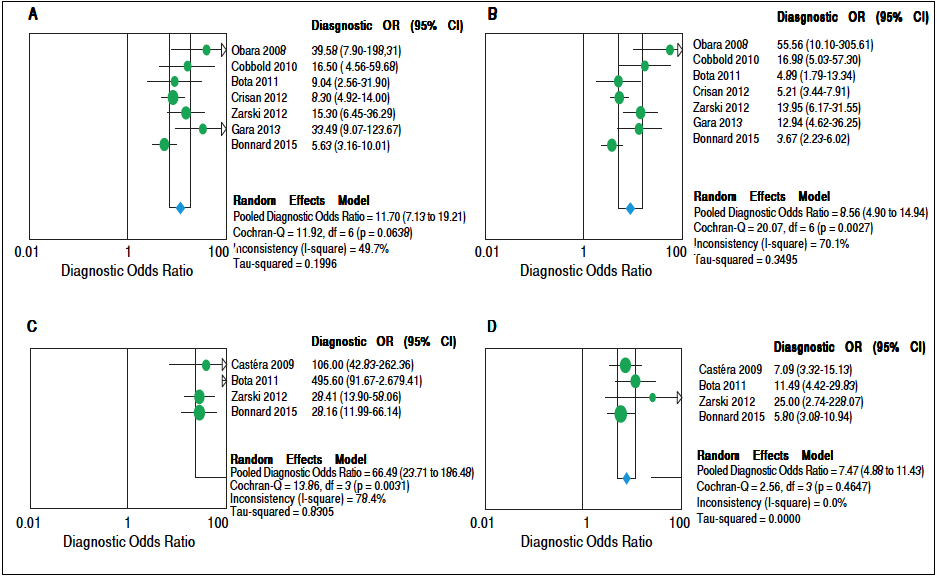
Figure 3 Forest plots of the random-effects model meta-analyses for the diagnostic odds ratio of transient elastography and aspartate aminotransferase to platelet ratio index, in comparison to liver biopsy, for the prediction of significant liver fibrosis and cirrhosis. A. Transient elastography for the prediction of significant fibrosis. B. Aspartate aminotransferase to platelet ratio index for the prediction of significant fibrosis. C. Transient elastography for the prediction of cirrhosis. D. Aspartate aminotransferase to platelet ratio index for the prediction of cirrhosis. Each study is identified by the name of the first author and year of publication. Circles indicate the diagnostic odds ratios, and their sizes are proportional to the weights of the studies. The horizontal bars refer to the 95% confidence interval (CI) of the diagnostic odds ratios. The vertical line is the equivalence line, where the diagnostic odds ratio is 1. The diamond represents the 95% CI of the pooled diagnostic odds ratio. OR: Odds Ratio. CI: Confidence Interval.
Table 2 Pooled diagnostic odds ratio, sensitivity, specificity and positive and negative likelihood ratios of transient elastography and aspartate aminotransferase to platelet ratio index for the prediction of significant liver fibrosis and cirrhosis.
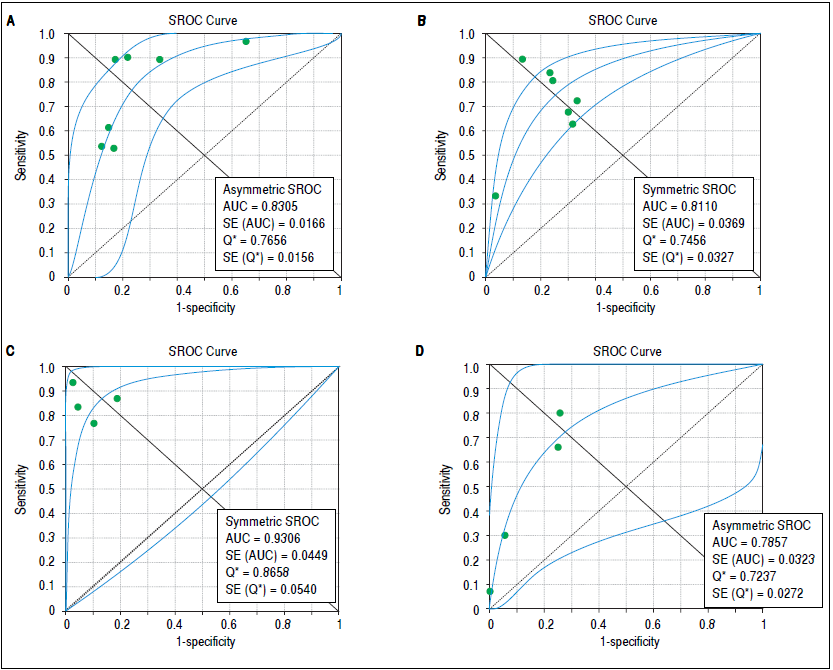
Figure 4 Summary receiver operating characteristic curves on the diagnostic accuracy of transient elastography and aspartate aminotransferase to platelet ratio index for the prediction of significant liver fibrosis and cirrhosis. A. Transient elastography for the prediction of significant fibrosis. B. Aspartate aminotransferase to platelet ratio index for the prediction of significant fibrosis. C. Transient elastography for the prediction of cirrhosis. D. Aspartate aminotransferase to platelet ratio index for the prediction of cirrhosis. SROC: Summary receiver operating characteristic. AUC: area under the curve. SE: standard error.
Still considering significant fibrosis as the outcome, the pooled DOR for APRI was 8.56 (95%CI = 4.90-14.94), with significant heterogeneity among studies (heterogeneity χ2=20.07, p = 0.003, I2 = 70.10%). Figure 3B presents the forest plot for this analysis. Pooled sensitivity, specificity, PER and NER are shown in table 2. The analysis of diagnostic threshold did not demonstrate a threshold effect (Spearman correlation coefficient = -0.143, p = 0.760). Figure 4B presents the SROC curve for this analysis (area under the curve of 0.81).
For the prediction of significant fibrosis, there was no evidence of significant difference between TE and APRI for DOR, sensitivity, PLR and NLR. On the other hand, APRI had significantly greater specificity than TE. Both tests had good accuracy, and the area under the SROC curve seemed to be similar between them.
Regarding prediction of cirrhosis as the outcome, the meta-analysis assessed data on 1,204 patients. The pooled DOR for TE was 66.49 (95% Cl = 23.71 - 186.48), with significant heterogeneity among studies (heterogeneity χ2 = 13.86, p = 0.003,12 = 78.40%). Figure 3C presents the forest plot for this analysis. Pooled sensitivity, specificity, PLR and NLR are shown in table 2. The analysis of diagnostic threshold did not show a threshold effect (Spearman correlation coefficient = -0.400, p = 0.600). Figure 4C presents the SROC curve for this analysis (area under the curve of 0.93).
Still regarding cirrhosis as the outcome, the pooled DOR for APRI was 7.47 (95%CI = 4.88-11.43), without significant heterogeneity among studies (heterogeneity χ2 = 2.56, p = 0.465, I2 = 0%). Figure 3D presents the forest plot for this analysis. Pooled sensitivity, specificity, PLR and NLR are shown in table 2. The analysis of diagnostic threshold suggested a threshold effect (Spearman correlation coefficient = 1.000, p < 0.001). Figure 4D presents the SROC curve for this analysis (area under the curve of 0.78).
For the prediction of cirrhosis, there was no evidence of significant difference between TE and APRI for specificity and PLR. On the other hand, TE had significantly better DOR, sensitivity and NLR than APRI. The area under the SROC curve was greater for TE, which showed excellent accuracy for the prediction of cirrhosis, while the accuracy of APRI was only fair.
A sensitivity analysis was performed, excluding each study at a time from the meta-analysis. Regarding prediction of significant fibrosis as the outcome, only the exclusion of the study of Zarski, et al.34 would significantly change results. Concerning TE, sensitivity would decrease to 0.60 (95%CI = 0.56-0.63), and specificity would increase to 0.83 (95%CI = 0.79-0.86), while DOR, PLR and NLR would not suffer significant changes. In relation to APRI, sensitivity would increase to 0.70 (95%CI = 0.67- 0.73), and specificity would decrease to 0.71 (95%CI = 0.66-0.75), while DOR, PLR and NLR would not suffer significant changes.
Regarding prediction of cirrhosis, the exclusion of neither of the studies would significantly change characteristics of TE. On the other hand, concerning APRI, the exclusion of the study by Zarski, et al 34 would decrease specificity to 0.81 (95%CI = 0.78-0.84), and the exclusion of the study by Bonnard, et al 36 would increase specificity to 0.92 (95%CI = 0.90-0.94), while the other aspects of the test would not suffer significant changes. A sensitivity analysis pooling both studies which evaluated the prediction of Ishak stages 5-6 of fibrosis31 , 35 together with the studies which evaluated the prediction of Metavir stage F4 did not significantly change the performances of neither TE nor APRI.
DISCUSSION
CHC is a common disease, which can lead to serious complications and death. Recently, very effective new treatments for CHC have been developed, but their costs prevent that every patient is treated in most countries, and it is recommended that those with more severe fibrosis are prioritized.5 , 6 Therefore, staging liver fibrosis remains important, and the possibility of doing it in a non-invasive manner is appealing. The present meta-analysis compared two of the most frequently used non-invasive methods for staging liver fibrosis in CHC, considering liver biopsy as the reference standard, and it demonstrated that thare is no evidence of superiority of TE over APRI for the prediction of significant fibrosis. This finding is especially important in the context of developing countries, where TE is not widely available, mainly because of its costs, while APRI can be easily calculated without adding costs to the management of CHC patients. On the other hand, it showed that TE is better than APRI for the prediction of cirrhosis.
We are unaware of other meta-analyses which had evaluated both these non-invasive methods, including only studies that had compared them head-to-head and that had used liver biopsy as the reference standard. This is important in order to reduce heterogeneity. Besides, we only considered data on patients with CHC, since it is known that the performance of these methods is different according to the kind of liver disease. Moreover, this study presented robust results, since most of them were not subject to changes in the sensitivity analyses.
Prediction of significant liver fibrosis probably is the most important outcome to be considered when the objective of the non-invasive tests is defining which patients should be treated for CHC. Even though treatment could be recommended for all patients with CHC,5 , 6 the costs of treatments limit the applicability of such recommendation, and there are evidences that treating patients with METAVIR stage F2 or worse is highly cost-effective, which certainly should be taken into consideration when deciding what groups of patients will be actually treated.3 , 4 In this context, the present study showed that, despite having a good accuracy, both TE and APRI have sensitivities that seem insufficient for them to be used as substitutes for liver biopsy. Yet, if they are used, there is no evidence that TE is superior to APRI, which does not add costs to the routine workup of patients with CHC and is much more widely available than TE.
In a previous systematic review, despite not performing a meta-analysis, authors came to a similar conclusion. They suggested that, in order to differentiate between minimal and significant fibrosis, readily available non-invasive tests, such as APRI, could be used for initial evaluation, since more sophisticated methods, such as TE, had failed to demonstrate an increased diagnostic performance. These authors also suggested that using multiple non-invasive tests could be beneficial.37
The evaluation of the diagnostic performance of TE and APRI for the prediction of advanced liver fibrosis would also have been interesting since it is recommended for prioritizing patients for treatment.5 , 6 Nevertheless, as there was only one study which analyzed this outcome,33 it was not possible to evaluate it in the meta-analysis. On the other hand, considering that recent evidence suggested that treating patients with significant fibrosis probably is the most cost-effective strategy,3 , 4 we understand that the fact of not being possible to perform a meta-analysis on advance fibrosis is only a minor limitation of the present study.
Another interesting outcome for the non-invasive tests is the prediction of cirrhosis, because, besides receiving treatment for CHC, cirrhotic patients need to be screened for hepatocellular carcinoma and esophageal varices. With this aim, TE presented good sensitivity, which is of the utmost importance in order to reduce the risk of missing patients who should be screened for these complications. Besides, TE had an excellent accuracy for the prediction of cirrhosis. On the other hand, APRI had only a fair accuracy and, more importantly, it had low sensitivity, which would not allow it to be used to rule out cirrhosis. This might be explained by the findings of a previous metaanalysis, which evaluated exclusively APRI.38 The study described an area under the SROC curve quite similar to ours (area under the curve of 0.82 - 95%CI = 0.79-0.86), but it evaluated two different cut-off points for cirrhosis separately, showing that the summary sensitivity was 76% for a cut-off point of 1.0 and only 49% for a cut-off point of 2.O.38 Our study verified the presence of a threshold effect for APRI in the prediction of cirrhosis, which reflects the variation of the performance of the test according to different cut-off points.
Many of the analyses performed in the present study demonstrated evidence of heterogeneity among included studies. As previously mentioned, at least in part, this can be associated to the variability of cut-off points used in the different studies for both tests and to the presence of a threshold effect. This variability of cut-off points and the associated variability in the performances of the tests had already been suggested by a previous systematic review, in spite of the absence of a proper meta-analysis in that study.37 In order to better understand the heterogeneity among studies, we performed sensitivity analyses. Nevertheless, these sensitivity analyses led only to minor and probably irrelevant changes in the results.
An important limitation of the present study relates to the quality of the available evidence. We chose to include in the meta-analysis only studies which evaluated both tests, TE and APRI, in the same population of patients, comparing them to liver biopsy as the reference standard, in order to decrease risk of heterogeneity among studies and to increase the quality of the evidence. However, studies were considered to have a high risk of bias in many of the evaluated domains. Therefore, according to QUAD- AS-2, the quality of the evidence was considered to be low, and this should be kept in mind when interpreting our findings.
In conclusion, there is no evidence of significant superiority of TE over APRI for predicting significant liver fibrosis in patients with CHC, an outcome which has great value regarding indication of therapy against hepatitis C virus. Moreover, neither of these non-invasive tests seems to have sufficient sensitivity in order to replace liver biopsy in this context. Regarding the prediction of cirrhosis, TE has a good diagnostic performance and seems to be superior to APRI.
ABBREVIATIONS
APRI: |
Aspartate aminotransferase to platelet ratio index |
AST: |
Aspartate aminotransferase |
AUC: |
Area under the curve |
CHC: |
Chronic hepatitis C |
Cl: |
Confidence interval |
DOR: |
Diagnostic odds ratio |
NLR: |
Negative likelihood ratio |
PLR: |
Positive likelihood ratio |
QUADAS-2: |
Quality Assessment of Diagnostic Accuracy Studies-2 |
SROC: |
Summary receiver operating characteristic |
TE: |
Transient elastography |

