nueva página del texto (beta)
 Inglés (pdf)
 Artículo en XML
 Referencias del artículo
 Enviar artículo por email
 Citado por SciELO
  Similares en
SciELO
Similares en
SciELO 
 Permalink
Introduction
Improvements in immunosuppressive drugs (ISD) have significantly increased survival rates of liver transplant recipients. Thus, one-year survival after liver transplantation (LT) currently reaches 85-90%, and 50% after ten years (http://www.eltr.org/, http://www.unos.org/). However, ISDs are toxic and commonly have severe side effects, affecting survival and quality of life of liver recipients,1-3 with infections acting as the main cause of mortality during the first year after LT (85%).4 In the long-term, most cases of morbidity and mortality of LT recipients are related to side effects of ISD, mostly calcineurin inhibitors (CNI), although steroids, antimetabolites and mTOR inhibitors are also related to significant side effects.5 In a recent study, two thirds of the deaths that occurred one year after LT were unrelated to graft failure. Infact, most deaths were attributable to ISD side effects such as infections, renal failure, cancer and cardiovascular diseases.5-8 Renal failure is a common cause of morbidity after LT. The incidence of a glomerular filtration rate (GFR) of 30 mL/min or less is 18.1% five years after LT.6 Importantly, renal failure seems to be independently related to mortality among liver recipients.5,6 Indeed, the relation between renal failure and mortality after LT seems to be even more important when renal failure occurs late after LT.5 Considering these facts, several strategies have been developed to minimize the nephrotoxicity related to CNI,9-17 delaying, reducing or eliminating recipient’s exposure to them. Some of these strategies consider introducing mycophenolate mofetyl (MMF) in order to minimize the CNI dose.17 Compared to CNI, MMF is a weaker ISD, with a better side-effect profile and specifically, no reported nephrotoxicity. MMF use allows to reduce CNI (or its complete withdrawal), in order to preserve or improve renal function after iver transplantation as has recently been shown by a systematic review that included eight high quality randomized trials.18 Nonetheless, CNI reduction or withdrawal carries a risk of allograft dysfunction. The goal then, is to establish a balance between the potential improvement of renal function and the risk of graft rejection before minimizing CNI. The available data show that although conversion to MMF monotherapy (CMM) implies a relative risk of graft rejection of 4.96, CMM is not associated with increased risk of graft loss or death, suggesting that with proper monitoring, adequate recipient selection and a prompt initiation of rejection treatment (if it develops), the risks involved in CNI minimization by employing MMF are reasonable.18
Presently, most studies are designed to demonstrate the advantages of CMM to preserve renal function, but not specifically to identify variables associated with successful CMM. A recent study by Benítez, et al. identified clinical variables associated with successful withdrawal of ISD at baseline.19 Moreover, Bohne, et al. studied the same cohort and identified transcriptional variables and changes in lymphocyte subpopulations associated with successful ISD withdrawal.20 Identifying these variables will allow for determining which recipients will develop rejection. There is little information about predictors of a successful CNI conversion to MMF. Thus, the aim of this study was to identify patient characteristics or laboratory tests associated with successful conversion from CNI to MMF monotherapy in a group of liver transplant recipients.
Material and methods
Patients
Patients were registered at the Clinical Hospital of the Pontificia Universidad Católica de Chile. The immunosuppression scheme employed immediately after LT was CNI plus steroids and MMF and basiliximab following the attendance indication. All recipients were screened in their outpatient clinics for potential inclusion. Inclusion criteria were:
Adult recipients.
Single liver recipients.
Stable liver function (ALT less than three times x ULN during the last year).
CNI monotherapy as ISD scheme.
Absence of steroid use.
Absence of a rejection episode in the last twelve months.
At least twelve months after LT.
Had signed an informed consent form.
Baseline liver biopsy excluding rejection.
Exclusion criteria were:
Age under 18 yrs.
Presence of rejection at baseline liver biopsy.
Non-compliance to medical prescriptions.
Total white cell count ≤ 2 x 10⁹/L.
Hemoglobin ≤ 7.5 g/L.
Platelet count ≤ 70 x 109/L.
Retransplantation.
Pregnancy.
The study protocol was conducted in accordance with the Helsinki Declaration and approved by the Ethics Committee of the University. Clinicaltrials.gov identification: NCT01321112.
Study design
The current study was designed as a prospective cohort study of conversion from CNI monotherapy to MMF monotherapy in stable liver transplant recipients. The primary end point was successful conversion to MMF monotherapy defined as the absence of biopsy proven rejection after a 12 months follow up.
Conversion procedure
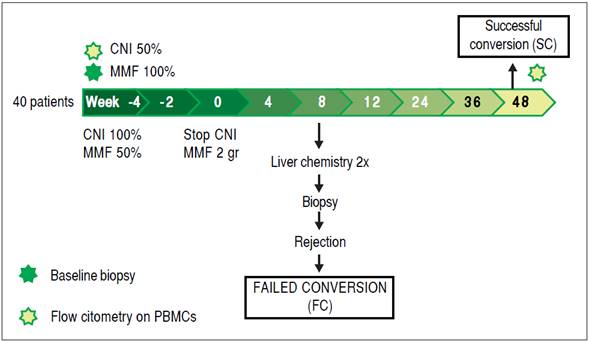
Figure 1 schematically depicts the interventions made with the group of patients under study. During the first four weeks, MMF was introduced in the ISD scheme and its dose was gradually increased, first at 500 mgs bid. Two weeks later the dose was increased again to achieve the target dose (1,000 mgs bid).15 Simultaneously, the CNI dose was maintained for the first two weeks, then reduced by 50% and finally completely withdrawn by week four, so the complete conversion took 4 weeks.
Patient follow-up
Patients were followed up for 12 months. Before the start of the conversion procedure, liver chemistry and a complete blood cell count were determined, and serum levels of glucose, uric acid, creatinine, glomerular filtration rate (IDMS-traceable MDRD-4), sodium, potassium, lipids, hemoglobin A1C (HbA1C) and tacrolimus or cyclosporine C2 were measured. Chronic renal failure was defined as the presence of stage 2 or more as has been established by the National Kidney Foundation.21 The proportion of patients that increased its GFR at the end the study (5 mL/min or more) was evaluated. Patients were evaluated every month during the first 3 months after conversion and then every 3 months until the end of the follow-up. The lipid profile was determined every 3months and HbA1C every 6 months. The remaining tests were repeated every visit, as well determining arterial blood pressure and BMI.
Definition of allograft dysfunction
During follow up, increases of > 2-fold (the upper limit of normal or baseline value if they were not normal) in serum aminotransferases (alanine-aminotransferase [ALT], aspartate-aminotransferase [AST]) or alkaline phosphatase (AP) were considered an indication of acute cellular rejection and a liver biopsy was performed. In cases of < 2-fold increases in ALT, AST or AP, liver chemistry was repeated 2 weeks later. Unexplained persistence of allograft dysfunction was considered an indication for liver biopsy. Isolated elevation of GGT was not considered as an indication for liver biopsy.
Definition of rejection
Allograft dysfunction, in combination with histologic findings suggestive of rejection (mononuclear portal infiltrate, biliary damage by mononuclear infiltrate and endothelitis), were considered diagnostic criteria for acute cellular rejection. Rejection severity was graded according to the Banff criteria.22 Viral infections, autoimmune diseases, drug-induced liver injury, and biliary complications were ruled out when histological evaluation was borderline for rejection diagnosis (BANFF score = 3). All the recipients that developed rejection during the follow up period were classified as failed conversion (FC), those that did not were classified as successful conversion (SC) (Figure 1). All the samples were evaluated by two independent pathologist.
Peripheral blood cell immunophenotyping
Multiparameter flow cytometry was performed on peripheral blood mononuclear cells (PBMC) obtained by ficoll gradient centrifugation in all patients during weeks -4 and 48 of the protocol. Isolated cells were stored in liquid nitrogen until phenotyping. Monoclonal antibodies directed against the following targets were used: CD3, CD4, CD19, CD25, CD56, TCRαβ, TCRγδ (from BD Biosciences; San Jose, CA, USA); Vδ1 TCR (from Thermo- Scientific; Waltham, MA, USA); and Vδ2 TCR (from Immunotech; Marseille, France); and Foxp3 (eBioscience, San Diego, CA, USA). Surface phenotyping was performed by staining 2-5 x 10⁵ cells with specific fluorescence conjugated mAbs for 20 minutes at 4°C after blocking with PBS containing 0.1% BSA and 10% heat inactivated human AB serum. Cells were washed twice with PBS containing 0.1% BSA and fixed with 4% paraformaldehyde or BD fixing solution. Intracellular staining was performed in a similar fashion after permeabilizing cells with BD fix and perm solution. Flow cytometry data was acquired using a BDFacs Canto II flow cytometer (BD Biosciences) and data was analyzed with FlowJo Software (Tree Star, Inc., Ashland, OR, USA).
Statistical analysis
Clinical variables were analyzed using SPSS 20.0 software. Categorical variables were analyzed using the χ2 test and the Student’s t-test was used for continuous variables following a normal distribution. The Mann-Whitney U test was employed for variables without a normal distribution. We employed ROC curves and evaluated different points in order to identify the best cut off values of CNI levels (and categorize it low or high levels) in order to predict a successful conversion Multivariate analyses used binary logistic regressions adjusted employing Hosmer Lemeshow test.
Sample size
To discriminate variables with at least 30% difference between the SC vs. FC groups with a power of 80% and considering a 50% rate of successful conversion, we defined a minimum sample size of 40 liver recipients for one tailed test. P values of < 0.05 were considered significant. For this estimation we employed the program Ene 2.0.
Results
Patient recruitment
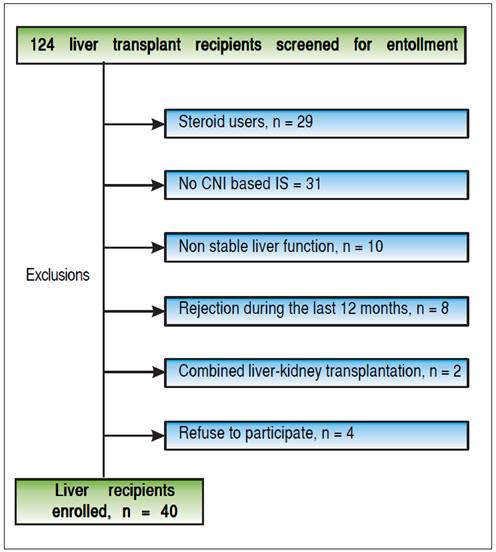
From March 2011 to November 2013, 124 liver recipients were screened for study eligibility. Forty recipients fulfilled the inclusion criteria and accepted to be included in the study (Figure 2). Subclinical rejection was ruled out from the baseline liver biopsy of all recruited recipients. Table 1 shows the baseline characteristics. Mean age was 59.8 ± 10.58 years. Most of the recipients were male (70%) and the time from transplantation to inclusion in the study was 50 ± 49.5 months (median ± IQR). The most common etiologies were alcoholic liver disease (27.5%), NASH (25%), chronic hepatitis C virus infection (17.5%), acute liver failure (7.5%) and others (22.5%). Sixty percent of the recipients were using tacrolimus. Mean creatinine and median MDRD-4 were 1.17 ± 0.27 mg/dL and 60.5 ± 19 mL/min, respectively. As expected, although 13 of the liver recipients included in the study had normal creatinine levels, 69.2% of them had chronic renal failure when GFR was estimated (stage 2 or more).
Forty percent of the recipients had hyperlipidemia, 30% diabetes and 47.5% hypertension. As expected, this was a cohort with high cardiovascular risk.

Conversion outcome
During the follow-up period after conversion, 12 liver recipients (30%) developed rejection and were classified as failed conversion (FC). In this group, the median time to rejection was 8 weeks, quartile 25-75% were 5-11 weeks respectively. The diagnosis of the rejections involved biopsies with all but in one recipient that was receiving anticoagulants at the time. In this case diagnosis was based on liver chemistry, ruling out other causes of allograft dysfunction and steroid response. One recipient required two biopsies to diagnose the rejection (the first was normal and the second showed mild rejection). The median and interquartile range of the Banff score for FC recipients was 4 and 2 respectively, quartiles 25%-75%: 3-5. Most of the rejections were mild, and only one was moderate. Only one rejection episode required steroid bolus treatment. The others were treated with oral steroids and resumption of CNI. There was significant variability in the time required to resolve the rejections (Table 2). However, in most cases complete withdrawal from steroids took fourteen weeks or less. In only one patient the attending physician dediced to slowly taper off steroid use over 32 weeks, even after liver chemistry was normal. Figure 3A shows the percentage of subjects that remained rejection-free during the follow-up period. Interestingly, most of the rejection episodes (91.6%) occurred during the first 3 months after complete conversion, and only one rejection episode was diagnosed 24 weeks after complete conversion. All the rejections were resolved and no grafts were lost. Liver enzyme evolutions were consistent with the response of rejection episodes to steroids (Figures 3B and 3C). There were no adverse effects associated with rejection treatment. On the other hand, 28 liver recipients (70%) completed the follow-up period without rejection and were classified as Successful Conversions (SC). MMF administration was well tolerated. There was only one case of diarrhea that disappeared spontaneously after 3 weeks.
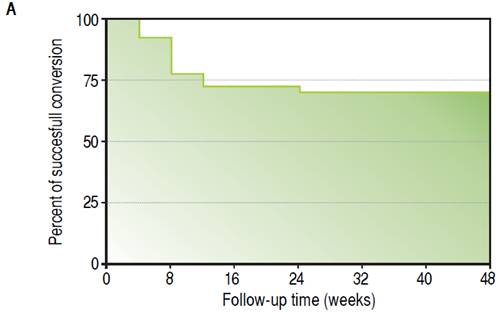
Figure 3A Evolution of clinical parameters in SC and FC groups. Kaplan-Meir curve showing follow-up time free of rejection.
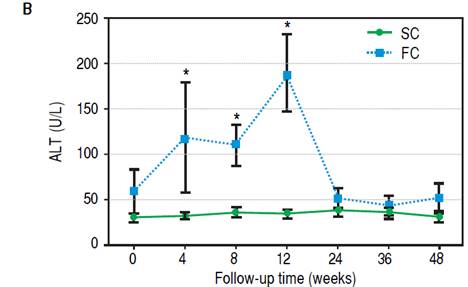
Figure 3B Evolution of ALT levels during follow-up. Differences were calculated between SC and FC groups on each time point. * p = 0.01.
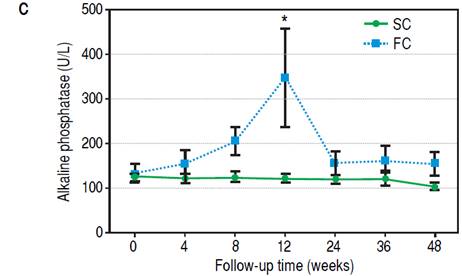
Figure 3C Evolution of AP levels during follow-up. Differences were calculated between SC and FC groups on each time point. * p = 0.01.

Impact of conversion on renal function
There was a significant improvement in renal function among SC liver recipients. There was progressive improvement in GFR from week 12 after conversion until the end of the study (Figure 3D). By the end of the follow- up (48 weeks), the proportion of recipients that improved its GFR (increase of 5 ml/min or more) was 82.14% and 25.0% (p = 0.001) on the SC and FC groups respectively. The patients with improved GFR had a significantly lower baseline GFR (54.5 ± 18.25 vs. 63.5 ± 32.25 [median ± IQR], p = 0.05).

Baseline clinical differences between the SC and FC groups
Table 1 shows the main baseline clinical differences between SC and FC recipients with. Notably, SC recipients had a longer post transplantation period than FC recipients (54.5 ± 47.0 vs. 30.6 ± 35.0 [median ± IQR] months, p = 0.008). Cyclosporine and tacrolimus levels were also lower among SC recipients. We used ROC curve analysis and evaluated different points to identify the best CNI levels cutoff values to predict successful conversion. Thus, we classified CNI levels as low when tacrolimus levels were ≤ 6.5 ng/mL or cyclosporine C2 levels were ≤ 635 ng/mL. At baseline, low CNI levels were significantly more common among SC recipients than FC counterparts (78.6 vs. 25%, p = 0.001). Considering that a longer post transplantation time is frequently related to lower CNI levels, we performed a binary logistic regression only including low CNI levels and time since LT. In this analysis, low CNI levels was related to successful conversión independently to the time elapsed since LT: p = 0.02, OR: 6.93, 95% CI: 1.3-29.7.
Peripheral blood mononuclear cell immunophenotyping
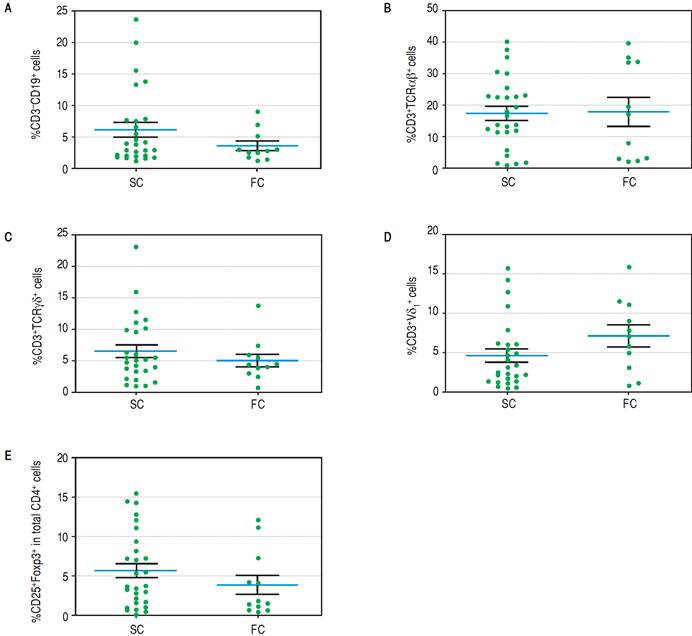
To establish which lymphocytic cell types are related to SC and how they change after the follow-up we determined the frequency of CD3-CD19+B cells, CD3-CD56+ NK cells, TCRαβ and γδ CD3+ T cells, CD3+Vδ1+ and Vδ2+ γδ T cell subpopulations and CD4+CD25+Foxp3+ Treg cells. At baseline we found no differences between SC and FC recipients in the frequency of B, TCRαβ and γδ T cells (Supplementary figures). SC group recipients showed a higher frequency of NK cells and a lower frequency of Vδ2 TCR γδ cells (Figure 4A, 4B respectively) than FC recipients. Although CD4+CD25+Foxp3+ Treg cells showed a non-significant decrease at baseline among FC recipients (Supplementary figures), remarkably, mean fluorescent intensity (MFI) for FoxP3 in CD4+CD25+ T cells was higher among SC recipients (Figure 4C), suggesting a role of regulatory cells in the development of successful conversion. Interestingly, FoxP3 MFI was significantly higher at baseline among recipients with low CNI levels (Figure 4D), which was a condition highly related to successful conversion. To evaluate changes in the levels of lymphocytic populations from baseline to the end of the follow-up, we calculated delta between baseline and the end of follow up (48 weeks) among the analyzed populations. At the end of follow up, there were no differences on NK cells frequency and Vδ2 TCR γδ (Supplementary figures). While at baseline Vδ1 TCRγδ cell frequency was similar in the SC and FC groups, a slight reduction was observed in the FC group at the end of follow up (Figure 5A). In addition, Foxp3 MFI in CD4+CD25+ T cells was slightly lower in the SC group than the FC group (Figure 5B).
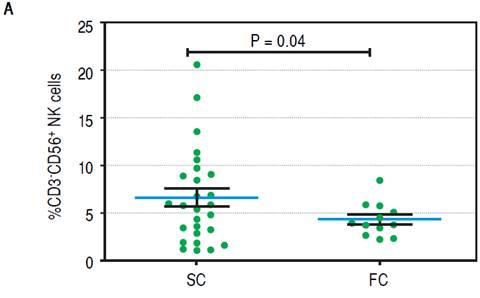
Figure 4A Baseline of lymphocytic populations determined by flow cytometry studies of the SC and FC groups. A Frequency of natural killer cells.


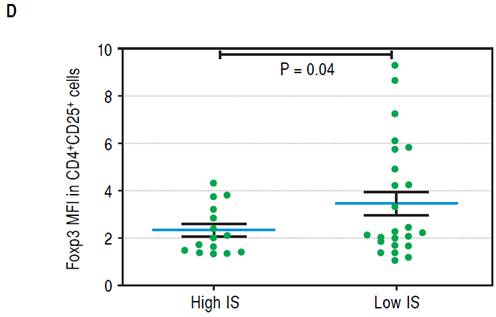
Figure 4D Mean FoxP3 fluorescent intensity in CD4+CD25+ T cells of recipientsnwith low and high CNI levels.
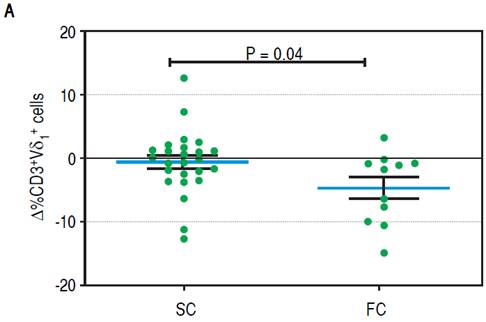
Figure 5A Changes between baseline and end of the follow up in lymphocytic populations of the SC and FC groups. A. Change in the frequency of CD3+Vδ1 cells.

Discussion
Calcineurin inhibitor minimization or conversion to MMF has been proposed as an alternative to preserve renal function and decrease cardiovascular risk by employing a drug with a safe side-effect profile.18,23 At this point, there are no available data to identify predictors of successful conversion to MMF to discriminate recipients with a higher probability of rejection.
The present study suggests that CNI conversion to MMF monotherapy is safe and clinically feasible. The rate of rejection was significant (30%) but due to close patient monitoring all rejection episodes were resolved by the end of the follow-up. In addition, we report no significant consequences for the graft or the recipient. This finding is consistent with the recently published experience of Benítez, et al.19 They conducted an immunosuppression withdrawal trial with 102 liver recipients, 57 of which developed late rejection during the withdrawal. Most of these episodes were mild and all the rejections were resolved. These findings suggest that proper monitoring minimizes the risk of late acute cellular rejection. In our study, there was clear benefit in renal function for the SC group. The variables associated with improved renal function were lower baseline GFR and C2 cyclosporine levels. The latter finding could be related to the fact that CNI exposure is highly related to renal arteriolar hyalinization,24 and suggest that a higher and prolonged exposure to CNI increases the risk of structural changes that do not reverse after CNI withdrawal.
Considering that CMM preserves GFR, this strategy seems reasonable, at least with patients with the highest probability of success. At this respect, we found that the only clinical variable independently related to successful conversion was a low CNI level at baseline (defined as tacrolimus levels ≤ 6.5 ng/mL or cyclosporine C2 levels ≤ 635 ng/mL).
This finding is consistent with the fact that MMF, at the administered doses of two grams per day, adequately suppresses alloresponse at a similar level to that of the previous immunosuppressive scheme to avoid rejection. Thus, the ICN levels considered as “low” have similar or less effect on immune response than a dose of 2 grams of MMF. For some patients with low CNI levels, conversión to MMF monotherapy at the doses employed in this study imply higher immunosuppressive potency. This is probably the case for recipients with successful conversión and low baseline tacrolimus or cyclosporine levels. Identifying a clear threshold based on ISD levels could guide the clinical practice of transplant physicians, optimizing the selection of liver recipients with higher probability of successful CMM and all the benefits this implies.
We also found an association between successful conversión and some lymphocyte subpopulations. Expression of the lineage-specific transcription factor FoxP3 CD4+CD25T cells was higher in recipients with successful conversion, suggesting a role for immune regulatory processes in this phenomenon. However, it is also true that CNI has negative effects on Treg proliferation and function, which several studies have confirmed, including a recent systematic review.25 In fact, at baseline, FoxP3 MFI was higher in the CD4+CD25 T cells of recipients with less exposure to CNI (Figure 4), expressed by low CNI levels at baseline. This suggests that higher FOXP3 MFI in T cells in the SC group is at least partially explained by less CNI exposure at baseline, however, a confounding effect of the time elapsed since LT over CNI exposure cannot be excluded. Interestingly, there was a slight reduction of FOXP3 MFI at the end of follow-up, which could be explained by the deleterious effect that MMF appears to have on Tregs (Figure 5B).26-29 This effect appears to be dose dependent,27 and is not observed with low MMF doses. In the study of Demirkiran, et al., liver recipients swichted to MMF monotherapy were compared to recipients on CNI-based immunosuppression. The authors showed a relative increase (compared to the baseline) of CD4+CD25+FOXP3+ T cells after conversión to MMF monotherapy. All recipients received a single dose of daclizumab, which binds to CD25, the alpha subunit of the IL-2 receptor of T cells30 that has been found to have significant negative effects on Treg frequency in most studies.31-34 Therefore, a marked reduction in CD4+CD25+FOXP3+ T cell frequency after administering daclizumab, and its recovery in the following months are expected.
The SC group also had a higher number of NK cells. NK cells have traditionally been associated with pro-inflammatory immunity, resulting in allograft injury. More recently the regulatory function of NK cells has been identified.35,36 One of the mechanisms is the release of anti-inflammatory cytokines such as TGF-β and IL-10,37,38 but also, and very interestingly, several studies have indicated that cytotoxic activity against activated T cells is an important regulatory mechanism employed by NK cells.39 The effect of immunosuppressive drugs (specifically ICNs) on NK cells has not been totally elucidated. Several studies indicate a negative effect on NK cell proliferation, while others do not.40,41 In our study, NK cell frequency was not related to ICN serum levels (data not shown). Thus, although it is not posible to rule out an effect of ICN on NK cell frequency, it is plausible that higher NK cell frequency has a causal effect on the outcome of conversion.
Although γδTCR+ cell frequency did not differ between the two groups, Vδ2TCR+ cell frequency was significantly higher in the FC group. Like NK cells, γδTCR+ cells are part of the innate immune system and Vδ2TCR+ cells are the most common γδ subpopulation in peripheral blood, displaying effector functions against infectious stimulus and acting as antigen presenting cells.42 There is no information about the effect of immunosuppressive drugs on δ2TCR+ cell biology or the successful conversión to MMF monotherapy. The lower frequency of δ2TCR+ cells at baseline in the SC group deserves further investigation as it could be related to lower alloimmune response against the graft.
We registered a slight reduction in the frequency of Vδ1TCR+ in the FC group at the end of the follow-up. The cause of this change is not clear and we speculate that it could be a consequence of the ISD employed to treat rejection among FC group recipients.
This is the first study to identify clinical variables related to successful conversion to MMF. All previous conversion studies have sought to demonstrate the feasibility and benefits of CNI minimization/withdrawal and not to identify the subset of liver recipients with the highest chance of successful conversion. This could be an interesting advance in evaluating the potential benefits of conversion to MMF monotherapy. Interestingly, some of the variables associated with successful conversión are also related to the development of operational tolerance, such as the time since transplantation, lower exposure to CNI, higher frequency of NK cells, lower frequency of δ2TCR+ cells and higher expression of FoxP3.19,20,43 This raises the question of whether the SC group has a higher chance of developing operational tolerance in the future.
The fact that we recruited only 40 of 124 recipients in our cohort suggests that this strategy is suitable for a minority of recipients. The authors excluded 29 steroiddependent recipients in order to administer immunosuppression of similar intensity to all recipients. However, in real life steroid dependency does not preclude CNI minimization/ withdrawal. Thirty-one recipients were on a non-CNI-based immunosuppressive regime. Twenty-five of them were already receiving MMF, with minimization or complete withdrawal of CNI. Considering these recipients, in relation to those that were recruited, it can be said that this strategy could be employed with at least 75.8% of the total cohort.
The small size of this study limits us to suggesting that low CNI levels can predict successful conversion. Further studies are needed to demonstrate the usefulness of this indicator and to establish the best cutoff for defining low CNI levels. However, our findings can guide future studies to determine predictors of successful conversion.
In conclusion, conversion to MMF monotherapy in liver recipients with a steroid free immunosuppressive scheme based on CNIs, compliant and in the absence of recently diagnosed rejection, seems to be plausible and safe. A significant benefit can be obtained in terms of preserving renal function, especially with patients with lower GFR or CNI levels. The most important finding in this study is probably the identification of a CNI level threshold to select liver recipients with a higher probability of successful CMM. A higher FoxP3 MFI, an increased frequency of NK cells and a lower number δ2TCR+ cells at baseline were also associated with successful conversion. These findings could allow an improved selection of candidates for MMF monotherapy conversion.