


 nueva página del texto (beta)
 Inglés (pdf)
 Artículo en XML
 Referencias del artículo
 Enviar artículo por email
 Citado por SciELO
  Similares en
SciELO
Similares en
SciELO 
 Permalink
1. Introduction
The conceptual development of number and its basic operations (addition and multiplication) has constituted an essential part of research on cognitive development (Carpenter, Fennema, Franke, Levi & Empson, 2015; Empson & Levi, 2011; Empson, Levi, & Carpenter, 2011; Piaget, 1952; Lamon, 2005; Lortie-Forgues, Tian, & Siegler, 2015; Piaget, 1952; Piaget & Inhelder,1958; Siegler, et al., 2010; Siegler & Lortie-Forgues, 2015; Torbeyns, Schneider, Xin, & Siegler, 2015; Vygotsky, 1986). Scholastic education is one of the principal sources of the children’s scientific and mathematical concepts and is also a powerful force in directing their development (Vygotsky, 1986). The main educational goal in elementary mathematics is that children develop mathematical descriptions and explanations and use mathematical tools to solve academic and real problems (Organisation for Economic Cooperation and Development (OECD), 2016). It has been proposed that elementary school children’s development of fraction knowledge (including decimals, percentages, ratios, rates, and proportions) seems to be especially important for overall mathematics achievement and later academic success. Moreover, children’s understanding of decimals simultaneously draws on their understanding of fractions. In addition to their importance for educational and occupational success, fractions are crucial for theories of numerical development (Siegler and Lortie-Forgues, 2015; Torbeyns, et al., 2015).
However, elementary school teachers and students tend to understand arithmetic as a collection of procedures, and students often are taught computational procedures with fractions without an adequate explanation of how or why the procedures work (Siegler, et al., 2010; Empson, et al., 2011). Although elementary school teaching focuses on both conceptual understanding and procedural fluency teachers should emphasise the connections between them (Siegler, et al., 2010). Academic tasks at elementary school create the necessary demands and conditions to conceptualise the number and its basic operations.
According to Vygotsky (1986), systematic learning plays a leading role in the conceptual development of elementary school children. Vygotsky upholds that the development of spontaneous concepts knows no systematisation and goes from the particular event, object or situation upward toward generalisations. In an opposite way, the development of mathematical and scientific concepts is the consequence of a systematic cooperation between the children and the teacher. The mathematical and scientific concepts, therefore, stand in a different relation to the events, objects or situations. This relation is only achievable in conceptual terms, which, in its turn, is possible only through a system of concepts. Vygotsky (1986) emphasises that the acquisition of academic concepts is carried out with the mediation provided by already acquired concepts. In general, Gergen (2009) contends that the meaning of a word is not contained within itself but derives from a process of coordinating words and that language (and other actions), in essence, gain their intelligibility in their social use.
In addition, Piaget (1952; Piaget & Inhelder, 1958) suggests that in formal thought there is a reversal of the direction of thinking of reality and possibility, and it is the reality that is now secondary to the possibility. Children conceive, for the first time, that the given facts form part of a set of possible transformations that has actually come about from a system of relationships. According to Piaget (1952), every totality is a system of relationships just as every relationship is a segment of totality. The possibilities entertained in formal thought are by no means arbitrary or equivalent to imagination freed of all control and objectivity. Quite to the contrary, the advent of possibilities must be viewed from the dual perspective of logic and physics; this is the indispensable condition for the attainment of a general form of equilibrium. Children recognise relations, which in the first instance they assume as real, in the totality of those which they recognise as possible.
The number and its basic operations can be conceptualised within a system of relations. At the beginning, certain aspects of objects are abstracted and generalised into the concept of number and the mathematical basic operations (addition and multiplication). However, mathematical concepts represent generalisations and schematic representations of certain aspects of numbers, not objects, and thus signify a new level of cognitive processes (Zapatera Llinares, 2017). This new processing level transforms the meaning of the first conceptualisations of number and its basic operations. This produces the construction of one general system of numbers.
Generalisations can be developed using different approaches. Children in the first courses of elementary school can develop concepts about fraction numbers through counting or measuring activities. Simona, Placab, Avitzurc, & Karad (2018) show how students can develop a measurement concept of fractions. Their proposal is consistent with the E-D approach developed by Davydov & Tsvetkovich and the Japanese text series, Tokyo Shoseki, developed by Fujii & Iitaka. From the perspective of the E-D curriculum, measurement is not just a basis for fraction numbers, but for numbers in general from the first elementary grades. The proposal is based on the idea that number should be developed as a general concept, and that any number, whole or fraction, does not require a change in the general basic concept.
In contrast to the counting and measuring cognitive activities, we focus on children’s understanding of fractions based on relational schemes. Our activities promote children’s generalisation of multiplication and division computational procedures to include whole and fraction numbers in general schemes. The images children construct might imply measuring cognitive activities, but measuring does not play a central role in our learning sessions. The core of our programme is the concept of number as a relational scheme.
Our proposal is based on the construction of generalised conceptualisation of, at least, rational numbers and the development of generalised procedures to perform rational numbers mathematical operations.
1.1. Cognitive schemes of fractions and their basic operations
As a general rule, instruction in fraction numbers, i.e. a number that can be represented by an ordered pair of whole numbers a ⁄b (Musser, Burger, & Peterson, 2008), and their basic operations begins with addition and subtraction of fractions with common denominators, proceeds to instruction in those operations with unequal denominators and to fraction multiplication, and then moves to fraction division. We propose that the best approach to present this subject is to begin with fraction multiplication and fraction division. That is because children need to know how to multiply and/or divide fractions in order to obtain equivalent fractions with the aim of adding, subtracting or comparing fractions with unequal denominators. Consequently, in this paper, we constrain our research to multiplication of rational numbers and its related operation, division. The focus of our inquiry is on children’s schemes that define multiplication as a mathematical process whereby a rational number multiplied by another rational number results in a third rational number.
1.2. Cognitive construction of rational numbers
Elementary school children do not discriminate between the set of natural numbers and the set of rational numbers. Numbers, in general, are signs or symbols representing an amount or total and they can be conceptually understood in relation to other numbers. Every natural number is specifically represented by a unique symbol (Siegler & Lortie-Forgues, 2015). However, in general, any number can be represented in a great variety of mathematical relationships. Vygotsky (1986) asserts that through the study of arithmetic, children learn that any number can be expressed in countless ways because the concept of any number contains also all of its relations to all other numbers. For example, a whole number can be represented as a fraction and hence has an infinite number of fraction equivalences (Musser, Burger & Peterson, 2008). The number one, for instance, can be expressed as the difference between any two consecutive numbers, or as any number divided by itself, or in a myriad of other ways. According to this relational perspective, every number can be represented by infinite expressions. The number 5 can be defined or represented as:
In view of this, we conclude that children’s cognitive structures conceptualising numbers constitute relational schemes. A relational scheme can be defined as any scheme whose essential characteristic or feature is a relationship between at least two concepts, objects or situations (Díaz-Cárdenas, Sankey-García, Díaz-Furlong, & Díaz-Furlong, 2014). In Vygotskian words, we cannot study concepts as isolated entities but we must study the “fabric” made of concepts. We must discover the connections between concepts based on the principle of the relation of generality, not based on either associative or structural relationship.
Teacher instruction relying on the typical mathematical tasks of elementary school create the conditions that engender children’s need to construct a system of numbers within which they can add, subtract, multiply and divide. Scholastic tasks like calculating the number which added to five equals three, or calculating the number which multiplied by five equals thirty one, constitute the basis for expanding the number system, restricted at first, to the positive integers to include the negative and rational numbers. Natural numbers are not closed under subtraction and they are not closed under division either. Therefore children need to expand the numbers system to include zero, negative numbers and fractions. At least, they need to understand and conceptualise the rational numbers (ℚ, from quotient). Within ℚ they can subtract and divide any number (except divide by zero). This number system includes a variety of relations in terms of comparisons and equivalences of spatial or temporal magnitudes and quantities (length, surfaces, volumes, units of weight or time) or abstract numbers.
In this paper we present data about a very important issue related to opposing approaches to the introduction of fraction multiplication and division. One research perspective that contends that fractions and decimals need to be treated differently from whole numbers, and a second approach, which we adopt, that is based on the construction of general relational schemes for any mathematical basic operation that combines two real numbers to form a single real number. In this study, we examine whether elementary school children can construct a system of numbers such that fraction multiplication and division are based on the construction of general relational schemes. We also want to test the hypothesis that children achieve an improvement on correct response probability, especially those students with a higher average mark.
1.3. Fraction multiplication
Research on the direction of effects of fraction arithmetic operations suggests that learner’ incorrect predictions about products and quotients result from the belief that multiplication yields answer greater than both factors, and that dividing yields answer smaller than the dividend (Siegler, et al., 2015; Graeber, Tirosh & Glover, 1989). This question depends on the particular case and it can be answered if the student understands the multiplication scheme or the division scheme in itself. Basically, students must develop a sound understanding of fraction operations so as to analyse and modify their misconceptions about multiplication and division (Greer, 1988). Therefore we need to help children to develop a reconceptualization of number that includes the fractional basic operations. In developing general cognitive schemes it is not a relevant issue if a product or quotient is greater o smaller than any of the factors or the division elements. Fraction multiplication and division must be developed as cases of general relational schemes and, basically, as a conceptual generalisation of these operations with natural numbers. Elementary school children can construct a system of numbers such that multiplication and division, products and quotients, are defined by every number comprised in the system.
Multiplication can be expressed by the words “multiplied by” or “times” (the corresponding Spanish words are “por” and “veces” respectively). An algebraic expression of a product c is a × b = c. This can be read as a times b or b times a equals c. Likewise, it can be transcribed as the product c results from taking a times the number b or taking b times the number a. In a similar way children can say that a product results from adding a number to itself a particular number of times.
To prevent students’ belief that multiplication should always yield answers larger than either factor we introduce gradually fraction multiplication exercises that result in products that can be at the same time greater than one of the factors and smaller than the other factor. Cognitive systems, according to Piaget (1975), never reach a final equilibrium point but they are evolving in a continuous process of progressive equilibration. Cognitive schemes are constantly modified by school exercises so they become able to give a comprehensive account of number multiplication and division. Elementary school children commonly learn to calculate a product that can be the result of taking:
a) a whole number of times a whole number
b) a whole number of times a non-whole number or fraction number
c) a non-whole number or fraction number of times a whole number
d) a non-whole number or fraction number of times a non-whole number or fraction number.
Children learn multiplication and its properties multiplying whole numbers, the
first multiplication case (a). Children’s understanding of fractions based on
relational schemes can be introduced by (b) or (c) multiplications. They can
conceptualise multiplication by fraction numbers as taking a whole number times
a fraction number (b) or taking a fraction times a whole number (c). If we use
the same numbers in both cases children have a fractional multiplication example
of the Commutative Property for Number Multiplication
Problem solving in mathematics requires an understanding of the relations involved in a problem and developing a corresponding translation into a mathematical relation (Vygotsky, 1986). Children can be helped to quickly recognise patterns of information and to organise data in schemes and they will be able to develop relational schemes that generalise these math relations. Products and quotients can be defined in terms of relational schemes (Díaz-Cárdenas, et al., 2014). A general multiplication scheme must include any rational number (decimal or fraction). According to Empson and Levy (2011) children must think of a fraction as a number.
Product defined in relational terms
| factor | product xy is | factor |
|---|---|---|
| y | y times x | x |
| y | x times y | x |
| y | the y-ple of x | x |
| y | the x-ple of y | x |
In conceptualising different objects in a name or a category it is necessary to select a set of common properties or qualities and determine those that contrast them with other elements belonging to other categories (Díaz-Cárdenas, et al., 2014; Rogers & McClelland, 2004). Children understand that all four multiplications above-mentioned represent a mathematical operation that results from taking one number a number of times. One contrasting feature is the procedural knowledge that produces the resulting factor of:
1.4. Fraction division
Children learn that there is a number that multiplied by 3 equals 9, and there is a number that multiplied by 3 equals 10. But if there is a Closure Property for Fraction Multiplication there must be a number that multiplied by 3 equals 10 and another number that multiplied by 3 equals 11 (see the section learning procedure). Here we can introduce the division of fractions. On the subject of division students also need to avoid some common misconceptions, and a significant number of children and their teachers believe that the quotient must be a whole number (Graeber, et al., 1989). They hardly represent the remainder as a fraction part of the quotient. On the other hand, incorrect responses to the direction of effects on division tasks are by-products of a misconstruction of products and quotients. Therefore, we begin by considering division as a mathematical process that results in dividing a rational number by another rational number that produces a third rational number named quotient and we basically apply the missing-factor approach (Musser, et al., 2008). This means that division consists of three mathematically related numbers: a dividend, a divisor, and a third number called the quotient or missing factor. The children´s task is to find the number that multiplied by the divisor equals the dividend and they can define division for every two numbers within only one general scheme for all rational numbers.
1.5. School Assessment Analysis
The second, but no less important objective of this study, is based on elementary school teachers’ need for reliable assessment methods to examine developmental and individual differences in cognitive representations of fractions and in the effects of interventions aiming at improving conceptual knowledge of fractions.
The second, but no less important objective of this study, is based on elementary school teachers’ need for reliable assessment methods to examine developmental and individual differences in cognitive representations of fractions and in the effects of interventions aiming at improving conceptual knowledge of fractions.
Assessment as part of the learning process is very effective when it is designed to reflect the understanding of how students learn. It is important to know how students progress in learning academic procedures and content. Assessment is an essential ingredient both in research and education processes.
A valid assessment system implies a model of student cognition and learning in a specific topic, a set of beliefs about the kinds of data that will provide evidence of students’ cognitive processes in learning, and an analysis and information processing for making sense of the evidence (National Academies of Sciences, Engineering, and Medicine, 2018). Assessment design and analysis are becoming as essential as other elements of teaching in Mexico. Teachers must include in their didactic planning detailed rubrics. These must contain evaluation parameters and procedures for performance analysis.
In elementary school, children’s learning depends on different individual factors. Groups of students are not homogeneous and children progress at different rates. Therefore, when teachers base their analysis on group average achievement, they cannot see how students are differentially progressing.
The logistic function depicts the probability of success on an item as a function of a students’ specified parameter, i.e. it is possible to analyse learning progress in relation to any variable that can be evaluated with non-categorical scales. With this tool, teachers or researchers can perform basic item analysis in relation to an ability parameter based on academic grades, psychological test scores, or performance on a cognitive scale. To attempt a first approximation analysis, we selected average marks as the parameter that can be related to the probability of right answer to an item. We decided to study children´s average mark or grade as the ability parameter. Average mark is basically a socially defined index that represents academic performance, and this index is only one element of the universal set of social indexes designed to assess and analyse learning processes.
2. Method
2.1. Participants
Fifth graders attending two elementary middle-income schools in Puebla city, México, participated in this study (N = 104). There were two fifth-grade groups studying in each school. One school pertains to the public school system and the other one is a private school. Only students with parental consent were included in the study. According to the official requirements of the Secretaría de Educación Pública (the Secretary of Education), fifth-grade children participating in this program had their tenth birthday during the year of the study. Tests and learning sessions were developed in the children´s schools. One group played a part as a control group and the other participated as the fraction multiplication and division learning group in each school. As the group A would be the learning group in the private school we decide to take the group B as the learning group in the public school. Therefore, we have two control groups and two learning groups (see Table I).
Table I Distribution by sex, academic group, and school system in control and learning groups
| Treatment | School | Sex | Group | Total | |
|---|---|---|---|---|---|
| A | B | ||||
| Learning group | Public | Female Male |
20 20 |
20 20 |
|
| Private | Female Male |
10 9 |
10 9 |
||
| Subtotal | Female Male |
10 9 |
20 20 |
30 29 |
|
| Total | 19 | 40 | 59 | ||
| Control | Public | Female Male |
12 13 |
12 13 |
|
| Private | female male |
11 9 |
11 9 |
||
| Subtotal | female male |
12 13 |
11 9 |
23 22 |
|
| Total | 25 | 20 | 45 | ||
| Female total | 53 | ||||
| Male total | 51 | ||||
| Participant total | 104 | ||||
2.2. Learning procedure and methods of microgenetic analysis
The learning instruction period was necessarily brief because of our commitment to working the same learning sessions with the control group before the academic year finished. During the learning sessions, we asked children to write a verbal expression that makes visible a conceptual understanding of the fraction multiplication, as well as the standard mathematical expression and, when possible, to draw a picture or diagram representing the multiplication. When children calculate products that involve greater numbers they do not need to make a drawing (see Figure 1 as an example of tasks solved in school).
Sessions with the fractions multiplication/division learning groups were delivered in a whole-class arrangement in half-hour periods two times per week for three and a half weeks. The first author had charge of the learning sessions and the school teachers did not intervene in the teaching of multiplication or division of fraction. Control groups did not receive any special intervention. To prevent parents or teachers intervention in the multiplication and division learning process we did not assign any homework.
Some researchers have suggested that children make of errors that reflect inappropriate generalization from the corresponding whole number arithmetic procedures (Siegler & Lortie-Forgues, 2015; Lortie-Forgues, Tian, & Siegler, 2015, Siegler, Thompson, & Schneider, 2011). According to them an important factor that contributes to the difficulty that children commonly encounter with fraction arithmetic is the opposite direction of effects of multiplying and dividing positive fractions below and above one. Siegler & Lortie-Forgues affirm that understanding the direction of effects of multiplying and dividing proper fractions poses special problems for learners. Multiplying natural numbers always results in an answer greater than either multiplicand but multiplying two proper fractions invariably results in answers less than either multiplicand. Similarly, dividing by a natural number never results in an answer greater than the number being divided, but dividing by a proper fraction or decimal always does. Both an important number of students and some teachers show poor understanding of the directional effects of fraction and decimal multiplication and division (Siegler & Lortie-Forgues, 2015). These researchers recommend that understanding fractions requires recognizing that many properties of natural numbers are not properties of numbers in general. An instructional implication is that teachers and textbooks should emphasize that multiplication and division produce different outcomes, depending on whether the numbers involved are greater than or less than 1, and should discuss why this is true (Lortie-Forgues, Tian, & Siegler, 2015, Siegler, Thompson, & Schneider, 2011). For this reason, we designed school activities that give rise to the construction of a system of numbers such that fraction multiplication and division are based on the development of general relational schemes.
In addition, by definition a fraction multiplication can be expressed as:
Microgenetic methods offer a promising way to meet the challenges inherent in trying to understand change processes (Chen & Siegler, 2000, p.12). The brevity of the analyzed period allows us to assume that the observed effects will be largely a result of the interventions carried out, since the other social factors remain, on the whole, without significant changes. Obtaining a precise understanding of cognitive change requires observing such changes while they are occurring and to define the path of change, i.e. the sequence of knowledge states that the child passes through while gaining competence, constitutes a dimension that had proved useful in microgenetic studies (Fazio & Siegler, 2013). Our hypothesis is that children can go through the following path in learning fraction multiplication:
a) multiplication of a whole number by a fraction (how much is seven times one fifth? ¿cuánto es siete veces un quinto?).
b) multiplication of fractions whose numerators are 1, i.e. unitary fractions, by a whole number (how much is one fifth times twenty? ¿cuánto es una quinta vez veinte?).
c) multiplication of a nonunitary fraction by a whole number (how much is three fifths times twenty? ¿cuánto es tres quintas veces veinte?). In this case children can initially use the strategy of calculating first the product of a unitary fraction by the whole number (how much is one fifth times twenty? Four ¿cuánto es una quinta vez veinte? cuatro) and, finally multiplying this product by the remaining whole numerator (three times four equals twelve; tres veces cuatro es igual a doce).
d) multiplication of fractions whose numerators are 1, i.e. unitary fractions (how much is one half times one fifth? ¿cuánto es media vez un quinto?).
e) multiplication of a unitary fraction by a nonunitary fraction (how much is one half times ten fifths? ¿cuánto es media vez diez quintos?).
f) multiplication of nonunitary fractions (how much is seven thirds times six fifths? ¿cuánto es siete tercias veces seis quintos?). Similarly, as mentioned above, children can initially use the strategy of calculating first the product of a unitary fraction by the other nonunitary fraction and finally multiplying this product by the remaining whole numerator (how much is one third times six fifths? two fifths, and seven times two fifths equals fourteen fifths; Un tercio de vez seis quintos son dos quintos, y siete veces dos quintos es igual a catorce quintos).
The comprehension activities that we applied to the different types of fraction multiplication were:
- Understanding and solving fraction multiplication word problems
- Drawing a picture or diagram representing fraction multiplication
Understanding and solving fraction multiplication problems represented numerically
Consequently, we began to work with exercises like the following products (we use in the learning sessions examples not included in the evaluation tests):
Once these are read, respectively, as two times one-third equals, two times one-fifth equals, two times one-seventh equals, most children correctly answer that the respective products are two-thirds, two-fifths, and two-sevenths. Incidentally, in session discussions, children agree, at least some of them that two-thirds are greater than one-third and smaller than two wholes, i.e. they acknowledge that the product is at the same time greater than one factor and smaller than the other factor. We then calculate products that involve greater whole numbers. For example:
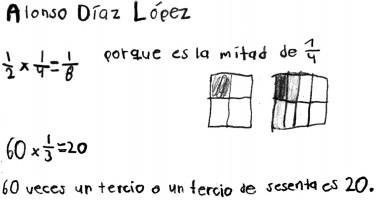
This kind of exercise let the children generalise the multiplication relational scheme applied before to greater whole numbers and to apply the associated commutative law for multiplication (a × b = b × a). These activities help students to recognize that n times a fraction equals n times the fraction. Therefore sixty times one third equals sixty thirds. But this is equivalent to saying one third times sixty or one third of sixty. Most fifth-grade children correctly answer that one third of sixty equals twenty. Therefore, students understand and arrive at the conclusion that sixty thirds equals twenty (see Fig. 1).
We worked immediately after on the multiplication of two fractions. Yet again, we used the word times (veces) to help children to apply the same product relational scheme when multiplying fractions. Children conceptualise multiplication by one half as a product that results from taking a half times of a fraction. In general, multiplying by one half represents dividing in two halves a fraction and taking away one half of the original fraction (see Fig. 1). The result produces fractions with a denominator equal to two times the original denominator. Therefore, one half times one third equals one sixth, and similarly, one half times one sixth equals one twelfth.
We finish working with the children in multiplication with fractions with a
numerator greater than one. We tried to use simple justifications to build
schematic relationships. Let´s examine two multiplication cases,
As a final point, we briefly introduce fraction division basically applying the missing-factor approach in which the children’s task is to find the number that, multiplied by the divisor, equals the dividend (Musser, et al., 2008). Succinctly children calculate how many times the divisor is contained in the dividend. In the first instance, fraction division problems were designed with the aim of defining multiplication for any integer number and extending the system of numbers. Consequently, children conceptualise division within only one general scheme for all rational numbers. To understand the need of rational numbers children calculated the numbers that multiplied by three equals nine or twelve, which are two and three respectively. But which numbers multiplied by three equals ten and eleven? Children must use rational numbers to answer this question and the resulting sequence would be like this:
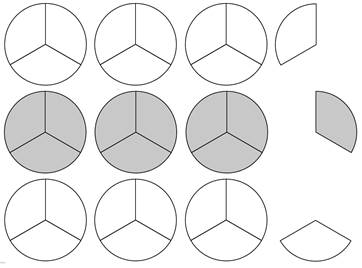
Children also can draw a picture or diagram representing every multiplication. For example, three times ten thirds equals ten can be represented as:
Therefore, the product sequence (9, 10, 11, 12) is completed if we introduce the
numbers (
2.3. Pre- and post- assessments
The only way to find out how children learn is to study them closely while they
are learning (Chen & Siegler, 2000).
If we examine thinking before and after changes occur, we can identify those
children that move between different levels or stages from those who do not move
to an advanced one. Participants solved 5 items on a multiplication fraction
problem; three of them were verbally represented (eg, how much is
one-third of 18? ¿Cuánto es un tercio de 18?)
while the rest were presented in a standard mathematical form (eg, what
is
2.4. Data analysis
The logistic function describes the relationship between the probability of correctly answering an item and the corresponding examinee’s specified ability. The item response curve depicts the probability of success on an item as a function of a person’s specified parameter ability. We employ here the two-parameter logistic model based on the following function:
where θ is an ability parameter, a stands for
the item difficulty (the required ability level for an individual to have a
probability of
From the perspective of item response theory students who obtained the correct answer are of higher average ability than students who obtained the incorrect answers. However, an item response curve also could be interpreted as showing that students of higher average ability have a better chance of being successful on an item than students of lower average ability. We assumed that item difficulty is not fixed but it changes as learning develops. Abilities are not fixed, and successful item response probability, at least for academic assessments, varies as a function of cognitive development and learning.
There are two extreme cases for which the IRT ability estimation procedure fails. First, when children do not answer correctly any of the items, and second when students answer the test items without any mistakes. In both cases, it is impossible to obtain an ability estimate for the examinee (Baker, 2001). The item response curve is either very low or very high and essentially flat. If there are no answer differences between students calculation of an ability parameter is not possible. Therefore the item contributes very little to our knowledge about children’s ability, as it does not differentiate between students with lower versus higher ability (Fan & Sun, 2013). It is not uncommon to find those situations at elementary school, either at the beginning of a learning process or at the final stage of this process.
In the case of learning fractions, children show a tendency to answer incorrectly most numerically represented items of a diagnostic test before instruction of this topic begins. As the course progresses, children’s responses to fraction mathematics diverge. We analise here an ability parameter that teachers could bring into play that is related to fraction knowledge progress: children´s average mark or grade. In this way, children’s item responses along with children´s average mark, as an ability parameter, are the basis for analysing the development of those responses with a logistic function. An item response curve is a useful aid to visualise, item by item, children’s progress as a function of their average mark and teachers can compare, per item, correct answer probabilities P(θ), odds ratio (P(θ)/1-P(θ)), and logit by average mark level (Díaz-Furlong, Díaz-Furlong, & Díaz-Cárdenas, 2017; Pardo & Ruiz, 2012).
3. Results
Commonly teachers use overall group test scores to analyse academic improvements. The simplest way to do this is to apply a Student’s two-tailed paired t-test (Pardo, Ruiz, & San Martín, 2009). Table II presents the results of a dependent samples t-test to compare general pre-test/post-test scores of learning groups (teachers do not usually compare their results with control groups) on multiplication items (word and numerical forms), division items (word and numerical forms), and total fraction items (word, numerical, and final total). There are statistically significant differences between any general scores, except for word multiplication items. Fifth-grade children can solve correctly word problems that involve fraction multiplication calculations, although they do not perform any multiplication. They calculate one-third of 18 calculating the third part of 18. On the other hand, they are not able, in general, to make any operation to calculate a quotient for a fractional division problem at the time of the pre-test.
Table II Mean differences, standard deviations, standard error differences, and Student’s two-
| Paired Differences | t | df |
Sig. (two- tailed) |
|||||
|---|---|---|---|---|---|---|---|---|
|
Mean Difference |
Std. Deviation |
Std.
Error Difference |
95%
Confidence Interval of the Difference |
|||||
| Lower | Upper | |||||||
|
word multiplication items |
-0.127 | 1.402 | 0.189 | -0.506 | 0.252 | -0.673 | 54 | 0.504 |
|
numerical
multiplication items |
-1.164 | 0.958 | 0.129 | -1.423 | -0.905 | -9.011 | 54 | 0.000 |
|
multiplication items |
-1.291 | 1.873 | 0.252 | -1.797 | -0.785 | -5.113 | 54 | 0.000 |
|
word division ítems |
-0.964 | 1.186 | 0.160 | -1.284 | -0.643 | -6.027 | 54 | 0.000 |
|
numerical division ítems |
-0.709 | 0.786 | 0.106 | -0.922 | -0.497 | -6.692 | 54 | 0.000 |
|
division ítems |
-1.673 | 1.806 | 0.244 | -2.161 | -1.185 | -6.869 | 54 | 0.000 |
|
word ítems |
-1.091 | 2.057 | 0.277 | -1.647 | -0.535 | -3.933 | 54 | 0.000 |
|
numerical ítems |
-1.873 | 1.441 | 0.194 | -2.262 | -1.483 | -9.639 | 54 | 0.000 |
|
fraction ítems |
-2.964 | 3.055 | 0.412 | -3.789 | -2.138 | -7.195 | 54 | 0.000 |
ítems
3.1. Word multiplication items
We present here an alternative form of item examination to analyse, item by item, improvements as a function of previous academic marks. The item response curve constitutes a very useful visual device to appreciate changes in correct response probability related to academic mark levels. In the first place, it is important to assess children’s knowledge of verbal expressions related to fraction multiplication. Fifth-grade children have informal fraction knowledge, they already understand a fraction as a part of a collection, and they are able to answer a problem expressed in words (how much one-third of 18 are or what is third of 18; ¿cuánto es un tercio de 18). Figure 2 shows the item response curves for the word item: how much is one-third of 18? Students show a relatively good performance in solving this word fractional problem. There is no noticeable change either in control or learning groups.
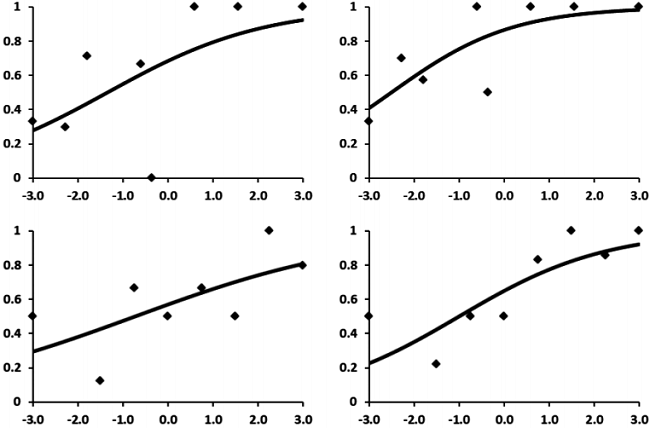
Figure 2 Item response curves depicting the probability of success on the item how much is one - third of 18? as a function of children´s average academic mark, taken as the ability parameter. The horizontal axis is the ability level: from the left to the right, the ability level goes from lower (-3) to higher (+3) levels. The unit on this scale is known as logit (abbreviation for “log of odds unit”). Control groups graphs (above) and learning groups curves (below) show no distinctive differences between pre-test (left) to post-test (right) answers.
We performed a one-way repeated-measures ANOVA on these data using Tukey’s HSD (Honestly Significant Difference) test for post hoc comparisons (Pardo & San Martín, 2010). This analysis compares the item responses by average mark with the aim of validating the item response curve result. As expected, post hoc comparisons of the item responses of the learning groups show that there is no significant difference for any average mark level (see Table III).
Table III Mean differences, standard error, and significance values by average mark resulting from Tukey’s HSD of learning group pre-test/post-test answers to the item How much is one-third of 18?
| Average mark | Mean differences | Standard Error | Sig. | 95% Confidence Interval of the Difference | |
|---|---|---|---|---|---|
| Lower | Upper | ||||
| 5.5 | .000 | .304 | 1.000 | -1.07 | 1.07 |
| 6.5 | -.125 | .215 | 1.000 | -.88 | .63 |
| 7.0 | .286 | .230 | 0.997 | -.52 | 1.09 |
| 7.5 | .000 | .215 | 1.000 | -.76 | .76 |
| 8.0 | -.167 | .248 | 1.000 | -1.04 | .71 |
| 8.5 | -.600 | .272 | 0.689 | -1.56 | .36 |
| 9.0 | .143 | .230 | 1.000 | -.67 | .95 |
| 9.5 | -.200 | .192 | 1.000 | -.88 | .48 |
*. The mean difference is significant at the 0.05 level.
3.2. Numerical multiplication items
The analysis of responses to problems expressed in numerical terms gives a
different result. Most of the children give an incorrect answer at pretest when
the problem is represented numerically (

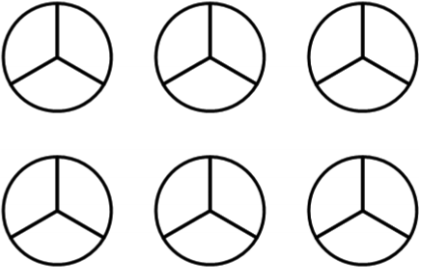
Figure 3 presents the item response curves
for the numerical item: What is
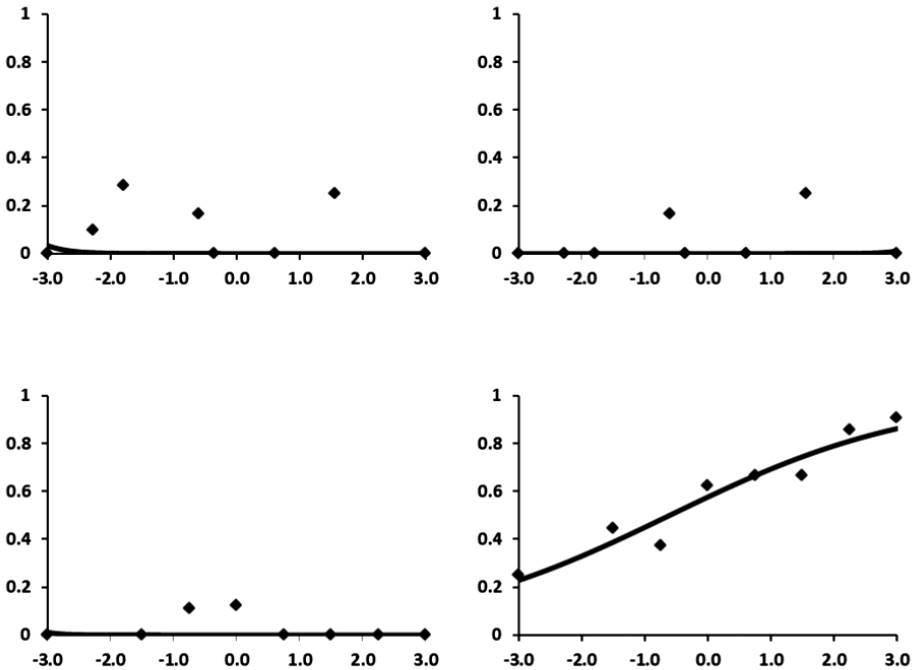
Figure 3 Item response curves depicting the probability of success on the
item What is
In a similar way, we apply a Tukey’s HSD test to compare the item responses by
average mark. In this case, post hoc comparisons of the item responses revealed
that students with an average mark greater than or equal to 8.0 showed a
significant improvement on item response (p < .05). Groups with an average
mark less than or equal to 7.5 showed no significant difference on item response
for any average mark level (see Table
IV). The item response curve indicates that children with these lower
average marks are less likely to answer successfully to the item: What
is
Table IV Mean differences, standard error, and significance values by average mark resulting from Tukey’s HSD of learning group pre-test/post-test answers to the item What is 18×1/3?
| Average mark | Mean differences | Standard Error | Sig. | 95% Confidence Interval of the Difference | |
|---|---|---|---|---|---|
| Lower | Upper | ||||
| 5.5 | -.250 | .227 | .999 | -1.05 | .55 |
| 6.5 | -.375 | .160 | .598 | -.94 | .19 |
| 7.0 | -.429 | .172 | .482 | -1.03 | .18 |
| 7.5 | -.500 | .160 | .145 | -1.06 | .06 |
| 8.0 | -.833* | .185 | .002 | -1.49 | -.18 |
| 8.5 | -1.000* | .203 | .000 | -1.71 | -.29 |
| 9.0 | -1.000* | .172 | .000 | -1.60 | -.40 |
| 9.5 | -.900* | .144 | .000 | -1.41 | -.39 |
*. The mean difference is significant at the 0.05 level.
Teachers also can compare correct answer probability and odds ratio by average mark. Table V presents those data for control and learning groups.
Table V Control groups’ and learning groups’ correct answer probability and its correspondent odds ratio by average mark level to the item What is 18 × 1/3?
| Correct answer probability | Odds ratio | |||||||
|---|---|---|---|---|---|---|---|---|
| control groups | learning groups | control groups | learning groups | |||||
| averagemark | pre-test | post-test | pre-test | post-test | pre-test | post-test | pre-test | post-test |
| 5.5 | 0.00 | 0.00 | 0.00 | 0.50 | 0.00 | 0.00 | 0.00 | 1.00 |
| 6.5 | 0.00 | 0.00 | 0.00 | 0.33 | 0.00 | 0.00 | 0.00 | 0.50 |
| 7 | 0.00 | 0.00 | 0.11 | 0.25 | 0.00 | 0.00 | 0.13 | 0.33 |
| 7.5 | 0.33 | 0.00 | 0.13 | 0.63 | 0.50 | 0.00 | 0.14 | 1.67 |
| 8 | 0.00 | 0.00 | 0.00 | 0.67 | 0.00 | 0.00 | 0.00 | 2.00 |
| 8.5 | 0.00 | 0.00 | 0.00 | 0.67 | 0.00 | 0.00 | 0.00 | 2.00 |
| 9 | 0.25 | 0.25 | 0.00 | 0.86 | 0.33 | 0.33 | 0.00 | 6.00 |
| 9.5 | 0.25 | 0.00 | 0.00 | 0.82 | 0.33 | 0.00 | 0.00 | 4.50 |
We performed a covariate analysis (ANCOVA) to statistically evaluate the effect
of the average mark on item response. ANCOVA represents a recommended data
statistical analysis in our case and it is a combined application of ANOVA and
regression analysis (Kline, 2009; Pardo & Ruiz, 2012). Here we take the
average mark as a covariate, i.e. a variable that predicts the outcome but is
ideally unrelated to the independent variable (Kline, 2013). The obtained results indicate (once the effect of the
average mark was controlled): 1) a significant improvement on item response to
the items What is
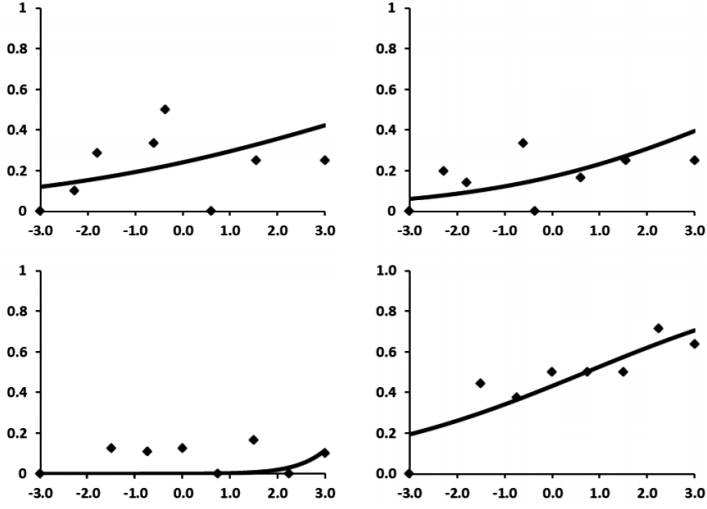
Figure 4 Item response curves depicting the probability of success on the item Which is the number that multiplied by one half equals seven? as a function of children´s average academic mark, taken as the ability parameter. Control groups graphs (above) show no distinctive differences between pre-test (left) to post-test (right) answers, whereas learning groups curves (below) show post-test (right) marked improvements in the probability of correct answer, in particular for those children with the higher average academic mark.
3.3. Numerical division items
On the other hand, to solve fraction division items, even when they are represented verbally, implies difficult concepts for many children. Figure 4 displays the item response curves for control and learning groups corresponding to the item: Which is the number that multiplied by one half equals seven? The increase in correct response probability is lower than in the multiplication item reviewed before.
If teachers perform a Student’s two-tailed paired t-test to analyse the differences observed in this item they can observe that the learning group, in general, showed better results at post-test assessment: t(54) = -6.465, p = .000. But the item response curve indicates that only children with greater average marks have a better post-test performance. Teachers can corroborate it with a Student’s two-tailed paired t-test applied to each average mark. This method produces the calculations displayed in Table VI and they confirm that only children with average marks greater than or equal to 9.0 showed a significant improvement on item response (p < .01).
Table VI Mean differences, standard deviations, standard error differences, and Student’s twotailed paired t-test values by average mark level of learning group pre-test/post-test answer to the item Which is the number that multiplied by one half equals seven?
| Paired Differences | t | df | Sig. (two-tailed) | |||||
|---|---|---|---|---|---|---|---|---|
| Average mark | Mean Difference | Std. Deviation | Std. Error Difference | 95% Confidence Interval of the Difference | ||||
| Lower | Upper | |||||||
| 9.5 | -.600 | .516 | .163 | -.969 | -.231 | -3.674 | 9 | .005 |
| 9.0 | -.714 | .488 | .184 | -1.166 | -.263 | -3.873 | 6 | .008 |
| 8.5 | -.400 | .548 | .245 | -1.080 | .280 | -1.633 | 4 | .178 |
| 8.0 | -.500 | .548 | .224 | -1.075 | .075 | -2.236 | 5 | .076 |
| 7.5 | -.375 | .518 | .183 | -.808 | .058 | -2.049 | 7 | .080 |
| 7.0 | -.286 | .488 | .184 | -.737 | .166 | -1.549 | 6 | .172 |
| 6.5 | -.375 | .518 | .183 | -.808 | .058 | -2.049 | 7 | .080 |
| 5.5 | .000 | .000 | .000 | |||||
4. Conclusions
We present a microgenetic study that focuses on specific proximal influences in cognitive change (Siegler & Chen, 1998). The learning instruction period was brief, three and a half weeks; therefore, we can assume that most important social factors affecting learning remained unchanged for learning and control groups except our instruction sessions with the first groups.
As mentioned above, in this paper we present data about a very important issue related to opposing approaches to the introduction of multiplication or division of fractions: One point of view that contends that fractions and decimals need to be treated differently from whole numbers, and a second approach, which we adopt, that is based on the construction of general relational schemes for any basic mathematical operation. We propose here that fraction multiplication and division must be developed as relational schemes and, basically, as a conceptual generalisation of these operations with natural numbers. We have designed activities in order to develop a general relational scheme of the multiplication and division of numbers. We do not agree that children must understand that fraction multiplication and division produce different outcomes, depending on whether the numbers involved are greater than or less than 1. We could promote the construction of two different sets of numbers if we teach children that understanding fractions requires recognizing that many properties of natural numbers are not properties of numbers in general (Lortie-Forgues, Tian, & Siegler, 2015, Siegler, Thompson, & Schneider, 2011), and this would produce the need of a different procedural scheme to multiply or divide fraction numbers.
On the other hand, we avoid mechanistic procedures (
Our approach probably allows elementary school children to construct a system of numbers such that multiplication and division, products and quotients, are defined by every number comprised in the system. At the elementary school level, that system corresponds to rational numbers, ℚ. Within that system, every number can be expressed as the product or quotient of, at least, two other numbers. That is, every two numbers of the system can be related according to the definitions of multiplication and division to a number termed product or quotient. For example, 15 can be represented as the product of one-half times ten, or the quotient of five divided by one third, i.e. the number that that multiplied by one third equals five.
The authors attempt a first approximation analysis and select students’ average mark as the parameter that could related to the probability of a right answer to an item. We describe here an analysis procedure that permits a visualisation of the learning process as a function of average marks and we present data that supports the validity of this approach. According to the social constructionism approach (Gergen, 2001), we assume that all learning is an active process of social construction. Average marks and item difficulty can be modified by social interaction processes. Children can improve or worsen their academic marks as a result of different social factors. The probability of success in answering an item depends on the average mark of the student. Average mark is basically a socially defined index that represents academic performance, and this index is only one element of the universal set of social indexes designed to assess and analyse learning processes. The item difficulty depends on the learning process. Children pick up a good deal of expertise in the learning process and consequently, the item difficulty diminishes substantially. The logistic function depicts the probability of success on an item as a function of a person’s specified parameter, i.e. it is possible to analyse learning progress in relation to any variable that can be evaluated with non-categorical scales. Consequently, it is necessary to research further significant relationships among other relevant social factors and the probability of success in an item. Here a tool is offered to analyse the relationships between some of these variables and the methods of assessment that teachers apply in their courses.
In this study, we examined whether elementary school children can construct a system of numbers such that fraction multiplication and division are based on the construction of general relational schemes. Learning groups increase their performance following this kind of program. There are statistically significant differences between any general scores, except for word multiplication items. Finally from a Bayesian sequential analysis, we obtained that the results are statistically robust.

