


Servicios Personalizados
Revista
Articulo
 Inglés (pdf)
 Artículo en XML
 Referencias del artículo
 Enviar artículo por email
Indicadores
-
 Citado por SciELO
 -
 Accesos
Links relacionados
-
 Similares en
SciELO
Similares en
SciELO
Compartir

 Permalink
Economía mexicana. Nueva época
versión impresa ISSN 1665-2045
Econ. mex. Nueva época vol.18 no.1 Ciudad de México ene. 2009
Artículos
Does Demand Volatility Lower Growth and Raise Inflation? Evidence from the Caribbean
¿La volatilidad de la demanda reduce el crecimiento y eleva la inflación? Evidencia de países caribeños
Magda Kandil*
Senior economist, Caribbean II Division, Western Hemisphere Department. International Monetary Fund (IMF), Washington DC. mkandil@imf.org
Fecha de recepción: 17 de octubre de 2007.
Fecha de aceptación: 16 de junio de 2008.
Abstract
The paper investigates asymmetry in the allocation of aggregate demand shocks between real output growth and price inflation over the business cycle in a sample of fifteen Caribbean countries. In most countries, the evidence indicates the existence of a kinked supply curve, which implies that positive demand shocks feed predominantly into prices while negative demand shocks mainly affect output. This suggests that the high variability of aggregate demand in Caribbean countries, frequently exposed to shocks, tends to create an upward bias on inflation and a downward bias on real output growth, on average, over time. The analysis highlights the benefits of eliminating structural rigidities responsible for the kinked nature of the supply curve, and points to the dangers of pro–cyclical macroeconomic policies.
Keywords: kinked supply curve, inflation and contractions biases, Caribbean evidence.
Resumen
Este trabajo investiga la asimetría en la distribución de choques de demanda agregada entre el crecimiento real de la oferta y la inflación de precios durante el ciclo de negocios, en una muestra de quince países caribeños. En la mayoría de ellos, la evidencia indica la existencia de una curva de oferta con elasticidad discontinua, lo cual implica que los choques de demanda positivos alimentan predominantemente los precios, mientras que los choques de demanda negativos afectan principalmente la oferta. Esto sugiere que la alta variabilidad de la demanda agregada en países caribeños, expuesta frecuentemente a choques, tiende a crear, en promedio y a lo largo del tiempo, un sesgo hacia arriba en la inflación y un sesgo hacia abajo en el crecimiento verdadero de la oferta. Este análisis enfatiza los beneficios de eliminar las rigideces estructurales responsables de la discontinuidad de la elasticidad de la curva de oferta, y señala los peligros de políticas macroeconómicas pro cíclicas.
Palabras clave: curva de oferta con elasticidad discontinua, sesgos de inflación y de contracciones, evidencia caribeña.
JEL classification: E30, E31, E32, H62.
Introduction
In general, Caribbean countries have been largely successful in bringing annual inflation down to single digits in recent years. Nonetheless, their growth rates have been disappointing despite fiscal stimulus. Previous research (see, e.g., Sahay, 2006) suggests that in the absence of higher growth, the fiscal position may not be sustainable over time.
Caribbean countries are small open economies that are highly dependent on tourism receipts. This unique feature exposes their economies to excessive demand variability from external shocks. The ability of these economies to absorb demand variability has implications for economic performance. Furthermore, as policy makers attempt to smooth the outcome of demand variability on economic performance, structural impediments may impose a serious challenge to their efforts.
To shed some light on structural rigidities governing the relation between demand variability and economic performance, this paper traces the nature of cyclical fluctuations on the macro–economy across a sample of fifteen Caribbean countries. Demand–side fluctuations could arise from domestic factors or policies, including monetary or fiscal policies, or external factors, such as those affecting flows of remittances and/or other determinants of the external position. Asymmetry in the response of real growth and price inflation to demand shocks over the business cycle will determine the net effect of demand variability on economic performance over time.
The analysis indicates that the majority of the Caribbean countries are characterized by a kinked supply curve; i.e., one that is flat when output is below potential and steep when it is above. This implies that during demand expansions, inflation accelerates while the real output response is moderate. On the other hand, during demand contractions, a flatter supply curve implies a bigger drop in real output growth with only a small deceleration in inflation.
These results point to two important policy implications: 1) the need to address structural rigidities that create the kink in the supply curve, and 2) the dangers of procyclical policies that accentuate demand shocks and exacerbate the associate upward bias on inflation and downward bias on real growth.
The outline of the paper is as follows. Section i provides an overview of macroeconomic developments in the fifteen Caribbean countries, focusing on output growth and inflation. Section ii provides a theoretical background for the kinked–slope of the supply curve. Section iii presents the empirical models and results. Section iv analyzes the time–series results. Section v presents the conclusion and policy implications.
I. An overview of Macroeconomic Developments in Caribbean Countries
The analysis of the paper concerns cyclicality in real growth and price inflation across Caribbean countries. This section summarizes major indicators characterizing real growth and price inflation across countries.
Table 1 presents average real GDP growth for each of the countries under investigation over the sample period 1975–2005.1 The lowest average real growth is in Haiti (0.64%) and the highest average real growth is in Belize (5.4%). The volatility of real growth is generally high across Caribbean countries, as measured by the standard deviation. The lowest volatility is in St. Kitts and Nevis, 2.5 per cent, and the highest in Suriname, 5.9 per cent. As noted by Cashin (2006), output in Caribbean countries is, on average, about 1.6 times as variable as output in the United States.2

In Table 1, the rate of inflation, using the GDP deflator, ranges from a low 2.8 per cent in Belize, to a high 25.9 per cent in Suriname over the period 1975–2005. The highest inflation variability is in Suriname, 39 per cent, and the lowest in The Bahamas, 2.8 per cent.
Across countries, where inflation was high, real growth tended to be low, providing some evidence for supply–side constraints. On average, the correlation coefficient between real growth and price inflation is negative (–0.57) and statistically significant across countries. The paper turns to the analysis of fluctuations contributing to variation in real growth and price inflation over time.
II. Theoretical Background
Assume aggregate demand intersects with the aggregate supply curve at a level of output y* that corresponds to full capacity utilization. Aggregate demand may be subject to random shocks that generate fluctuations around the steady state equilibrium output over time. Assume these shocks follow a symmetric distribution, i.e., shocks have zero mean and constant variance. Demand variability determines the size of demand shifts over the business cycle. The allocation of demand shocks between real growth and price inflation is dependent on the shape of the supply curve. Along a linear supply curve with a constant slope, the effects of demand shifts, positive and negative, cancel out, implying demand variability does not determine trend real output growth or price inflation over time. However, this is not the case when the supply curve has a kink (see figure 1).

Theoretical explanations of a kinked–shape supply curve have emphasized the role of institutional and structural rigidities in the labor and product markets. In a framework in which nominal wage negotiations follow contractual agreements, the magnitude and speed of wage adjustments (degree of wage indexation) may be different during expansions and contractions. During boom periods, cost of living adjustments may be specified to guarantee workers upward adjustment of wages, to keep up with inflation. In contrast, employers may resist adjusting wages in the downward direction during recessions.3
Alternatively, the asymmetric flexibility of nominal wages may be an endogenous response to uncertainty impinging on the economic system. Models of the variety of Gray (1978) have emphasized the dependency of the degree of indexation on the variability of stochastic disturbances. Higher demand variability may increase uncertainty and, therefore, the probability of realizing positive and negative demand shocks. Agents may form asymmetric behavior to hedge against uncertainty. Agents are more inclined to hedge against the risk of higher inflation, demanding a stipulation of cost of living adjustments to protect their real wages. In contrast, cost of living adjustments are usually not stipulated in anticipation of a slow down in demand and, therefore, price deflation. Similarly, agents in economies with a history of high trend inflation are likely to have larger incentives for upward wage flexibility, compared to downward flexibility.
An alternative explanation of supply–side asymmetry is based on the frequency and speed of adjusting product prices. This framework emphasizes the cost of adjusting prices "menu costs" in determining producers' decisions. Menu costs comprise the cost and effort involved in changing prices (see, e.g., Ball and Mankiw, 1994). When trend inflation is high, the presence of menu cost implies an upward bias on inflation. High trend inflation increases producers' incentives to raise prices above the current equilibrium, in anticipation of the need for continuous upward adjustment. An expansionary demand shock, coupled with high trend inflation, creates a large gap between desired and actual relative prices. During a recession, producers may resist paying the menu cost to adjust prices downward, as they expect trend inflation to decrease their relative prices in par with their competitors. As a result, positive shocks are more likely to induce a larger upward price adjustment, compared to downward adjustment in the face of negative shocks.
Along a kinked supply curve (see figure 1), demand variability induces a trade–off between real output growth and price inflation. Assuming a steeper supply curve in the face of positive demand shocks, demand variability will have a net average positive contribution to price (inflation) and a net average negative contribution to output (contraction) over time. Accordingly, demand variability increases the trend of price inflation and decreases the trend of real output growth, on average, over time.
III. Econometric Investigation
The investigation will study asymmetry in Caribbean business cycles over the period 1975–2005. Business cycles are fluctuations that develop randomly around the trend component of economic variables. The trend is the domain of real growth, which progresses over time in line with underlying fundamentals that determine production potential. The latter grows over time in line with growth in the economy's endowed resources of labor, capital and technological advances. Consequently, the trend component follows a non–stationary stochastic trend. In contrast, cyclical fluctuations generate transitory deviations around the stochastic trend and, therefore, are the domain of short–term stationary shocks.
It is worth noting a few factors that differentiate the analysis of this paper from similar studies analyzing business cycles in Caribbean countries. Cashin (2006) uses a statistical business–cycle filter to eliminate the trend component from the random cyclical component, following the suggestions of Baxter and King (1999). Similar to Cashin's, the approach of this paper relies on a filtering technique to extract the cycle (stationary component) from the trend (non–stationary component) of the dependent variables under investigation: real GDP and the GDP deflator. However, in contrast to Cashin's work, this paper develops an empirical model to model the cycle, differentiating between the effects of supply and demand shocks, and modeling asymmetry in short–term adjustments to expansionary and contractionary shocks.
The empirical model identifies the size and significance of cyclical responses during booms and recessions. To identify periods of economic booms and recessions, the paper analyzes fluctuations in nominal GDP growth. The empirical model seeks to identify symmetric demand shocks along a stable supply curve. Since observed GDP reflects the intersection of supply and demand, however, it is necessary to control for the effects of factors that shift the supply curve. To isolate demand shocks two controls are used: 1) dummy variables that correspond to the years of natural disasters (see Ramussen, 2006), and 2) the energy price. While these two factors are arguably the major sources of supply–side shocks in the Caribbean countries, it must be acknowledged that other factors, not controlled for in the model, also play a role.
Fluctuations in nominal GDP are decomposed into a steady–state growth and a random cyclical component. The steady–state component corresponds to movements in the underlying fundamentals in full–equilibrium. Empirically, this component is derived as the expected GDP, using available information on a range of variables that are generally assumed to determine aggregate demand in theory.4 The implication is that aggregate demand growth varies with underlying fundamentals over time. However, unforeseen shocks could drive demand growth away from its forecast. These shocks are the source of cyclicality in the economic system.
The unanticipated residual in the forecast equation measures shocks to aggregate demand growth.5 By construction, these shocks have a symmetric distribution, where positive shocks identify periods of economic booms and negative shocks identify periods of recessions. The difference between variables' responses to positive and negative shocks to aggregate demand will identify the degree and direction of asymmetry during booms and recessions.6 If these responses are symmetric, cyclical fluctuations in the face of random demand shocks cancel out over time. A significant response to anticipated demand shifts implies that lagged variables underlying agents' forecasts of aggregate demand have a long–lasting effect on developments in the dependent variables, increasing persistence in observed variables.
III.1. Model Specification
The stationarity of the variables under investigation is tested following the suggestions of Nelson and Plosser (1982). Based on the results of the KPSS test for non–stationarity (see Kwiatowski et al., 1992), the variables under investigation are non–stationary in level and stationary in first difference.7 Given these results, the empirical models are specified in first–difference form as follows:
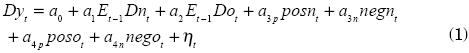
In equation (1), D(.) is the first–difference operator. The logarithm of real output is denoted by yt. The logarithm of nominal GDP, nt, approximates domestic demand for goods and services. This proxy is likely, however, to be affected by major sources of supply–side shocks. To control for the effects of these shocks and untangle demand–driven movements in nominal GDP, the empirical model captures a major source of movements in aggregate supply. The logarithm of the energy price is denoted by ot. Anticipated changes at time t–1 are denoted by Et–1.
To detect asymmetry, shocks to the energy price and aggregate demand are decomposed into positive and negative components, denoted by post and negt. The parameters α3p and α3n measure the responses of the dependent variable to the demand shock during booms and recessions. The direction and degree of asymmetry is measured by the statistical significance of the difference in the response of the dependent variable to the positive and negative components of aggregate demand shocks. Finally, the term ηt is a stochastic error with mean zero and constant variance.
Producers are expected to reflect the cost of anticipated demand fully into their pricing strategy, eliminating the need for additional adjustment in output. Nonetheless, institutional rigidity may prevent full adjustment to demand shifts, necessitating a positive response of real growth. Faced with aggregate demand shocks, producers are expected to vary the output supplied positively with a magnitude that is dependent on resource and structural constraints in the short–run.
In addition, the energy price is expected to determine the cost of production. A higher price of oil increases the cost of the output supplied and decreases real growth.
Asymmetry in the output response to positive and negative demand shocks will verify the possibility of a kinked–shape supply curve.8 A supply curve that is flatter during cyclical downturns and steeper during booms would be supported by a larger α3n relative to α3p.
The empirical model for price inflation replicates that for output growth:

Aggregate price inflation is denoted by Dpt. As demand shocks are absorbed in real growth and price inflation, b3p = 1–a3p , b3n = 1–a3n. If prices are more flexible upward, b3p > b3n and the aggregate supply curve is steeper during booms, relative to recessions.
To understand the propagation mechanism from aggregate demand to the real economy, the analysis considers possible asymmetry in specific demand variables during booms and recessions. To that end, empirical models are estimated using specific demand variables as dependent variables: private consumption growth, Dct, private investment growth, Dvt, export growth, Dxt, import growth, Dimt, and the change in trade balance, Dtbalt.
III.2. Empirical Methodology
To estimate the empirical model in (1), proxies for forecasted growth in domestic demand and the energy price are needed. The growth of aggregate demand, Dnt, is endogenous according to Engle's (1982) test. To form a proxy of agents' forecasts, the growth of aggregate demand is regressed on the lags of selected variables (see footnote 8) based on the results of a formal causality test. Lags of statistically significant variables are included in the forecast equation. In addition, the forecast equation accounts for significant structural break dummies that mark years of natural disasters (see Ramussen, 2006). Dummy variables are introduced following the results of a formal test suggested by Dufour (1982).
The predicted values are a proxy of agents' forecasts of aggregate demand. The residual of the forecast equation is a proxy for unanticipated random shocks to demand growth. To satisfy rationality (see footnote 9), the residual in the forecast equation is a pure white noise with a zero mean and a constant variance. Hence, shocks are distributed symmetrically around the steady state forecasted trend.
Following Cover's (1992) suggestions, positive and negative shocks to demand growth are defined for the joint estimation as follows:

where abs(.) is the absolute value operator and shock is the surprise component to the specific variable, as described above.
The energy price is exogenous. Accordingly, agents' forecast of the energy price is modeled as a second–order autoregressive, or AR (2). The proxy for energy price surprises is then formed by subtracting these forecasts from the actual change in the log value of the energy price. Energy price shocks have zero mean and a constant variance.
Pagan (1984; 1986) showed that the use of regression proxies requires an adjustment of the covariance matrix of estimators of the parameters of the model containing constructed variables. As suggested by Mishkin (1982), a simple alternative is to estimate the expectation equations jointly with the equations explaining the dependent variables using 3sls. To account for the endogeneity of aggregate demand, instrumental variables are introduced. The instrument list includes two lags of the log first difference of real growth, price inflation, the energy price, the real effective exchange rate, government spending and the money supply.9
The results of Engle's (1982) test for the presence of serial correlation in a simultaneous–equation model indicate that the error terms of the empirical models follow an autoregressive process of order one for some countries. For these countries, the estimated empirical models are multiplied through by the filter (1–ρL), where ρ is the serial correlation parameter and L is the lag operator. The serial correlation parameter is estimated jointly with the rest of the model's parameters.10
IV. Analysis of the Time–series Results
All data under investigation are annual and taken from the IMF's International Financial Statistics and the World Economic Outlook databases.
The empirical model in (1) is estimated using data for various dependent variables under investigation. The empirical investigation includes data for the following countries: Antigua and Barbuda, The Bahamas, Barbados, Belize, Dominica, Dominican Republic, Grenada, Guyana, Haiti, Jamaica, St. Kitts and Nevis, St. Lucia, St. Vincent, Suriname, and Trinidad and Tobago. The sample period extends from 1975–2005, except in a few cases where data availability constrained the sample period.
The results are organized in two tables. The tables summarize the parameters that measure the responses of each of the dependent variables to anticipated domestic demand shifts, and the positive and negative shocks to domestic demand.11 Table 2 presents the evidence for real output growth, private consumption, and private investment. Table 3 presents the evidence for export growth, import growth and the change in the trade balance.
IV.1. Real Output Growth
The results of estimating the empirical model of real output growth are presented in table 2 across the sample of Caribbean countries under investigation. The discussion below will focus on asymmetry in the effects of aggregate demand shocks on real output growth during cyclical upturns and downturns. Evidence of this asymmetry will determine the net effect of demand variability on trend real output growth.
During economic booms, an expansionary shock to aggregate demand stimulates real output growth significantly in The Bahamas, Jamaica, St. Kitts and Nevis, and St. Vincent. This is evident by the positive and statistically significant effects of expansionary shocks to aggregate demand on real output growth. The positive response of real growth indicates flexibility to expand the supply during boom periods. In all other countries, there is no evidence of significant real output growth in the face of expansionary demand shocks, implying an inelastic supply curve that necessitates fast adjustment of price inflation to demand expansion.
The contractionary effects of aggregate demand shocks are more pervasive across Caribbean countries. In all but four countries (Dominican Republic, Guyana, Haiti and Jamaica) real output growth shrinks significantly during economic downturns.
The difference in the response of real output growth to positive and negative aggregate demand shocks measures the direction and significance of asymmetry. A negative and significant difference indicates that output contraction exceeds expansion with respect to symmetric fluctuations in aggregate demand shocks. Accordingly, higher variability of aggregate demand, a higher probability of realizing positive and negative shocks, is likely to have a net negative effect, shrinking real output growth, on average, over time. Statistical significance supports this scenario in Antigua and Barbuda, Barbados, Belize, Dominica, Grenada, St. Lucia, Suriname, and Trinidad and Tobago.
There is no country in the group in which the growth expansion from a positive demand shock exceeds the contraction as a result of a negative shock. Output fluctuations appear to be symmetric, indicating a neutral effect of fluctuations in aggregate demand on real output growth, on average over time, in The Bahamas, Dominican Republic, Guyana, Haiti, Jamaica, St. Kitts and Nevis, and St. Vincent. In these countries, institutional and structural constraints are similar during booms and recessions, resulting in similar effects of demand shocks on output expansion and contraction. Hence, the effect of demand variability is neutral on real growth in these countries.
In sum, there appears to be evidence of a kinked supply curve in many Caribbean countries. Specifically, contractionary shocks to aggregate demand move along a flatter supply curve, implying an output contraction that exceeds the expansion resulting from a symmetrical distribution of demand shocks.
IV.2. Price Inflation
The asymmetric impact on inflation is a mirror image of the real output response, as both variables combine to nominal GDP (the corresponding coefficients add up to one). Thus, the shape of the supply curve, supported by the output response, implies an inflationary bias in the face of demand variability.
In table 2, the difference in the response of price inflation to positive and negative aggregate demand shocks measures the direction and significance of asymmetry. A positive and significant difference indicates that price inflation exceeds deflation with respect to symmetric fluctuations in aggregate demand shocks. Accordingly, higher variability of aggregate demand is likely to have a net positive effect, increasing price inflation, on average, over time.12 Statistical significance supports this scenario in Antigua and Barbuda, Barbados, Belize, Dominica, Grenada, St. Lucia, Suriname, and Trinidad and Tobago.
IV.3. Determinants of Asymmetry
Among theoretical explanations of a kinked supply curve, the sticky–price explanation suggests higher incentives to adjust prices upwards, relative to downward adjustment, in countries that have experienced a history of higher trend inflation. In a highly inflationary environment, agents are more inclined to pay the menu cost and adjust prices upwards to prevent a relative deterioration in their product prices. In contrast, high trend inflation reduces incentives to pay the menu cost and adjust prices downwards, contemplating a fast reversal of the cycle.
A sticky–wage explanation also suggests higher incentives to adjust wages upwards in countries with a high inflation trend. Cost of living clauses are likely to be specified to ensure workers adequate compensation in the face of higher inflation. In contrast, wages are likely to be sticky–downward in countries with a high inflation trend. Workers are likely to factor in the impact of higher inflation on real wages, and resist a slowdown in nominal terms during cyclical downturns.
The implication is that a higher inflation trend may provide an explanation for the observed asymmetry. Countries with a higher inflationary trend are likely to exhibit a stronger evidence of asymmetry, implying a steeper supply curve during upturns and a flatter supply curve during downturns.
To verify the validity of this theoretical hypothesis, the parameters measuring asymmetry in output and price in the face of demand shocks are regressed on trend price inflation across the sample of Caribbean countries. The evidence does not support the theory's implications.13 Across countries, a higher inflationary trend significantly increases output expansion relative to contraction, while accelerating price deflation relative to inflation. This evidence suggests that countries with a higher inflationary trend have taken more serious steps to fight inflation.
In light of these results, the empirical evidence rejects possible endoge–neity of asymmetric price flexibility with respect to trend price inflation across countries. Determinants of asymmetric price flexibility are likely to be the result of structural rigidities in labor and product markets that constrain downward adjustments in inflation, even when the trend rate is low.
IV.4. Asymmetry in Specific Demand
To shed some light on the propagation of aggregate demand shocks to the real economy, table 4 highlights major features of asymmetric adjustments in the specific components of aggregate demand over the business cycle.
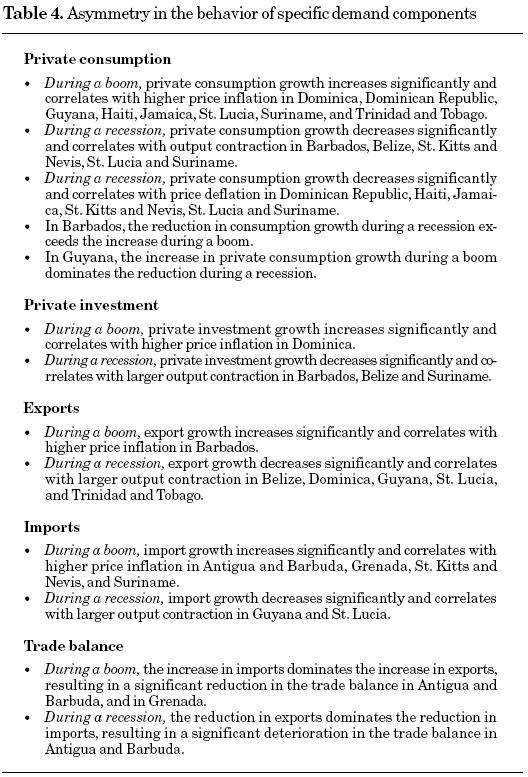
To summarize, asymmetric cyclical fluctuations are also evident in the behavior of demand components over the business cycle. Private consumption increases significantly during economic booms, further accelerating price inflation in some countries. In other countries, significant reduction in private consumption during recessions exacerbates real output contraction. Asymmetric cyclical fluctuations of private investment appear even more pronounced compared to private consumption, further exacerbating the inflationary effect and output contraction over the business cycle. In general, cyclicality in exports and imports cancels out during booms and recessions, moderating cyclical fluctuations in the trade balance.
V. Summary and Conclusion
In an empirical model that differentiates responses to positive and negative demand shocks, the paper investigates asymmetry in the allocation between real output growth and price inflation. The results indicate that the majority of Caribbean countries are characterized by a kinked aggregate supply curve. Asymmetry, in most cases, reveals a steeper supply curve with respect to expansionary demand shocks, compared to contractionary shocks. Consequently, relative to the underlying trend, output contraction exceeds expansion and price inflation exceeds deflation over the business cycle; variability creates negative growth and a positive inflation bias.
Two major policy implications emerge from this analysis. First, the evidence warrants a careful analysis of institutional and structural rigidities that underlie the kinked–shape supply curve in many of the countries under investigation. A review of constraints to factor mobility and institutions for price adjustments would be helpful in identifying the precise factors responsible for the kinked supply curve. Priorities should then be established to reduce such structural rigidities in the factor and product markets, responsible for downward biases on growth and upward biases on inflation, implied by the kinked supply curve.
A parallel policy track should aim at smoothing demand variability. Demand variability can be exacerbated by procyclical macroeconomic policies that amplify the impact of external shocks. In particular, additional fiscal spending during economic booms further accelerates price inflation, while a slowdown in government spending during a recession exacerbates the contractionary effects. As a result, procyclical policies only serve to worsen the growth–reducing and inflationary bias associated with a kinked supply curve.
References
Agenor, P. R., C. J. McDermott and E. Prasad (2000), "Macroeconomic Fluctuations in Developing Countries: Some Stylized Facts," World Bank Economic Review, 14, pp. 251–285. [ Links ]
Backus, D. and P. Kehoe (1992), "International Evidences on the Historical Properties of Business Cycles," American Economic Review, 82, pp. 864–888. [ Links ]
Ball, Laurence and N. Gregory Mankiw (1994), "Asymmetric Price Adjustment and Economic Fluctuations", Economic Journal. [ Links ]
Ball, Laurence, N. Gregory Mankiw and D. Romer (1988), "The New Keynesian Economics and the Output–Inflation Tradeoff", Brookings Papers on Economic Activity, 1, pp. 1–65. [ Links ]
Baxter, M. and R. King (1999), "Measuring Business Cycles: Approximate Band–Pass Filters for Economic Time–Series", Review of Economics and Statistics, 81, pp. 575–593. [ Links ]
Blanchard, Olivier, J. and Lawrance H. Summers (1988), "Beyond the Natural Rate Hypothesis", The American Economic Review, 78, p. 187. [ Links ]
Borda, P., O. Manioc and J. Montauban (2000), "The Contribution of US Monetary Policy to Caribbean Business Cycles," Social and Economic Studies, 49, pp. 225–250. [ Links ]
Burns, A. and W. Mitchell (1946), Measuring Business Cycles, National Bureau of Economic Research, New York. [ Links ]
Canova, F. (1998), "Detrending and Business Cycle Facts", Journal of Monetary Economics, 41, pp. 475–512. [ Links ]
Cashin, Paul (2006), "Caribbean Business Cycles," in Ratna Sahay et al. (eds.), The Caribbean from Vulnerability to Sustained Growth, International Monetary Fund, pp. 17–57. [ Links ]
Corbae, P. D. and S. Ouliaris (2003), "Extracting Cycles from Non–Stationary Data", Econometric Theory and Practice: Frontiers of Analysis and Applied Research, essays in honor of Peter C. B. Phillips, edited by P. D. Corbae, B. Hansen and S. Durlauf. [ Links ]
Cover, James P. (1992), "Asymmetric Effects of Positive and Negative Money Supply Shocks," Quarterly Journal of Economics, 107, pp. 1261–1282. [ Links ]
Craigwell, R. and A. Maurin (2002), "Production and Unemployment Cycles in the Caribbean: The Case of Barbados and Trinidad and Tobago", mimeo, Research Department, Central Bank of Barbados. [ Links ]
DeLong, Bradford and Lawrence H. Summers (1988), "How Does Macro–economic Policy Affect Output?" Brookings Papers on Economic Activity, pp. 433–480. [ Links ]
DeMasi, P. (1997), "IMF Estimates of Potential Output: Theory and Practice," Staff Studies for the World Economic Outlook, Washington DC, International Monetary Fund, pp. 40–46. [ Links ]
Dickey, David A. and W. Fuller (1981), "Likelihood Ratio Statistics for Autoregressive Time Series with a Unit Root," Econometrica, 49, pp. 1057–1072. [ Links ]
Dufour, J. M. (1982), "Generalized Chow Tests for Structural Change: A Coordinate Free Approach", International Economic Review, 23, pp. 565–575. [ Links ]
Engle, R. R. (1982), "A General Approach to Lagrange Multiplier Model Diagnostics", Journal of Econometrics, 20, pp. 83–104. [ Links ]
Fischer, Stanley (1977), "Long–Term Contracts, Rational Expectations and the Optimal Money Supply Rule", Journal of Political Economy, 85, pp. 191–205. [ Links ]
Ghosh, A. R. et al. (2002), Exchange Rate Regimes: Choices and Consequences, Cambridge, MA, MIT Press. [ Links ]
Gray, Jo Anna (1978), "On Indexation and Contract Length", Journal of Political Economy, 86, pp. 1–18. [ Links ]
Hodrick, R. J. and E. C. Prescott (1980), "Post–War US Business Cycles: An Empirical Investigation", discussion paper No. 451, Pennsylvania, Carnegie–Mellon University. [ Links ]
Kandil, Magda (1995), "Asymmetric Nominal Flexibility and Economic Fluctuations," Southern Economic Journal, January, 61 (3), pp. 674–695. [ Links ]
–––––––––– (1996), "Sticky–Wage or Sticky–Price? Analysis of the Cyclical Behavior of the Real Wage", Southern Economic Journal. [ Links ]
–––––––––– (1998), "Supply–Side Asymmetry and the Non–Neutrality of Demand Fluctuations", Journal of Macroeconomics, 20 (4), pp. 785–810. [ Links ]
–––––––––– (1999), "The Asymmetric Stabilizing Effects of Price Flexibility: Historical Evidence and Implications", Applied Economics, 31, pp. 825–839. [ Links ]
–––––––––– (2001), "Asymmetry in the Effects of US Government Spending Shocks: Evidence and Implications", The Quarterly Review of Economics and Finance, 41, pp. 137–165. [ Links ]
–––––––––– (2002a), "Asymmetry in Economic Fluctuations in the US Economy: The Pre–War and the 1946–1991 Periods Compared," International Economic Journal, 16 (1), spring, pp. 21–42. [ Links ]
–––––––––– (2002b), "Asymmetry in the Effects of Monetary and Government Spending Shocks: Contrasting Evidence and Implications", Economic Inquiry, 40 (2), pp. 288–313. [ Links ]
–––––––––– (2008), "Exchange Rate Fluctuations and the Macroeconomy: Channels of Interaction in Developing and Developed Countries," Eastern Economic Journal, 34 (2), pp. 190–212. [ Links ]
–––––––––– and I. A. Mirzaie (2002), "Exchange Rate Fluctuations and Disaggregate Economic Activity in the US: Theory and Evidence," Journal of International Money and Finance, 2 (1), February, pp. 1–31. [ Links ]
Knight, W. E. (1996), "A Computer Method for Calculating Kendall's Taw with Ungrouped Data," Journal of American Statistical Association, 61,436–439. [ Links ]
Kwiatowski, Denis et al. (1992), "Testing the Null Hypothesis of Stationarity Against the Alternative of a Unit Root, How Sure Are We That Economic Time Series Have a Unit Root?" Journal of Econometrics, 54, pp. 159–178. [ Links ]
Lindbeck, Assar and Dennis Snower (1986), "Wage Setting, Unemployment, and Insider Outsider Relations", The American Economic Review, 76, 235–239. [ Links ]
Lucas, Robert (1973), "Some International Evidence on Output–Inflation Tradeoffs", American Economic Review, pp. 326–334. [ Links ]
Mamingi, N. (1999), "Testing for Convergence and Common Features in International Output: The Case of the Eastern Caribbean Countries", Journal of Eastern Caribbean Studies, 24, pp. 15–40. [ Links ]
Mendoza, E. (1995), "The Terms of Trade, the Real Exchange Rate, and Economic Fluctuations," International Economic Review, 36, pp. 101–137. [ Links ]
Mishkin, F. S. (1982,) "Does Anticipated Monetary Policy Matter? An Econometric Investigation", Journal of Political Economy, 90, pp. 22–51. [ Links ]
Nelson, Charles and Charles Plosser (1982), "Trends and Random Walks in Macroeconomic Time Series," Journal of Monetary Economics, 10, 139–162. [ Links ]
Pagan, A. (1984), "Econometric Issues in the Analysis of Regressions with Generalized Regressors", International Economic Review, 25, pp. 221–247. [ Links ]
–––––––––– (1986), "Two–Stage and Related Estimators and Their Applications", Review of Economic Studies, 53, pp. 517–538. [ Links ]
Ramussen, Tobias (2006), "Natural Disasters and Their Macroeconomic Implications," in Ratna Sahay et al. (eds.), The Caribbean from Vulnerability to Sustained Growth, International Monetary Fund, pp. 181–205. [ Links ]
Romer, C. and D. Romer (1989), "Does Monetary Policy Matter?" in Olivier Blanchard and Stanley Fischer, NBER Macroeconomics Annual. [ Links ]
Sahay, Ratna (2006), "Stabilization, Debt, and Fiscal Policy in the Caribbean", in Ratna Sahay et al. (eds.), The Caribbean from Vulnerability to Sustained Growth, International Monetary Fund, pp. 17–57. [ Links ]
* The views expressed herein are those of the author and should not be attributed to the IMF, its executive board, or its management. The paper describes research in progress by the author.
1 For related literature analyzing Caribbean growth cycles, see Mamingi (1999), Borda, Manioc and Montauban (2000), and Craigwell and Maurin (2002), among others. DeMasi (1997) provides a summary of approaches taken by the International Monetary Fund in estimating growth cycles.
2 Mendoza (1995) and Agenor et al. (2000) attribute the high volatility in developing countries to the greater incidence of exogenous shocks.
3 Some (see, e.g., Kandil, 2002a) explain downward wage rigidity by employers' desire to retain experienced workers, and avoid the search and training cost of hiring new workers to accommodate a potential future rise in demand. In the context of the Caribbean region, employment is dominant in the public sector. Political consideration may necessitate higher compensation of civil servants during economic booms, while resisting a slow down in the wage bill during downturns.
4 To decide on the list of variables in the forecast equation, nominal GDP growth is regressed on its lags and lagged values of variables that are likely to determine aggregate demand in theory. The list includes lagged variables of real output growth, price inflation, the growth of the money supply, the growth of government spending, the change in real effective exchange rate, the change in the oil price, and a dummy variable to control for structural breaks due to natural disasters. The final specification includes lagged variables that are proven to be statistically significant using a formal causality test. To establish robustness, the empirical models are estimated using alternative ad hoc specifications that include variations of the mix and/or lags of variables in the forecast model. The qualitative results are robust to these variations. For details, see Kandil (2008).
5 Rational forecast requires two conditions: 1) the forecast error is purely random white noise, i.e., agents are not making systematic mistakes over time, and 2) the forecast error is uncorrelated with lagged variables that enter the information list, i.e., agents have capitalized fully on available information.
6 A number of studies have analyzed asymmetric cyclical fluctuations. Using quarterly data for the United States, the evidence of Cover (1992) suggests that positive money supply shocks do not have an effect on output, while negative money supply shocks do. Kandil (1995) provides evidence and explanation of the asymmetric effects of monetary shocks across a sample of major industrial countries. Kandil (1996; 2002a) analyzes the evidence of the asymmetric effects of aggregate demand shocks, using aggregate data of real output, prices and wages for the United States. Kandil (1998; 1999) contrasts the evidence of supply–side asymmetry using aggregate demand shocks across a sample of developing and industrial countries. Kandil (2001; 2002b) investigates asymmetry in the effects of monetary and government spending shocks using aggregate data for the United States. Other evidence on the asymmetry of business cycles includes DeLong and Summers (1988), Romer and Romer (1989).
7 Non–stationarity test results are robust using alternative tests that assume non–stationarity as the null hypothesis. See, e.g., Dickey and Fuller (1981).
8 The asymmetric impact of demand shocks on real output growth is not addressed in the context of mainstream business–cycle theories, which include the equilibrium explanation pioneered by Lucas (1973) and neo–Keynesian models emphasizing nominal wage rigidity (e.g., Fischer, 1977; Gray, 1978), or price rigidity (e.g., Ball, Mankiw and Romer, 1988).
9 Joint estimation takes into account correlations across equations in the empirical model. Alternatives include the estimation of a vector autoregressive model, which is often specified using distributed lags of an ad hoc selection of random variables. The approach of this paper compares more favorably, as it relies on rational forecasts to specify steady state equilibrium. Concurrently, shocks are introduced into the final model specification to test theory's prediction regarding the distinction between anticipated and unanticipated movements in demand and supply shifts, as well as possible asymmetry in the effects of positive and negative demand shocks. The theory underlying the model specification is based on Kandil and Mirzaie (2002). For similar empirical investigations see Kandil (2008).
10 Experiments introducing country–specific variables in the model specification are constrained by data availability. Such experiments, where possible, confirm the qualitative results of the paper. To facilitate comparison of the results across countries, the paper presents a uniform model specification while ensuring that the random error is purely white noise. This approach builds on the specification in Kandil (2008) to avoid random selection of explanatory variables that could bias estimated parameters and hinder cross country comparison.
11 Details of estimated parameters are available upon request.
12 In support of this evidence, in a cross–country regression, trend inflation increases significantly the higher the variability of aggregate demand.
13 This evidence supports the analysis in Kandil (1995) applying this paper's methodology in the analysis of industrial countries' data.

