


Servicios Personalizados
Revista
Articulo
 texto en
  Inglés (pdf)
 Artículo en XML
 Referencias del artículo
 Enviar artículo por email
Indicadores
-
 Citado por SciELO
 -
 Accesos
Links relacionados
-
 Similares en
SciELO
Similares en
SciELO
Compartir

 Permalink
Política y gobierno
versión impresa ISSN 1665-2037
Polít. gob vol.27 no.2 Ciudad de México jul./dic. 2020 Epub 17-Feb-2021
Research Notes
The Power of Vote Electoral Change and National Party System in Mexico 2018*
1Profesor-investigador del Centro de Investigación y Docencia Económicas (CIDE) y catedrático Conacyt adscrito al Laboratorio Nacional de Políticas Públicas (LNPP). Carretera México- Toluca 3655, Lomas de Santa Fe, 01210, Ciudad de México. Tel: 5727 9800, ext. 2440. Correo-e: se- bastian.garrido@cide.edu.
2Flavia Freidenberg es profesora-investigadora en el Instituto de Investigaciones Jurídicas de la Universidad Nacional Autónoma de México (UNAM). Circuito Mario de La Cueva s/n, C.U., 04510, Ciudad de México. Tel: 55 5622 7474. Correo-e: flavia@unam.mx.
This paper analyzes how the Mexican electorate modified the configuration of the party system after the 2018 election. By analyzing the structure and dynamics of electoral competition, it explores different dimensions to determine the magnitude of electoral change and how it has translated into the party system after this election. The paper compares the results of the presidential and legislative elections between 1994-2018. This research offers a historical perspective of the magnitude of the changes registered during this election in both the structure of electoral competition (the massive reorientation of the vote in large part of the country, the re-concentration of power in one party, the reduction of partisan fragmentation and the changes in the nationalization of the vote of the leading forces) and the dynamics of electoral competition (the emergence of the first unified party government since 1994, the carryover effect of the presidential election in the legislative election results).
Keywords: elections; political parties; party system; structure of electoral competition; dynamic of competition
Este trabajo analiza el modo en que el electorado mexicano cambió la configuración del sistema de partidos tras la elección de julio de 2018. A través del análisis de la estructura y la dinámica de competencia, se exploran diversas dimensiones para determinar la magnitud del cambio electoral y su traducción en el sistema de partidos tras esta elección. Para ello se comparan los resultados de las elecciones presidencial y de diputados federales en 2018 con el de las elecciones celebradas desde comienzos de la década de 1990. Esta investigación ofrece una perspectiva histórica de la magnitud de los cambios registrados en esta elección tanto en la estructura de competencia (la masiva reorientación del voto en buena parte del país, la reconcentración de poder en un partido, la reducción de la fragmentación partidista y los cambios en la nacionalización de voto de las principales fuerzas) como la dinámica de competencia (el surgimiento del primero gobierno de partido unificado desde 1994, el efecto de arrastre de la elección presidencial en los resultados legislativos).
Palabras clave: elecciones; partidos y sistemas de partidos; estructura de competencia; dinámica de competencia
Introduction
Mexico held a historic election on July 1, 2018. It was the biggest and most complex election day that the country has had to date.1 Andrés Manuel López Obrador (AMLO) and the National Regeneration Movement (Spanish: Movimiento Regeneración Nacional, Morena) —a political party created in 2014— led a drastic reconfiguration of political power based on the change in the electoral preferences of citizens. It was the third time that AMLO had run for president and this time he managed to achieve a difference of more than thirty points over the second competitor, also generating a strong coattail effect on the election of the other federal and sub-national institutional positions (deputations, senators, governors, mayors).
Citizens actively participated on the day of the election and cleared up much of the uncertainty that had surrounded the electoral process. It was the first presidential election held under new rules, adopted in 2014, that defined a new model of electoral governance and increasingly more robust rules —including gender perspective— for the candidacy registration of federal and local representative positions.
This electoral process once again revealed how the Mexican party system is an exciting laboratory for comparative politics, given that in the last decades, it has undergone substantial changes in terms of greater party competition.2 Those changes were accompanied by an increasingly significant rise in political pluralism, coming from a hegemonic party system and evolving into one of limited pluralism (Alarcón Olguín and Reyes del Campillo, 2016; Greene, 2007; Magaloni, 2006). Historically, the transformations of the Mexican party system have been originated fundamentally by electoral reforms carried out since 1977. Several researches (Garrido de Sierra, 2019; Méndez de Hoyos, 2003) have described the relationship between these institutional variables and their effects on the competition of the party system.
Unlike the classic institutionalist vision of change focused on the effect of electoral rules, the 2018 election showed that individual political behavior could change the characteristics of the party system. The elections carried out amid a political representation crisis and distrust of citizens towards parties, and traditional politics (Latinobarómetro, 2018; Robles and Benton 2018; Cantú and Hoyo, 2017),3 once again revealed that —despite this crisis— the electorate still chose parties (in this case, a movement created in 2011), demonstrating that partisan labels continue to play a significant role in Latin American politics despite political, social and economic crises (Freidenberg, 2016).
This article aims to describe the magnitude of the electoral change and its translation into the party system after the July 2018 election, comparing this process diachronically with the federal elections held since the beginning of the 1990s —the 1991 legislative elections and the 1994 presidential elections.4 The article offers a comparative historical perspective of the magnitude of the changes registered in 2018 in both the competition structure (the massive reorientation of the vote in much of the country, the re-concentration of power in one party, the reduction of partisan fragmentation and changes in the nationalization of the vote of the leading forces) and the dynamics of competition (the emergence of the first unified party government since 1994, the carryover effect of the presidential election on the legislative election results).
The article divides into five parts. In the first, it discusses various theoretical elements enabling a comparative approach to electoral change and the characteristics of the party system. The second describes the social and institutional context that influenced the decisions of voters and parties that participated in the election. The third describes the extent and magnitude of Andrés Manuel López Obrador’s victory in the presidential election, comparing his performance with that of the winning candidates of the four previous presidential elections (1994-2012) and showing the transformations of competition in the party system. Fourth, to have elements that allow a greater understanding of the new dynamics of party system competition, the changes in the legislative electoral results in the Chamber of Deputies are analyzed in a series of dimensions between 1991 and 2018. Finally, we analyze the Morena electoral tsunami and its effects on a party system that is still transforming.
Theoretical discussion and methodological details
A plural and competitive party system is essential for a political regime to be considered democratic (Schattschneider, 1964; Sartori, 1992; Caramani, 2008). Therefore, one of the main tools to assess the “health status” of a democracy is to analyze the structure and competition dynamics of its party system (Sartori, 1992; Mair, 1990; Caramani, 2008). Both the level of competitiveness and plurality of a party system can and usually do change over time as a result of the internal dynamics of the parties themselves (death of the leader, internal crisis, conflicts between factions); by the influence of external agents in the organization (media, other leaderships, social movements, international political organizations) as well as by the impact of electoral reforms and (or) changes in vote orientation towards political forces of the citizenry, among others.
Political Science studies party systems and their changes in two primary dimensions: the structure and dynamics of competition (Freidenberg, 2016; Caramani, 2008; Mair, 1990). The structure of the competition is the “heart of the party system” (Freidenberg, 2016; Sartori 1976, 1992). This dimension reveals the format of the competition (the number of parties that compete and their size), usually measured through different indicators, including the percentage of votes obtained by each party in an election (orientation of the vote towards a party), the percentage of geographical units where the winning candidate obtained the highest number of votes, the degree of fragmentation of the party supply and the nationalization level of the parties and the party system.
The dynamics of competition denote the competitive interactions amongst parties and their environment, which unveil strategies and programmatic positions of political parties, as well as the cooperation among the actors and the effects it has on the political system (Torcal, 2015; Caramani, 2008). This second dimension can be analyzed either by measuring how the relative strength of each political party changes over time or by the margin of the advantage of the first force concerning its closest competitor, indicating the level of uncertainty of the competition. Sartori (1976 and 1992) analyzes the level of polarization amongst parties, to understand the distance and/or the overlapping of their programmatic and ideological positions, and to establish the cooperation/conflict capacity of a party system.
The analysis of these partisan competition patterns should be carried out, taking a temporal continuum into account (Anduiza and Bosch, 2004: 91), as the comparison between electoral processes makes it easier to detect, understand and explain changes in the competition and plurality patterns of a party system. Establishing the magnitude of change and its impact on the political system requires a comparison between the data from different elections.
In order to evaluate the transformations that voting can generate on the party system, this study uses a series of indicators of comparative politics that allow a better understanding of how the competitiveness and pluralism of the Mexican electoral system changed after the federal 2018 elections. These indicators measure the changes at the demand level (the orientation and change of vote) and the partisan supply level (the level of fragmentation and the effective number of parties, competitiveness, and the nationalization of support). These tools provide the means to compare —adhering to the measurements used in comparative politics— the transformations that party systems undergo over time and, thus, identify if the elections are similar or different from each other and how they affect the party system (Torcal, 2015).
Social and institutional context
The climate of the election
The Mexican party system, regarding various elements in Latin American comparative politics, is one of the most interesting ones. The system evolved from one of a hegemonic party (Greene, 2007; Magaloni, 2006), where one partisan organization was benefited by the State in terms of privilege and resources and could control the access and the exercise of political representation, to another more plural system. For decades, the Institutional Revolutionary Party (Spanish: Partido Revolucionario Institucional, PRI), apart from directly or indirectly controlling the electoral and governmental organization, could set obstacles and difficulties in the way of opposition organizations (Langston, 2017; Alarcón Olguín and Reyes del Campillo, 2016; Greene, 2007; Magaloni, 2006).
The electoral reforms started “de-hegemonizing” competition, configuring a “system of limited pluralism” at the federal level (Alarcón Olguín and Reyes del Campillo, 2016), with multiple diverse competition scenarios at the subnational and local levels, accounting for strong authoritarian legacies that conditioned the party system (Greene and Sánchez-Talanquer, 2018). In the presidential election, despite the competition of various parties (PRI, PAN, PRD, and other small ones), only two partisan organizations managed to get their candidate to occupy the presidential seat: the PRI (1934-1994 and in 2012) and the PAN (2000 and 2006), with the consequent defeat of the left-wing forces (PRD) in each of their attempts to win the election.
As in previous elections (Freidenberg and Aparicio, 2016; Trejo and Ley, 2015; Palma, 2010), the 2018 federal elections were held in a context of insecurity and structural violence. Even though the process was carried out normally and peacefully on election day, the context in which the electoral campaign unfolded was one of the great social conflicts. According to data from the INE (2018b), only 27 candidates for various positions suffered political violence during the electoral campaign. In contrast, journalistic investigations have reported a greater number of attacks on candidates for various positions and also on officials and journalists throughout the country.5 On this subject, it is also worth reviewing the work of Víctor Hernández in this same issue.
Changes in the structure and competition dynamics in the mexican party system
The results in the presidential election
AMLO won in almost every corner of the country
The distribution of support in the 2018 presidential election shows that the preferences were highly concentrated around a single candidate. Andrés Manuel López Obrador (AMLO) won the 2018 presidential election with 53.2 per cent of the votes. It is the most outstanding result in a presidential election since Carlos Salinas de Gortari was declared the winner with 48.7 per cent of the votes in 1988 (Molinar and Weldon, 2014). The fact that Morena, a recently created party, obtained this level of support illustrates the changes at the level of the electorate’s preferences, mutating from other parties.
Regardless of the level of (de)aggregation in which the presidential election data is analyzed, the conclusion is the same: AMLO won in all instances of voting and in almost all corners of the country. Figure 1 includes four panels, each of which shows the percentage of voting booths, precincts, districts, and states6 obtained by the winning presidential candidate in each of the last five elections: Ernesto Zedillo (1994), Vicente Fox (2000), Felipe Calderón (2006), Enrique Peña Nieto (2012) and Andrés Manuel López Obrador (2018).

Source: Own elaboration based on official data.
FIGURE 1 Percentage of votes where the winning presidential candidate obtained the highest number of votes, 1994-2018
If we look specifically at the 2018 results, Figure 1 reveals that AMLO obtained more votes than any of his rivals in 80 per cent or more of the voting booths, precincts, and municipalities in Mexico. If districts and states are also analyzed as an aggregate unit of support, that figure increases to 92 and 96.9 per cent, respectively. With the same rules of the game as in previous elections, this candidate who had already competed and could not attain victory ended up winning. After several attempts (2006, 2012 and 2018), it was only in the most recent presidential election that a candidate from a new political movement (Morena), which began to take shape seven years earlier and formally obtained its registration as a party in 2014, managed to win the presidential election. A broad movement made up of elites and factions from other groups (such as the PRD or PAN), left-wing intellectuals, and civil society organizations gathered around the leadership of Andrés Manuel López Obrador, who was competing as a candidate for the third time in the presidential election.
Figure 1 also confirms that in the same sense that other works have shown (Torreblanca et al., 2018), AMLO’s electoral success in 2018 spread to almost all corners of the country. It shows that the geographic magnitude of his victory exceeded that of any of the other winning presidential candidates since, at least, 1994. In comparative terms, the territorial extension of López Obrador’s presidential victory was very similar to that of Zedillo in the four geographic levels analyzed and far superior to that of the other three winning presidential candidates. AMLO won at least 25 per cent more voting booths, precincts, districts, and states than Fox, Calderón, and Peña Nieto.
Consistent with the data presented so far, López Obrador’s performance in 2018 far exceeded his achievements in the 2006 and 2012 presidential elections. Figure 2 compares the percentage of votes obtained in the presidential elections by state in 2012 and 2018 for the party coalition candidacies led by the PAN, the PRI, and AMLO.

Source: Own elaboration based on official data.
FIGURE 2 Change in the percentage of votes obtained by main presidential candidates in 2012 and 2018, by state
Between 2012 and 2018, López Obrador improved his voting percentages in the 32 entities of the country. These increases range from 4.76 per cent (Mexico City) to 40.8 per cent (Sinaloa). At the other end, the presidential candidate of the 2018 PRI-led coalition, José Antonio Meade, obtained lower voting percentages in all states compared to Enrique Peña Nieto in 2012. These percentage drops are between -13.3 per cent (Coahuila) and -33.4 per cent (Nayarit). Ricardo Anaya, the candidate of the PAN-led coalition, registered higher voting percentages than those of Josefina Vázquez Mota in 2012 in 10 states and worse percentages in the remaining 22.
Figure 3 offers a complementary perspective regarding the improvement of AMLO’s electoral performance in 2018. It shows the percentage of votes López Obrador obtained in each state in the presidential elections of 2006 (yellow dots), 2012 (blue dots) and 2018 (red dots). The Figure reveals that, compared to 2006 and 2012, in 2018, AMLO obtained his highest voting percentages in all entities, except one (Mexico City).

AMLO won with wide margins
The analysis of the 2018 results shows that López Obrador’s margin of victory against his opponents was enormous, which makes the uncertainty level of the competition small since the advantage over his competitors (measured by the public opinion polls) presented him as the winner weeks before the election. His advantage over the candidate who came in second was, on average, 36.6 per cent in voting booths, 35.4 per cent in precincts, 33.6 per cent in municipalities, 32.2 per cent in districts, and 33 per cent in states.
Figure 4 offers a historical comparison between the percentage of votes and the margin of the victory obtained by López Obrador at the voting booth-level in 2018 and those obtained by the four previous winning presidential candidates. The graphs in the left column show the distribution of the percentage of votes obtained by Zedillo, Fox, Calderón, Peña Nieto, and López Obrador. The graphs on the right illustrate the distribution of the advantage percentage obtained by each of these candidates.7 The higher the curve, the greater the number of voting booths in which the winning presidential candidate obtained that percentage of votes or margin of victory.

Source: Own elaboration based on official data.
FIGURE 4 Percentage of votes and margin of victory of the winning presidential candidate over the second place, 1994-2018
The contrast between AMLO’s percentage distributions and vote margin and that of the other winning presidential candidates is significant. On the one hand, López Obrador obtained the highest average percentage of votes in the last five elections (52.6%). On the other hand, the average margin of victory for the Morena presidential candidate (36.6%) was substantially greater than that of the other four winning presidential candidates (between 17.5 and 28.1%).
Consequently, the pronounced right-skewness that characterizes the distribution of the margin of victory for Zedillo, Fox, Calderón, and Peña Nieto, was significantly reduced for AMLO. Another interesting fact is that while the average margin of victory for the winning presidential candidates fell by more than ten percentage points between 1994 and 2012, in 2018 López Obrador reversed this trend and managed to increase it by almost 20 percentage points if compared to the average margin obtained by Peña Nieto (17.5%) in the 2012 election.
The electoral results at the legislative level
Results of the federal deputies election
The coattail effect of the presidential election in the legislative one was evident. Driven by the performance of López Obrador in the presidential election, the Morena candidates in single-member federal districts obtained equally outstanding results.8 Altogether, almost 20.8 million citizens voted for Morena in the federal deputies’ election (plurality vote tier), which is equivalent to 37.2 per cent of the total of casted votes. Although this percentage is 16 per cent lower than what AMLO obtained (53.2%), the votes for Morena in the federal deputy’s election (plurality vote tier) are more than the ones obtained by the PAN and the PRI combined (19.3 million). To put this fact in historical perspective, the 2018 federal deputies’ election is the first since 1994 in which the dominant party gets more votes than the second and third together.
Morena won in the vast majority of districts
Morena, the Labor Party (Spanish: Partido del Trabajo, PT) and the Social Encounter Party (Spanish: Partido Encuentro Social, PES) jointly won 220 single-member federal legislative in the 2018 elections. Although this, in itself, is a significant result, it hides an even higher figure. If the votes of each political party are considered separately, Morena won more votes than any other political force in 224 of the country’s 300 districts (74.7%) (Figure 5). These results reveal the magnitude of transformation that the 2018 elections generated at the parties’ level of territorial presence and in the dynamics of competition in the party system. The level of voter support for the new political group translated into a “tsunami” both in the integration of the two federal legislative institutions and in the displacement of the parties that have dominated the political contest in the Mexican political system.

Source: Own elaboration based on official data.
FIGURE 5 Number of congressional districts in which the main party or coalition obtained the highest number of votes, 1991-2018
No party or coalition had managed to become the first electoral force in such a high number of districts since 1994, when the PRI won in 273 of the 300 districts (91%). The closest historical reference is the 2009 midterm election, but even on that occasion, the PRI obtained the highest number of votes in 43 districts less than Morena in 2018 (181 vs. 224). At the same time, one of the most significant effects of this election was precisely the magnitude of the PRI’s electoral defeat throughout the country.
Morena won with wide Margins
Just like López Obrador —and in large part precisely because of his leadership—, Morena obtained a high percentage of votes in the 224 districts where it was the first electoral force (Figure 6). On average, Morena won over 220 districts with 41.8 per cent of the votes, and its average advantage over the second electoral force was 21.4 per cent.

Source: Own elaboration based on official data. *In these elections we consider electoral districts won by PAN and PRI, respectively, in coalition with PVEM. See footnote 10.
FIGURE 6 Percentage of votes obtained by the party that won the most congressional districts, 1991-2018
Even though the average percentage of the vote obtained by Morena in the districts it won in 2018 is the third “smallest” in the last ten federal deputies’ elections, it is important to remember two elements. First, in 2018 Morena obtained the highest percentage of votes in 224 districts, the largest number since 1994. Second, Morena won these districts with the biggest average margin obtained by a political party in the last eight legislative elections. The most similar historical benchmark was again the 1994 election when the PRI’s average percentage advantage over second place was 22.7 per cent.
The fragmentation of the party system Increased in the election ... and then it decreased
The number of parties competing in a system can be measured with the “effective number of parties” index (ENP).9 It offers an intuitive and direct measure of the strength of the parties and how many seats they have. Figure 7 offers two ENP metrics for the 1991-2018 period: the first based on the proportion of votes obtained by each party or coalition in ten elections of the period10 and the second based on the proportion of seats obtained by each party at the beginning of each of the lower chamber’s legislatures.11

The gray line in the graph shows the electoral ENP’s sustained growth between 1991 and 2015, a period where it went from 2.38 to 5.56. However, in the 2018 election (consistent with the results presented), this number was reduced to 4.35, a slightly higher value than in 2012. The blue line illustrates that between 1991 and the first measurement of 2018, the legislative ENP grew almost continuously, going from 2.2 to 4.69 in the 27 years analyzed. Unlike the electoral ENP, the graph includes four measurements of the legislative ENP in 2018 because, in a process that was completely atypical for Mexico (and probably for any other democratic country), it was reduced by more than 30 per cent in less than 15 days and —more importantly— without any election at all.12
In August 2018, the electoral authority allocated the final number of federal deputies by party. At that moment, the legislative ENP was at its highest point in Mexico’s recent history (with 4.69), which represented both the continuity of the trend in previous elections and the consolidation of the pluralism that has been built up in recent decades. The situation changed radically just six days later (August 29). When the time came to formally integrate the parliamentary groups, just before the inaugural session of the LXIV legislature of the Chamber of Deputies, 25 and 32 deputies elected under the emblems of the PES and the PT, respectively, resigned from those parties and joined Morena’s parliamentary group. These legislator migrations reduced 26.9 per cent of the legislative ENP in this second moment (it went from 4.69 to 3.43 per cent).
The legislative ENP continued to drop in the following days due to the addition of five deputies from the PVEM (04/09/2018) and four more deputies from the PT (09/05/2018) to the Morena parliamentary group. This atypical process suggests that the presence of “grasshopper politicians” (“polítios chapulín”) and the use of “taxi parties” were part of a strategy to maximize electoral results by avoiding the legislative overrepresentation penalty that this majority coalition would have entailed. The last included value of the legislative ENP in Figure 7 (3.25) is the lowest one recorded since 2012, which accounts for the re-concentration of political forces around Morena after the election. It also reveals a very successful candidacy selection strategy in which members or candidates close to Morena used other parties to win their seats.
The nationalization of the vote
The nationalization of electoral support for parties has been extensively studied in comparative politics, and various measures have been developed which can determine the territorial distribution of support. Since parties do not receive the same level of support from all districts, reviewing the origin of the vote allows a better understanding of the political strategies that parties can develop. This research uses the nationalization index created by Jones and Mainwaring (2003),13 with data from the federal deputies’ election by plurality voting, and aggregated at the district level for the 2009, 2012, 2015 and 2018 elections.14
The results presented in Figure 8 show that, in 2018, Morena became the most nationalized party, based on the territorial distribution of support. Morena’s nationalization increased between 2015 and 2018, going from 0.61 to 0.79, respectively; this represents an expansion of approximately 30 per cent. It also implies that, unlike previous elections, the PRI was not the most nationalized party (0.77).
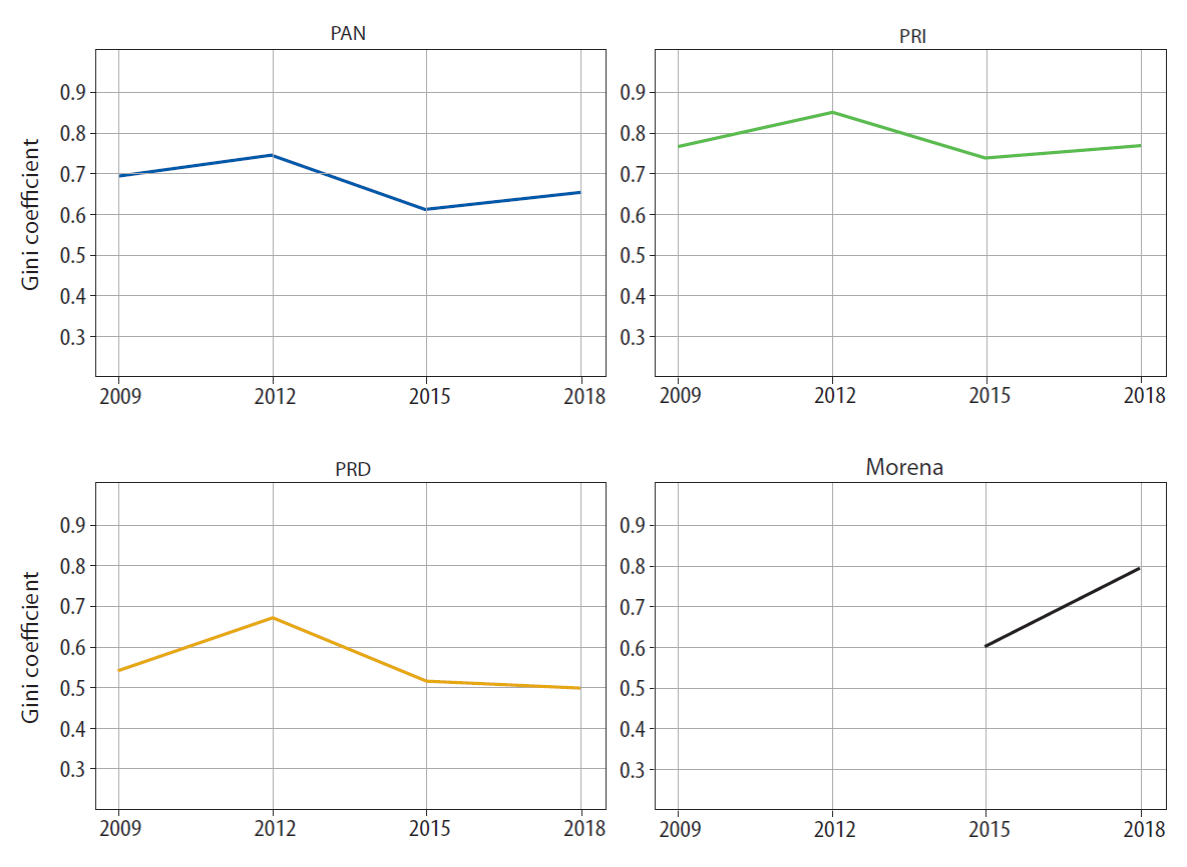
Source: Own elaboration based on official data. *Calculated as 1-Gini coefficient.
FIGURE 8 Nationalization level for each of the main political parties at the federal level, 2009-2018*
Adding to the results presented in other studies (such as that of Jones and Mainwaring, 2003), the level of nationalization of the four Mexican parties is higher in elections that are held simultaneously, in which both president and federal deputies are elected at the same time (2012 and 2018) than those elections carried out separately. This data is consistent with the assumption that presidential elections have a carryover effect on legislative elections (multilevel effect).
Mexican citizens changed (for the most part) their vote
The change in electoral preferences is measured with an indicator of whether citizens vote for the same party or change their preferences between elections. Volatility can be measured at the individual level (with voter surveys) or at the aggregate level (with the electoral results that parties obtain in two —or more— given elections). Although there are various formulas to calculate it, this research uses Pedersen’s formula (1983). 15Various papers have used it to describe the degree of the stability of voters’ support to the party system and, along with other criteria, they have created the idea that volatility is linked to the institutionalization of the party system and democratic governance (Torcal, 2015; Mainwaring and Torcal, 2005; Mainwaring and Scully, 1995). In this sense, a high level of electoral volatility can reveal the presence of “critical elections” with intense electoral realignments (Key, 1955) as well as representation problems between politicians and voters (Torcal, 2015).
Figure 9 shows that in the case of the federal deputies’ elections held between 2009 and 2018, the aggregate electoral volatility almost doubled from one election to the next, going from 9.65 in the 2009-2012 period to 31.39 in the 2015-2018 period. This result is very interesting given that Mexico went from having similar levels of electoral volatility as countries like Honduras,16 towards the group of party systems with medium volatility such as Nicaragua or Bolivia in a similar period (Freidenberg, 2016). These changes at the demand level of the system are precisely what has generated the transformation in the legislative force of partisan supply.

Conclusions: Morena and its effects on the party system
With the same rules of the game under which competition had taken place in previous elections, the result of the 2018 election revealed the massive reorientation of the electorate, generating a “tsunami” in the power distribution of the Mexican political system. These changes in the electorate were reflected in the configuration of forces within the party system. As in other Latin American party systems during the 1990s and 2000s, where the parties lost their support, and their party systems collapsed,17 with this election Mexico experienced a dramatic transformation in the electoral support that traditional parties had historically obtained, that is, the parties that had competed in the system since the process of political liberalization.18 This election revealed a shift in electoral support from the parties that always competed and won to a recently created political force.
This election has revealed transformations in the structure and dynamics of competition in the Mexican party system at the federal level. This research presents data that shows the meaning of these changes in each of the key dimensions of analysis. Regarding the structure of the competition, the changes altered the orientation of the vote (strengthening one party: Morena), giving the Executive the support of the majority in Congress, who also won in all geographic units —voting booths, precincts, districts, states. The transformations in structural elements of competition are also evident in the reduction of the party supply fragmentation (with a decrease in the ENP) and an increase in the level of Morena’s nationalization.
Structural changes are also reflected in the dynamics of competition, that is, in party interactions. The reorientation of citizen support towards Morena has transformed the cooperation dynamics among the Executive-Legislative, generating the first unified government since 1994 and returning to the old unified or “party government” dynamic in which the president has enough support due to the majority he/she has in both chambers to turn his/her public policy proposals into law. Notably, one of the critical elements of this election has been the carryover effect of the presidential election on the legislative one. This dynamic led to the creation of a unified government, with disciplined legislative majorities under the ruling party, thus facilitating the process of law-making.
Although the change has been substantial from 2012 to 2018, the fact that it is only one election limits the possibility of identifying these elections as critical. To be able to establish if this change lasts, it is necessary to wait for the next presidential elections. The evaluation of an upcoming presidential election, compared to 2018, will enable the depth and timing of this change to be established.
REFERENCES
Alarcón Olguín Víctor , y Juan Reyes del Campillo (2016), “El sistema de partidos mexicano: ¿Una Historia sin fin?”, en Flavia Freidenberg (ed.), Los sistemas de partidos de América Latina (1978-2015), Ciudad de México: Instituto Nacional Electoral/Universidad Nacional Autónoma de México-Instituto de Investigaciones Jurídicas. [ Links ]
Alcántara Sáez, Manuel y Flavia Freidenberg (2006), “El proceso político en perspectiva comparada”, en Ludolfo Paramio, Manuel Alcántara Sáez, Flavia Freidenberg y José Déniz, Reformas económicas y consolidación democrática, Colección Historia Contemporánea de América Latina, volumen VI “1980-2006”, Madrid: Editorial Síntesis, pp. 85-150. [ Links ]
Aldrich, John (1995), Why Parties? The origin and Transformation of Political Parties in America, Chicago y Londres: The University of Chicago Press. [ Links ]
Anduiza, Eva y Agustí Bosch (2004), Comportamiento político y electoral, Madrid: Ariel. [ Links ]
Bartolini, Stefano (1986), “Partidos políticos y sistemas de partidos”, en Gianfranco Pasquino (ed.), Manual de ciencia política, Madrid: Alianza, pp. 217-264. [ Links ]
Cantú, Francisco y Verónica Hoyo (2017), “México 2016: El declive de la confianza institucional”, Revista de Ciencia Política, 37(2), pp. 493-518. [ Links ]
Caramani, Daniele (2008), “Party Systems”, en Daniele Caramani (ed.), Comparative Politics, Nueva York: Oxford University Press, pp. 319-347. [ Links ]
Dietz, Henry y David Myers (2007), “From Thaw to Deluge: Party System Collapse in Venezuela and Peru”, Latin American Politics & Society, 49(2), pp. 59-86. [ Links ]
Freidenberg, Flavia (2016) (ed.), Los sistemas de partidos de América Latina (1978-2015), Ciudad de México: Instituto Nacional Electoral/Universidad Nacional Autónoma de México-Instituto de Investigaciones Jurídicas. [ Links ]
Freidenberg, Flavia y Javier Aparicio (2016), “México 2015: Entre la fragmentación partidista y el descontento ciudadano”, Revista de Ciencia Política (Santiago), 36(1), pp. 219-238. [ Links ]
Freidenberg, Flavia y Julieta Suárez Cao (2014), Territorio y Poder: Nuevos actores y competencia política en los sistemas de partidos multinivel en América Latina, Salamanca… Ediciones Universidad de Salamanca. [ Links ]
Garrido de Sierra, Sebastián (2019), La reforma definitiva. ¿Por qué y cómo la reforma electoral de 1996 precipitó la caída del régimen de partido dominante encabezado por el PRI?, Ciudad de México: CIDE. [ Links ]
Greene, Kenneth (2007), Why Dominant Party Loose: Mexico’s Democratization in Comparative Perspective, Cambridge: Cambridge University Press. [ Links ]
Greene, Kenneth y Mariano Sánchez-Talanquer (2018), “Authoritarian Legacies and Parties System Stability in Mexico”, en Scott Mainwaring (ed.), Party Systems in Latin America: Institutionalization, Decay and Collapse, Cambridge: Cambridge University Press, pp. 201-226. [ Links ]
INE (Instituto Nacional Electoral) (2018a), “Calendario Electoral 2018”, Ciudad de México: ine, disponible en: https://www.ine.mx/wp-content/uploads/2018/02/Mapa-electoral-2018.pdf [fecha de consulta: 2 de marzo de 2019]. [ Links ]
INE (Instituto Nacional Electoral) (2018b), Material de divulgación sobre el proceso electoral 2017-2018, Ciudad de México: INE. [ Links ]
Harrop, Martin y William Miller (1987), Elections and Voters: A Comparative Introduction, Hampshire: Macmillan. [ Links ]
Hernández Huerta, Víctor (2020), “Asesinatos políticos en México y presencia de organizaciones criminales”, en este número de Política y Gobierno. [ Links ]
Key, Valdimer Orlando (1955), “A Theory of Critical Elections”, Journal of Politics, 17(1), pp. 3-18. [ Links ]
Jones, Mark P. y Scott Mainwaring (2003), “The Nationalization of Parties and Party Systems: An Empirical Measure and an Application to the Americas”, Party Politics, 9(2), pp. 139-166. [ Links ]
Laakso, Markku y Rein Taagepera (1979), “Effective” Number of Parties: A Measure with Application to West Europe”, Comparative Political Studies, 12(1), pp. 3-27. [ Links ]
Latinobarómetro (2018), Informe Latinobarómetro, disponible en: http://www.latinobarome-tro.org/latNewsShowMore.jsp?evYEAR=2018&evMONTH=-1 [fecha de consulta: 10 de marzo de 2019]. [ Links ]
Langston, Joy (2017), Democratization and Authoritarian Party Survival: Mexico’s PRI, Nueva York: Oxford University Press. [ Links ]
Magaloni, Beatriz (2006), Voting to Autocracy Hegemonic Party Survival and Its Demise in Mexico, Nueva York: Cambridge University Press. [ Links ]
Mainwaring, Scott y Mariano Torcal (2005), “La institucionalización de los sistemas de partidos y la teoría del sistema partidista después de la tercera ola democratizadora”, América Latina Hoy, 41, 141-173. [ Links ]
Mainwaring, Scott y Timothy Scully (1995), Building Democratic Institutions: Party Systems in Latin America, Stanford: Stanford University Press. [ Links ]
Mair, Peter (1990), “Parameters of Change”, en Peter Mair (ed.), The West European Party System, Nueva York: Oxford University Press, pp. 208-217. [ Links ]
Méndez de Hoyos, Irma (2003), “Competencia y competitividad electoral en México, 1977-1997”, Política y Gobierno, X(1), pp. 139-182. [ Links ]
Molinar Horcasitas, Juan y Jeffrey Weldon (2014), “Elecciones de 1988 en México: Crisis del autoritarismo”, Revista Mexicana de Opinión Pública, 17, pp. 165-192. [ Links ]
Palma Cabrera, Esperanza (2010), “México: Entre la violencia y la consolidación del siste- ma de partidos”, Revista de Ciencia Política, 30(2), pp. 379-396. [ Links ]
Pedersen, Morgens (1983), “Changing Patterns of Electoral Volatility in European Party Systems, 1948-1977”, en Hans Daadler y Peter Mair (eds), Western European Party Sys- tems: Continuity and Change, Londres: Sage Publications. [ Links ]
Robles, Edwin Atilano y Allyson Lucinda Benton (2018), “México 2017: El gobierno en desventaja rumbo al 2018”, Revista de Ciencia Política, 38(2), pp. 303-333. [ Links ]
Rokkan, Stein (1970), Citizens, Elections, Parties: Approaches to the Comparative Study of the Processes of Development, Nueva York: David McKay. [ Links ]
Sartori, Giovanni (1976), Partidos y sistemas de partidos, Madrid: Alianza. [ Links ]
Sartori, Giovanni (1992), Partidos y sistemas de partidos, Madrid: Alianza. [ Links ]
Schattschneider, Elmer E. (1942), Party Government, Nueva York: Rinehart. [Schattschneider, Elmer E. (1964), Régimen de partidos, Madrid: Editorial Tecnos.] [ Links ]
Torcal, Mariano (ed.) (2015), Sistemas de partidos de América Latina, Madrid: Antrophos Editorial. [ Links ]
Torreblanca, Carolina, Mariano Muñoz y José Merino (2018), “¿Cómo ganó AMLO? Breve historia gráfica de la migración electoral más grande de la historia democrática de México”, Nexos, julio, disponible en: https://parentesis.nexos.com.mx/?p=450 [fecha de consulta: 14 de abril de 2019, 15:00 hrs.]. [ Links ]
Trejo, Guillermo y Sandra Ley (2015), “Municipios bajo fuego”, Nexos, febrero, disponible en: http://www.nexos.com.mx/?p=24024 [fecha de consulta: 30 de mayo de 2019: 20:00 hrs.]. [ Links ]
1That day, Mexicans elected the president of the Republic, 500 federal deputies and 128 senators. Additionally, in nine states, the governor (or Head of Government) was elected, in 27 entities the local congresses were renewed as well as in 25 town halls (or “alcaldías”). In total, 3 206 positions were elected at the federal, state, and municipal levels (INE. 2018a). The only two entities that did not hold any sort of local election were Baja California and Nayarit.
2Parties are “the political groups that participate in the elections to make their members access positions of popular representation, compete and cooperate to maximize their power options” (Sartori, 1992: 90).
3Distrust towards the government and political parties was very high in Mexico during 2018. According to data from Latinobarómetro (2018), only 11 per cent of Mexicans trusted political parties, while 16 per cent had confidence in the government. In 2006, confidence had registered levels close to 30 per cent for parties and 47 per cent for the government, according to existing data from the same Latino-barómetro, which shows the growing political distrust in recent years.
4The comparisons begin in these years because they were the first legislative and presidential elections, respectively, organized by the Federal Electoral Institute (IFE), now the National Electoral Institute (INE). As will be seen later, even though the electoral competition was not yet fair in 1994, we decided to start the comparison of the presidential elections this year because the results of that election are the most similar reference to that of 2018.
5The Etellekt Consultancy Firm indicator of political violence registered 774 attacks against politicians and 429 against officials for the 2017-2018 electoral process. Of these numbers, 152 politicians and 371 officials were killed (523 in total). Of the 152 politicians who lost their lives in attacks, 48 were pre-candidates and candidates for elected office. See Seventh Report on Political Violence in Mexico, published on the Etellekt Portal, Available at: http://www.etellekt.com/reporte/septimo-informe-de-violencia-politica-en-mexico.html [accesed on: April 9, 2019].
6Both in Figure 1 and 4, we present descriptive statistics with different levels of aggregation. The purpose of this is to emphasize that the high percentage of votes obtained by López Obrador was not due to a particularly good performance in some areas of the country —in contrast to a second or third place in other regions—, but instead to consistently good results in the most of the national territory.
7Each of the five density charts only includes the margin of victory data of the voting booths where the respective presidential candidate won.
8This article focuses on the analysis of the results of the election of federal deputies elected by plurality vote. Due to the nature of the Mexican electoral system, it is highly feasible that these results are very similar to the results of the election of deputies elected by proportional representation.
9The formula to calculate the Effective Number of Matches proposed by Laakso and Taagepera (1979) is as follows:
10During the period 1991-2006, the Mexican electoral law established that the votes cast in favor of a coalition had to be registered in favor of the entire coalition. Subsequently, the votes were divided among the political parties based on the percentages predefined in their coalition agreements. Since the 2007-2008 electoral reform, votes can only be cast and counted in favor of political parties. If there is a coalition, the votes obtained by the parties that comprise it are added in the next stage. For this reason, while the ENP for the period 2009-2018 was calculated based on the number of votes for each political party, the previous figures were calculated considering the number of votes obtained by each party and/ or coalition. In 2003 the PRI competed independently in the districts of 21 states and in coalition with the PVEM in the districts of the remaining 11 entities. Given that the PRI was by far the leading political force in the coalition, in calculating this year’s electoral ENP we consider the votes of the PRI and its coalition with the PVEM as those of a single political force. The code with which the calculations were made includes more details.
11In this investigation, we use the data of the Lower Chamber because they offer more frequent measurements (13) than those of the Senate (7) for the same period. When calculating the ENP, the total number of seats obtained by each political party represented in the Chamber of Deputies was considered, regardless of whether they were elected by a plurality voting or proportional representation.
12The first measurement of the legislative ENP for 2018 corresponds to the moment in which the INE assigned the proportional representation seats (August 23).
13Jones and Mainwaring (2003: 142) use the Gini coefficient in an inverse way to measure nationalization. We inverted the coefficient (1-Gini), so the higher the score, the better the spatial distribution of the vote. The index should be read from 0 to 1.
15Aggregate electoral volatility (AEV) can be calculated from the Pedersen index (1983):
16Among its political parties, between 1981 and 2005, Honduras experienced just 7 percentage points of aggregate electoral volatility at the legislative level, while Nicaragua had 29.7 (1984-2001) and Bolivia about 30.42 percentage points (1985-2005) (Alcántara and Freidenberg, 2006).
17“Party system collapse” is understood as the moment in which a party loses at least 50 per cent of its votes from one election to another (Dietz and Myers, 2007). Various studies have shown how party systems have collapsed in Latin America, see the chapters in Freidenberg (2016), and Freidenberg and Suárez Cao (2014).
18A discussion on the definition of traditional parties can be found in Freidenberg y Suárez Cao (2014).
Received: June 14, 2019; Accepted: April 07, 2020
 Este es un artículo publicado en acceso abierto bajo una licencia
Creative Commons
Este es un artículo publicado en acceso abierto bajo una licencia
Creative Commons
