


 nueva página del texto (beta)
 Inglés (pdf)
 Artículo en XML
 Referencias del artículo
 Enviar artículo por email
 Citado por SciELO
  Similares en
SciELO
Similares en
SciELO 
 Permalink
Introduction
Tilapia production has increased considerably world- wide, with a production of 6.5 million tons by 2019 (Tveteras et al., 2020). Currently, consumers have widely accepted the consumption of these freshwater fish. Not only are these fish considered an excellent food source, but they also represent great potential as an income source, leading commercialization in the national and international markets (Fitzsimmons, 2016).
Today, there is a growing consumer demand to purchase fish products with the highest freshness and quality possible. For this reason, quality and safety are of great interest to processing industries and authorities dedicated to food sanitary control (Fitzsimmons, 2016).
In general, fish products begin to lose their freshness immediately after capture or harvest. It is known that the loss of freshness and the fish pattern of spoilage varies significantly from species to species. Once the fish dies, several postmortem changes occur. Post-harvest handling practices strongly influence these changes in fish muscle. These postmortem changes, which directly and strongly affect the quality and shelf life of fish products, are associated with protein and ATP degradation, a drop in pH, lipid oxidation, production of undesirable compounds such as trimethylamine nitrogen (TMA-N) and low weight molecular volatile bases (TVB-N), which are produced by bacterial action. Likewise, the muscle changes its texture, water retention capacity, and color (Alasalvar et al., 2002; Cheng et al., 2013). The methods to evaluate the freshness and quality of different fish species measure postmortem changes associated with sensory, chemical and physical changes and microbiological growth (Cheng et al., 2013).
The literature describes that a series of antemortem and postmortem factors influences the quality of fish products, among which are: species, initial composition, size, physiological condition, feeding, method of capture, environmental temperature, storage temperature, among others (Sikorski et al., 1990).
On the other hand, one of the most used methods to evaluate muscle quality in fish products is the degradation of ATP to ADP AMP IMP HxR Hx. Concentrations of these products during storage have been used as biochemical indicators of freshness and deterioration (Saito et al., 1959). In addition, different reports on the postmortem factors states that storage temperature has more impact on the biochemical changes and the quality and shelf life of the fish species. Therefore, this study evaluated the effect that storage temperature (0 °C and 5 °C) exerts on the quality and shelf life of tilapia (Oreochromis niloticus) muscle.
Materials And Methods
Collection and sampling
This study used tilapia organisms obtained directly from the cultivation site located at the El Novillo dam in Sonora, Mexico. Specimens with an average weight and length of 961.00 ± 0.15 g and 33.60 ± 1.69 cm, respectively, were sacrificed by thermal shock in a container with water and ice. Once slaughtered, they were frozen in alternating beds of ice-fish-ice inside a hermetic cooler for transportation to the Food Research Laboratory of the Universidad de Sonora. The time between post-harvest and the arrival of the organisms at the university facilities did not exceed 3 hours. Once in the laboratory, the organisms were manually filleted, these were packed in polyethylene bags and stored for 20 days at 0 °C and 5 °C. Subsequently, at 0, 2, 5, 8, 11, 14, 17 and 20 days, fillet samples were taken to monitor the behavior of ATP and related compounds, K value, pH, color, texture, WHC, TVB-N and count of mesophilic microorganisms. Except for the me- sophilic microbial count where the sample consisted of three fresh fillets, the rest of the analyses had six fresh fillets taken at each sampling day. In the case of ATP and degradation products determinations, part of the fillets was frozen and stored at -80 °C until the moment of analysis.
ATP, related compounds and K value
Determinations of nucleotides and related compounds were carried out by a Reversed-Phase High-Performance Liquid Chromatography procedure (Ryder, 1985). The identification of nucleotides, nucleosides and bases were made by comparing their retention times with those of commercially obtained standards and by the addition or spiking of standards. The K value was calculated as the percentage rate of HxR and Hx to the sum of ATP and degradation products as follows:
%K=[HxR+Hx) / (ATP+ADP+AMP+IMP+HxR+Hx)] x 100
Where: ATP = adenosine-5’-triphosphate, ADP = adenosine-5’-diphosphate, AMP = adenosine-5’-mono- phosphate, IMP = inosine-5’-monophosphate, HxR = inosine and Hx = hypoxanthine
TVB-N and pH
The determination of TVB-N was determined by previously described methods (Woyewoda et al., 1986), with a technique based on the distillation of these compounds and the results obtained expressed as mg of TVB-N/100 g. The pH determination was done according to the method recommended by Woyewoda et al. (1986).
Texture
The shear test was used to evaluate texture in tilapia muscle using a Warner-Bratzler blade in a universal testing machine (Model 1130, Instron Corp., Canton, MA) equipped with a 50-kg cell. The speed was set at 20 cm/min, with a shear force transversally applied in the direction of the muscle fibers, using standardized cuts (10×10×20 mm) and recording the necessary force (N) to shear the muscle.
WHC
Water-holding capacity was measured using a standard methodology (Cheng et al., 1979) and expressed as a “loss of water,” which was the percentage of weight loss by the sample compared to the initial weight.
Color
Color changes in the tilapia muscle were determined using the standard methodology of the International Commission on Illumination (CIE, 1978) with a tristimulus colorimeter (Model CR-300, Minolta Co., New York, NY). Measurements were taken on the surface of the muscle.
Total count of mesophilic microorganisms
The total count determination of mesophilic aerobic microorganisms was according to the methodology described by the Official Mexican Standard (NOM-092-SSA1-1994) (1994) for the count of aerobic microorganisms on plate. To this end, 10 g of fish muscle were homogenized and later a series of decimal dilutions were prepared, which were inoculated (1 mL) in plate count agar (PCA), making a triplicate of each dilution. The total mesophilic count was expressed as the log of colony-forming units (CFU) per gram of muscle.
Statistical analysis
Analyses were performed with the NCSS 2000 statistics software (NCSS, Kaysville, UT), applying descriptive statistics (mean and standard deviation), one-way ANOVA and linear regression analysis. The level of significance was set at 5 %. Six repetitions of each determination were made, except for the microbiological analysis, which used an n=3, where each organism and fillet was considered an experimental unit. For the determination of the K value, a linear regression analysis was performed, which resulted in the prediction equation for the freshness index.
Results And Discussion
Behavior of ATP and related compounds
In the muscle of vertebrate organisms, ATP is enzy- matically degraded to ADP → AMP → IMP → HxR → Hx. Concentrations of these products during storage have been used as biochemical indicators of freshness and deterioration (Saito et al., 1959). This study found initial ATP, ADP, AMP, IMP, Hx and HxR values of 0.26 ± 0.01, 0.24 ± 0.02, 0.17 ± 0.02, 6.00 ± 0.29, 0.25 ± 0.06 and 0.01 ± 0.01 µmol/g, respectively (Figure 1). IMP was the most abundant compound at the beginning, which coincides with Batista et al. (2004), who reported ~7.0 µmol/g IMP, in the matrinxã (Brycon cephalus) muscle. In response to storage temperature, ATP and ADP concentrations did not change (P ≥ 0.05), while those of AMP, IMP, HxR and Hx, did (P < 0.05). The degradation rate of ATP and degradation products was higher at 5 °C. On the other hand, concerning storage time, the ATP and IMP content decreased (P < 0.05), while the Hx concentration increased (P < 0.05) to 1.58 ± 0.33 and 2.23 ± 0.32 µmol/g at 0 °C and 5 °C, respectively, after 20 days of storage. The obtained Hx concentrations are lower than those reported by Tomé et al. (2000), who found a value of 5.2 µmol/g of Hx in tilapia (Oreochromis niloticus) muscle stored at 0 °C.

Figure 1 ATP and related degradation compounds until hypoxantine in tilapia
(Oreochromis niloticus) muscle stored at a) 0
ºC and b) 5 ºC for 20 days. ATP = adenosine 5(-triphosphate, ADP =
adenosine 5(-diphosphate, AMP = adenosine 5(-mophosphate, IMP =
Inosine 5(-mophosphate, HxR = Inosine and Hx = Hypoxantine. Data
points are the mean of n = 6 for each sampling. Bars represent the
standard deviation.
Figura 1. ATP y productos de degradación hasta
hipoxantina en músculo de tilapia (Oreochromis niloticus) almacenado
a) 0 ºC y b) 5 ºC por 20 días. ATP = adenosina 5′-trifosfato, ADP =
adenosina 5′-difosfato, AMP = adenosina 5′-monofosfato, IMP =
inosina 5′-monofosfato, HxR = inosina e Hx = hipoxantina. Los datos
son la media de n = 6. Las barras representan la desviación
estándar.
In this study, the compounds that presented the most change were IMP and Hx. For IMP at both temperatures, a linear decrease (P < 0.05) was obtained with respect to storage time (Y = -0.79 x + 8.24, R² = 0.93; and Y = -0.66x + 7.31, R² = 0.98, for 0 °C and 5 °C, respectively). On the other hand, Hx accumulated linearly with storage time (P < 0.05) (Y = 0.19 x + 0.10 R² = 0.97; and Y = 0.26 x + 0.20, R² = 0.96, for 0 °C and 5 °C, respectively). Using these prediction equations, IMP and Hx could be used as indicators of loss of freshness, since the proportion of their changes correlates parallelly with the loss of muscle freshness during storage.
K value
The K value is one of the most widely used biochemical methods for assessing the freshness products of aquatic origin, as it provides a high correlation between loss of freshness and sensory quality with respect to storage time (Saito et al., 1959; Ryder, 1985; Lowe et al., 1993). Figure 2 shows an initial K value of 2.82 ± 0.4 %. This result is similar to those described by Ocaño-Higuera et al. (2011) and Jiménez-Ruiz et al. (2019), who reported initial values of 5 % and 3.4 % in stingray (Dasyatis brevis) and tilapia (Oreochromis niloticus) muscle stored in ice, respectively.

Figure 2 K value in tilapia (Oreochromis niloticus) muscle stored at 0 and 5
ºC for 20 days. Data points are the mean of n = 6 for each sampling.
Bars represent standard deviation.
Figura 2.
Índice K en músculo de tilapia (Oreochromis niloticus) almacenado a
0 y 5 ºC por 20 días. Los datos son la media de n = 6. Las barras
representan la desviación estándar.
Regarding the storage temperature, a more significant increase (P < 0.05) was present in the K value percentage at 5 °C. This increase coincided with the higher hydrolysis rate of ATP and the consequent increase in the concentration of Hx at that same temperature. At the end of storage, this study found K value of 39.5 ± 2.6 % and 47.2 ± 2.9 % for 0 °C and 5 °C, respectively. These values are lower than those reported by Özoğul et al. (2006), Bosco et al. (2010), Liu et al. (2010) and Jiménez-Ruiz et al. (2019), who reported final K values of 90 %, 58 %, ~72 % and ~60 % in turbot (Scophthalmus maximus), medregal (Seriola dumerili), tilapia (Oreochromis niloticus) and tilapia (Oreochromis niloticus) muscle at 19, 15, 17 and 19 days of ice storage, respectively. Figure 2 shows that the K value presented a linear behavior (P < 0.05) with respect to storage time: (Y= 1.85 x + 0.73, R2 = 0.98; and Y= 1.97 x + 6.76 R2 = 0.96) for 0 °C and 5 °C, respectively. With the above prediction equations, the K value could be used as an indicator to assess freshness in tilapia muscle.
The results obtained from the K value, demonstrate that by storing the tilapia muscle at a 0 °C, results in greater freshness, which implies that the product can be preserved with good quality for a longer period.
pH and TVB-N
Batista et al. (2004), Özcan et al. (2011) and Jiménez- Ruiz et al. (2019) indicated that pH determination during storage is a good indicator of muscle quality in marine organisms. Figure 3 illustrates that the initial pH value in tilapia muscle was 6.77 ± 0.03, which decreased significantly (P < 0.05) after five days after storage, to values of 6.62 ± 0.07 and 6.58 ± 0.08, for 0 °C and 5 °C, respectively. The speed and degree of muscular pH decrease is due to the accumulation of lactic acid and its dissociation under postmortem anaero-bic conditions, which in turn is a function of the amount of glycogen in the muscle (Tomé et al. 2000; Batista et al. 2004; Durán et al. 2008), the species (Durán et al. 2008), and the levels of activity or stress generated during capture, as well as the type of muscle (Ocaño-Higuera et al. 2009).

Figure 3 Changes in pH and TVB-N in tilapia (Oreochromis niloticus) muscle
stored at 0 and 5 °C during 20 days. Data points are the mean of n =
6 for each sampling. Bars represent standard deviation.
Figura 3. Cambios de pH y BVT-N en músculo
de tilapia (Oreochromis niloticus) almacenado a 0 y 5 ºC por 20
días. Los datos son la media de n = 6. Las barras representan la
desviación estándar.
The pH values at the end of storage increased (P < 0.05) to 6.86 ± 0.05 and 6.93 ± 0.02 for 0 °C and 5 °C, respectively. The increase in pH during storage has been associated with the formation of volatile compounds such as ammonia and certain amines produced by autolytic route, as well as by bacterial action on free amino acids (Liu et al. 2010; Günşen et al., 2011). This study found no significant differences in pH behavior (P ≥ 0.05) concerning storage temperature.
On the other hand, the determination of TVB-N is one of the most commonly used tests to measure the deterioration of fish products. Figure 3 illustrates an initial TVB-N value of 26.2 ± 1.6 mg N/100 g, greater than the 10.2 and 6.5 mg N/100 g described by Pankyamma et al. (2020) and Liu et al. (2010), respectively, for tilapia (Oreochromis niloticus) muscle.
Regarding storage time, a significant increase in TVB-N values was present until reaching 32.2 ± 1.6 and 36.5 ± 1.5 mg N/100 g at 0 °C and 5 °C, respectively, at the end of storage. In the case of fish products, the maximum established value allowed for a product suitable for human consumption is 30 mg N/100 g of muscle (Gökodlu et al. 1998), a value obtained in this study at 17 (0 °C) and 8 (5 °C) days. It is important to emphasize that for these days of storage, both the pH values and the microbial load increased. Therefore, the TVB-N content increased due to the growth of deteriorating microorganisms, which are capable of generating volatile compounds characteristic deterioration.
The TVB-N content exhibited significant differences (P< 0.05) at the storage temperatures evaluated, being greater at 5 °C, which agrees with the increase of the total count of microorganisms reached at this same temperature. It has also been described that the increase in TVB-N content can be related to species, food, temperature, and in general, to post-capture handling and storage conditions (Durán et al. 2008; Ocaño-Higuera et al. 2009; Liu et al. 2010).
Texture and WHC
The literature reports that during storage, fishery products present a loss of texture (Sato et al. 1991). In this study, the texture evaluated by cutting effort decreased (P < 0.05) with storage time, from an initial value of 6.52 ± 0.22 N to final values of 2.6 ± 0.3 and 2.4 ± 0.5 N at 0 °C and 5 °C, respectively (Figure 4). These values are superior to those reported by Liu et al. (2010), who obtained a value of 0.29 N in tilapia (Oreochromis niloticus) muscle after 17 days of storage at 0 °C. The decrease can be attributed to autolytic degradation (Huss, 1998). Durán et al. (2008), Liu et al. (2010) and Jiménez-Ruiz et al. (2019), reported autolytic degradation caused by the action of endogenous proteases on the integrity of myofibrillary proteins, especially cathepsins, calpains, and hydrolytic enzymes such as elastases and collagenases. These enzymes, in turn, cause modifications in structural and functional characteristics such as the reduction of WHC (Delbarre et al., 2006). Moreover, various factors observed in the postmortem stage affect the texture, such as glycolysis, rigor mortis, lower pH, and storage temperature, among others (Hyldig and Nielsen, 2001). In this study, the texture was not affected (P ≥ 0.05) by the storage temperature.

Figure 4 Changes in texture (shear force) and water holding capacity (WHC) in tilapia
(Oreochromis niloticus) muscle stored at 0 and
5 °C for 20 days. Data points are the mean of n = 6 for each
sampling. Bars represent standard deviation.
Figura 4. Cambios de textura (fuerza al corte) y
capacidad de retención de agua (CRA) en músculo de tilapia
(Oreochromis niloticus) almacenado a 0 y 5 ºC por 20 días. Los datos
son la media de n = 6. Las barras representan la desviación
estándar.
Water holding capacity is a fundamental property when assessing muscle quality (Ocaño-Higuera et al., 2009). Figure 4 illustrates that the WHC decreased (P < 0.05) from an initial value of 95.3 ± 0.4 to values of 85.5 ± 0.6 % and 87.1 ± 0.9 % for 0 °C and 5 °C, respectively, on the 20th day of storage. However, it was not significantly affected (P ≥ 0.05) by the storage temperature. These changes in WHC can be associated with pH and texture changes in fillets during storage.
Color
Color is another of the parameters used to evaluate the quality of fish products. Figure 5 show color changes as a function of L*, a*, and b* parameters during storage at 0°C and 5 °C for 20 days. It can be observed that in the case of L*, the initial value increased (P < 0.05) from 53.0 ± 1.1 to 60.0 ± 1.4 and 62.3 ± 1.5 at 0 °C and 5 °C, respectively, on the 20th day of storage. This increase may be because the muscle presented fluid loss by exudation, which produces an aqueous aspect and a greater refraction of light rays, causing an increase in luminosity. For parameter a*, an initial value of 10.1 ± 1.8 was observed. Subsequently, this value decreased (P < 0.05) to 1.6 ± 0.3 and 2.4 ± 0.8 for 0 °C and 5 °C, respectively. For parameter b*, it decreased (P < 0.05) from 10.8±0.9 to 10.5 ± 0.4 and 8.2 ± 0.6 for 0 °C and 5 °C, respectively. Of the color parameters, only L* showed changes (P < 0.05) concerning the storage temperature.
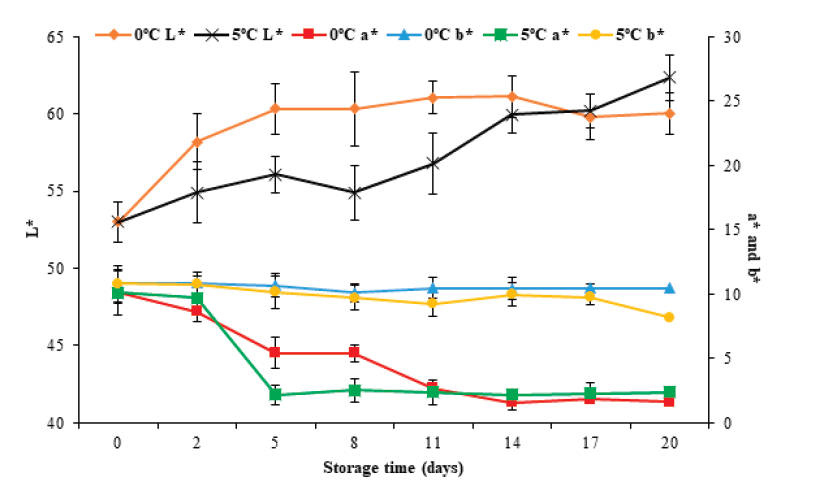
Figure 5 Color changes in tilapia (Oreochromis niloticus) muscle stored at 0
and 5 °C for 20 days. Data points are the mean of n = 6 for each
sampling. Bars represent standard deviation.
Figura 5. Cambios en el color del músculo de tilapia
(Oreochromis niloticus) almacenado a 0 y 5 ºC
por 20 días. Los datos son la media de n = 6. Las barras representan
la desviación estándar.
Total count of mesophilic microorganisms
The plate counting technique is commonly used to determine the content of viable microorganisms in food. Figure 6 illustrates that the initial mesophilic microorganism count increased (P < 0.05) from 3.54 ± 0.18 Log CFU/g to 7.3 ± 0.03 and 8.1 ± 0.03 CFU/g for 0 °C and 5 °C, respectively, with the storage temperature (P < 0.05) affecting the microbio- logical count. This increase was more evident at 5 °C, which agrees with the increases in pH, TVB-N, and Hx found for the same storage temperature.
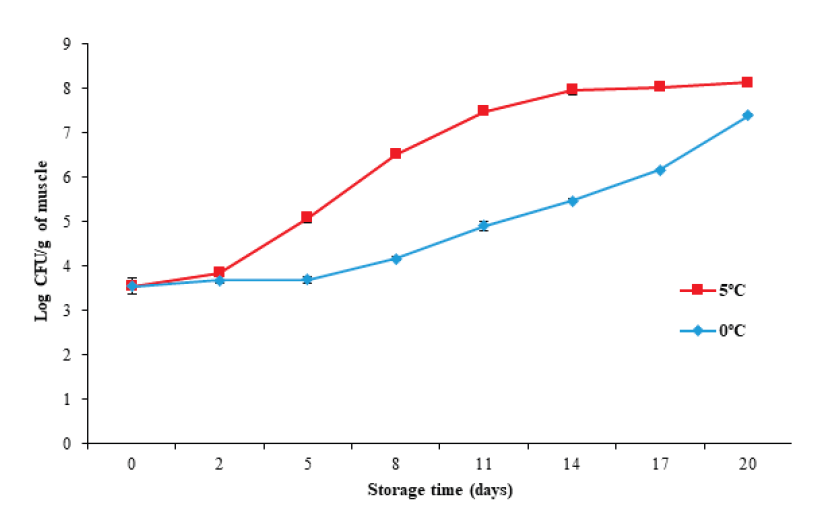
Figure 6 Changes in total count of mesophilic microorganisms in tilapia (Oreochromis
niloticus) muscle stored at 0 and 5 °C for 20 days.
Data points are the mean of n = 3 for each sampling. Bars represent
standard deviation.
Figura 6. Cambios en la cuenta total de microorganismos
mesófilos en músculo de tilapia (Oreochromis
niloticus) almacenado a 0 y 5 ºC por 20 días. Los datos
son la media de n = 3. Las barras representan la desviación
estándar.
The International Standard sets a maximum permitted value of 7 Log CFU/g of mesophilic microorganisms for fresh or chilled fish for human consumption. Based on the above recommendations, tilapia muscle has an edible quality of at least 14 days during storage at 0 °C (5.46 ± 0.04 Log CFU/g), and of at least eight days at 5 °C (6.51 ± 0.07 Log CFU/g).

