


 nueva página del texto (beta)
 Inglés (pdf)
 Artículo en XML
 Referencias del artículo
 Enviar artículo por email
 Citado por SciELO
  Similares en
SciELO
Similares en
SciELO 
 Permalink
Introduction
Mollusks aquaculture has significant economic importance worldwide and the Pacific oyster Crassostrea gigas is one of the most cultured oysters (Shumway, 1990). Recently, the research of C. gigas has been increased in topics such as immunology, genetics, genomics and hybrid tolerability (Saavedra and Bachére, 2006; Dheilly et al., 2011; Yan et al., 2017). The Pacific oyster could be exposed to bacterial, protozoan, and viral pathogens, as well as to abiotic agents such as xenobiotics, and marine toxins (Helm, 2004). Due to the stress caused by all these agents, there has been an increase in the research to study the changes of gene expression in oysters by quantitative reverse transcription polymerase chain reaction (qRT-PCR). Quantitative PCR is a sensitive, specific and reproducible method to study gene expression (Bustin et al., 2005). For relative quantification is required some reference gene as the internal control, for example, actin and tubulin, though their expression before and after a challenge has been scarcely investigated (Dheda et al., 2005). Therefore, it is necessary to obtain information about the selection of reference genes to study gene stability in different experimental conditions.
The Pfaffl method uses the Ct (2ΔΔct) to determine the gene expression level in distinct conditions considering the amplification efficiency adjustment (Pfaffl et al., 2004). An essential component of the relative quantification of gene expression is the reference gene (internal control or house-keeping gene) that is used to correct the effect of experimental fluctuations, e.g., nucleic acid concentration, instrumental errors (Bustin, 2010).
Genomic studies allow a better understanding of the cellular response and specific metabolic pathways involved in response to the ingestion of the toxic dinoflagellate cells. It was necessary to determine the stability of possible reference genes for profiling the C. gigas spat gene expression on the experimental conditions tested.
In this work, transcriptional changes of five reference genes in C. gigas fed with toxic dinoflagellates G. catenatum and P. lima compared to a non-toxic diet of I. galbana were evaluated. The expression changes of the candidate genes were analyzed by three normalization algorithms: Bestkeeper (Pfaffl et al., 2004), GeNorm (Vandesompele et al., 2002; Bustin, 2010) and NormFinder (Andersen et al., 2004). These algorithms ranked reference genes according to their stability expression. Finally, we corroborate the validation of optimal reference genes by analyzing the relative expression of two target genes, trypsin and cytochrome c oxidase I, under the experimental conditions tested in C. gigas spat stage.
Materials and methods
Microalgae culture
In this study, the planktonic dinoflagellate Gymnodinium catenatum (strain GCCV6), a producer of paralyzing shellfish toxins (PST) (Kodama, 2010) was utilized, as well as, the epibenthic dinoflagellate P. lima (strain PRL-1) a producer of diarrheic toxins (DSP) (Núñez-Vázquez et al., 2003). Strains were obtained from the CIBNOR Collection of Marine Dinoflagellates, and grown in Fernbach flasks with f/2 medium (Guillard, 1975) enriched with selenium. The culture medium was prepared using seawater (salinity 35 g L-1) filtered with 0.45 µm membrane and sterilized at 121°C, 15 lb for 15 min. Cells were kept at proliferating conditions of 22°C ± 1°C, continuous light of 150 µmol photons m-2 s-1 light intensity. For experiments, dinoflagellate cells were harvested by centrifugation (2500 x g 10 min-1) during the late exponential growth phase (19 days after inoculation), and cell density was adjusted using cell counting data on Sedgwick-Rafter slides (Microscope Olympus BX41, Tokyo, Japan) after sample fixation with Lugol´s solution (Gifford and Caron, 2000).
The microalgae I. galbana strain ISG-1 was obtained from the Live Food Laboratory at CIBNOR and used as a negative control or non-toxic diet. Cell concentrations in feeding experiments were determined by the Neubauer chamber (0.1 mm in depth) after fixation with Lugol´s solution with an optical microscope.
Oysters culture
C. gigas juvenile individuals (3 ± 1 mm, 0.022 ± 0.008 g) were obtained from the hatchery “Acuacultura Robles” at Las Botellas (Bahía Magdalena), Baja California Sur, Mexico. For acclimatization, organisms were divided into groups and kept in plastic aquariums (10 L) with aerated filtered seawater (0.22 µm) at 21°C at and 34 g L for ten days. The maintenance diet consisted of bacteria-free I. galbana (ISG-1) at 7.5 x 10⁵ cells mL-1.
Experimental design and sample collection
The number of dinoflagellate cells was calculated based on G. catenatum (Band-Schmitd et al., 2005) and P. lima (Hallegraeff, 1995) harmful algal blooms (HABs) and reports on their toxic effects. The experiments consisted of three diet treatments separated in two experimental conditions and non-toxic control diet; condition 1: oysters fed with an algal mix of P. lima (3 x 10³ cell mL-1) and I. galbana (7.5 x 10⁵ cell mL-1); condition 2: oysters fed with an algal mix of G. catenatum (3 x 10³ cell mL-1) and I. galbana (7.5 x 10⁵ cell mL-1). These diets were compared with a non-toxic control diet consisting of oysters fed with I. galbana alone (7.5 x 10⁵ cell mL-1). The experimental groups of C. gigas were distributed as described previously (García-Lagunas et al., 2013). Briefly, groups of 25 oysters (in triplicate) were maintained in 100 mL transparent polypropylene containers with a 1:1 the microalgal mixture in a final volume of 50 mL. At 7- and 14- days post- challenge, five organisms of each experimental unit were randomly sampled. The sampled organisms corresponding to each sample time were replaced on each experimental unit by oysters exposed in the same experimental conditions (mirror exposure units used for replacement only). Samples were washed with sterile seawater and finally frozen at -80°C until use.
Total RNA preparation and first-strand cDNA synthesis
Total RNA was extracted from 30 mg per the whole body of oysters spat in pools of five, with TRIzol ® Reagent (Life Technologies, Carlsbad, California) according to the manufacturers’ protocol. After homogenization, each sample was subjected to two TRIzol® extractions. The concentration and purity of RNA were determined by measuring the absorbance at 260 nm in an ND-2000 spectrophotometer (Thermo Scientific, U.S.A). The RNA integrity was analyzed on 1 % (w/v) agarose gel. To ensure complete DNA absence, a direct PCR was performed using 2 µL (100 ng) of each RNA preparation with 28S ribosomal specific primers as a non-amplified control. After each verified RNA sample, 0.5 µg was used for cDNA synthesis using the SuperScript™ III First-Strand Synthesis System SuperMix® (Life Technologies, Carlsbad, California). Total RNA was reverse-transcribed by oligo-dT, and the resulting cDNA was stored at -80°C until use. Control reactions were performed with no cDNA template or with non-reverse transcribed RNA to determine the level of background DNA contamination after DNAase I treatment. No DNA contamination was detected.
Primer design and PCR efficiency
Five reference genes, actin (act), β tubulin (β-tub), α subunit of elongation factor 1 (ef-1α), glyceraldehyde-3-phosphate dehydrogenase (gapdh), and 28S ribosomal RNA (28S rRNA) were examined for their qPCR reference potential in the gene expression study in Pacific oysters exposed to dinoflagellates. The primers used to amplify these five genes (Table 1) were designed based on C. gigas genome sequences (Genebank, http://www.ncbi.nlm.nih.gov). The primer sequences were assessed for dimer and hairpin formation using RNA fold WebServer (http://rna.tbi.univie.ac.at/cgi-bin/ RNAfold.cgi).
Table 1 Primer sequences, gene name, expected amplicon size, and efficiency corresponding to
reference genes and target gene (tryp and
coi) from Crassostrea gigas.
Tabla 1. Secuencias de oligonucleótidos, nombre
del gen, tamaño esperado del amplicón y eficiencia, correspondiente
a los genes de referencia y a los genes blanco (tryp y coi) de
Crassostrea gigas.
| Primers | Sequence 5´-3´ | Gene name | Amplicon (pb) | PCR Efficency | R2 | Genbank Access number | Gene function |
|---|---|---|---|---|---|---|---|
| Cg-
28s-Fw Cg- 28s-Rv |
GGAGTCGGGTTGTTTGAGAATGC
GTTCTTTTCAACTTTCCCTCACGG |
Ribosomal subunit 28s | 114 | 1.97 | 0.99 | AY632555 | Protein Ribosomal |
| Cg-gapdh- Fw Cg-gapdh-Rv |
GTTCAAATATGATTCAACTCACGG
TGGATCCCGTTCGCAATATACG |
Glyceraldehyde 3 phosphate dehydrogenase | 109 | 2.0 | 0.99 | AJ544886 | Catalyzation in glycolycosis |
| Cg-tub β -Fw
Cg-tub β -Rv |
AGCAGATGTCGTAGAGAGCTTC TGAACACATTCTCCGTTGTCCC |
Tubulin β | 144 | 1.96 | 0.99 | CB617442 | Microtubule component of the eukaryotic cytoskeleton |
| Cg-act-Fw
Cg-act-Rv |
TACTCTTTCACCACCACAGCCG TAGAGATGAGGATGAAGCAGCAG |
Actin (GIA) | 117 | 1.95 | 0.98 | AF026063 | Cell motility, structure, and integrity |
| Cg-ef-1α-Fw
Cg-ef-1α-Rv |
ACCATACAGTGAGGCTCGATTC GTGGAAGCCTCAATCATGTTATC |
Elongation factor1-α | 138 | 2.0 | 0.98 | AB122066 | Transcription factor |
| Cg-tryp Fw
Cg-tryp Rv |
GCCAGTGACGTAAGACAACTCG CAACCATCAACAACGACATTGCC |
Trypsin | 125 | 2.0 | 0.99 | CB617494 | Protein metabolism |
| Cg-coi Fw
Cg-coi Rv |
GTGTATGTCCTTATTCTTCCAGG
GCACGCGTATCAATATCCATTCC |
cytochrome c oxidase I | 182 | 1.98 | 0.98 | AB033687 | Oxidative Metabolism |
To test the primer efficiency (E), the standard curve method was used. For that, five-fold serial dilutions of cDNA of oysters exposed to dinoflagellates and control were subjected to standard qPCR protocol. Threshold Ct values and the logarithm of the target concentrations were plotted to calculate the slopes of the standard curves (Table 1). The amplification efficiency of qPCR was calculated using the equation: E = 10 [-1/slope -1 x 100), the acceptable E value was defined as between 95 and 100 % (Bustin, 2002).
Additionally, a validation analysis of candidate reference gene stability was performed for carefully selecting them to ensure data reliability. The data of Ct values were used to perform GeNorm, NormFinder and BestKeeper analysis.
Reference Gene Validation
The qPCR reactions were conducted in triplicate in holding Strip Tubes (0.1 mL) (Qiagen, Hilden, Germany), using a Rotor gene 6000 Real-Time PCR detection system (Qiagen, Hilden, Germany). A qPCR cocktail-mix was prepared with 2.5 mM MgCl2, 2mM dNTP (each), 0.3 U of Platinum Taq polymerase (Invitrogen), 10 picomoles of each primer pair, and 20X EvaGreen fluorescent dye Biotium®, and 3.2 ng/µL of cDNA in a final volume of 15 µL. Amplification conditions were: 95°C for 5 min; 40 cycles of 95°C (60 s), 61°C (30 s) and 72°C (5s), acquiring the fluorescence at 79°C (1 s); finally a dissociation step from 65°C to 95°C (1°C/s) was done. For each candidate reference gene, the melt curve and gel picture were analyzed to verify the specificity of the amplified products and to confirm that at a single PCR product had been amplified. Amplification efficiencies were used for gene stability analyses of the potential set of reference genes (Table 1).
Statistical analysis
For GeNorm™ (Vandesompele et al., 2002; Pfaffl et al., 2004; Andersen et al., 2004) NormFinder and BestKeeper analysis the Ct were transformed to relative quantities using the formula (1+E-Δcq) (Livak and Schmittgen 2001). Ct values were transformed into a natural logarithm to analysis on NormFinder. No transformed Ct values are required for BestKeeper analysis.
The GeNorm algorithm first calculates an expression stability value (M) for each gene and then compares the pair-wise variation (V) of this gene with the others. Pairwise variation (V) between two sequential normalization factors containing an increasing number of genes (Vandesompele et al., 2002). NormFinder identifies stably expressed genes among a set of candidate normalization genes. The analysis produces a stability value for the examined genes, which is the variation calculation of the expression of the genes under different experimental conditions (Andersen et al., 2004). BestKeeper´s index calculates the geometric mean of those genes that are expressed with a standard deviation (SD) lower than 1 (Pfaffl et al., 2004).The web tool RefFinder (https://omictools.com/reffinder-tool) evaluates the gene rank from each program. The value assigned in RefFinder for each gene is used to calculate the geometric mean of their values for the overall final ranking. Thus, the lower value is assigned to the gene with more stable expression.
The 2-ΔΔCT method (Rozen et al., 2000; Bustin 2002) was used to normalize the relative expression of target genes trypsin (tryp) and cytochrome c oxidase (coi). The negative control non-toxic was used as the reference sample (calibrator). The statistic difference in gene expression was analyzed by one-way ANOVA; significant differences were obtained with the post hoc Fisher’s multiple test comparison (α=0.05). All analyses were performed with Statistic 8.0® software (StatSoft, Tulsa, USA). Significant differences were set at p < 0.05.
Results and discussion
Primer specificity and amplification efficiency
The RT- qPCR assays had amplification efficiencies between 95% and 99%. The determination correlation coefficients (R2) values were higher than 0.98 (Table 1). The presence of one peak in the melting curves was the criterion to assess the primer specificity. For all evaluated genes, no primer-dimer was detectable, confirming gene-specific amplification (Fig. 1). Also, the specific amplification was corroborated by agarose gel electrophoresis, for all expected PCR products, a single band had been observed. Ct values were distributed as indicated for condition 1: 21-26 (28s-rR-NA); 23.11-26 (β-tub); 22-26 (ef-1α); 23-30 (gapdh); 23-30 (act) (Fig. 2a ); and for condition 2: 20-27 (28S RNAr); 22-34 (β-tub); 22-27 (ef-1α); 23-29 (gapdh); 23-31 (act) (Fig. 2b). However, for expression stability evaluation, a simple comparison of the raw Ct values for the candidate reference genes could not provide sufficient information. Thus, the following analysis was important for reference gene validation.

Figure 1 Specificity of five reference genes of Crassostrea gigas with single
peaks in melting curves. (a) β tubulin (β tub),
(b) α subunit of elongation factor 1
(ef1-α), (c)
actin (act), (d)
glyceraldehyde-3-phosphate dehydrogenase
(gapdh) and (e) 28S ribosom-al RNA
(28S rRNA).
Figura 1. Especificidad de cinco genes de
referencia de Crassostrea gigas con un solo pico en las curvas de
fusión. (a) β tubulina (β tub), (b) subunidad α del factor de
elongación 1 (ef1-α), (c) actina (act), (d) gliceraldehído-
3-fosfato deshidrogenasa (gapdh) y (e) 28S del ARN ribosomal (ARNr
28S).
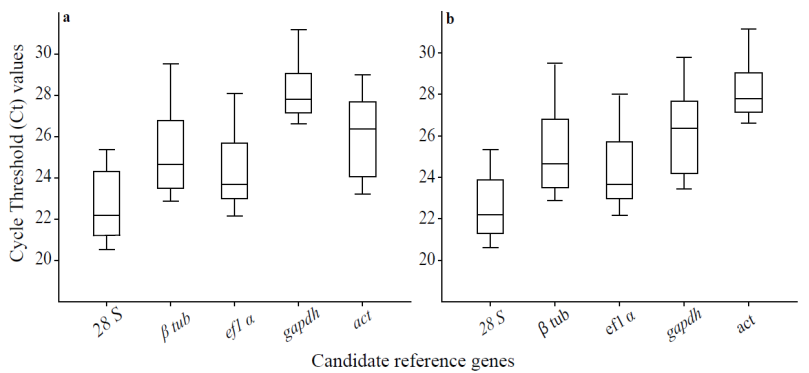
Figure 2 The threshold cycle values of the candidate reference genes. Algal mix
Prorocentrum lima and Isochrysis
galbana (a) algal mix Gymnodinium
catenatum and Isochrysis galbana (b).
Lines across the Box plot graph of Ct value represent the median
values. Lower and upper boxes show the 25th percentile to the
75th percentile. Whiskers represent the maximum and
minimum values.
Figura 2. Valores del ciclo umbral de los genes de
referencia candidatos. Dieta mezclada de las algas Prorocentrum lima
e Isochrysis galbana (a) dieta mezclada de las algas Gymnodinium
catenatum e Isochrysis galbana (b). Las líneas del diagrama de caja
de los valores Ct representan los valores medios. Los cuadros
inferior y superior muestran el percentil 25 al percentil 75. Los
bigotes representan los valores máximos y mínimos.
Quantitative gene expression analysis is reliable only when suitable reference genes are used for normalization. In this work, we demonstrate varied expression stabilities of five reference genes in Pacific oyster C. gigas spat stage during in vitro exposure to two species of toxic dinoflagellates, G. catenatum and P. lima in mixed or alone diets and compared to non-toxic diet (I. galbana), and thus highlighted the need to evaluate expression stability of reference genes for normalization.
Evaluation of candidate reference genes
The qPCR is considered to be an effective and accurate technique used to examine gene transcription patterns in different experimental conditions. To normalize the expression of the target genes, a reference gene is required, as well as to integrate experimental variations (Livak and Schmittgen, 2001; Bustin and Nolan, 2004). Thus, studying the expression stability of these genes is recommended before quantifying genes of interest (Vandesompele et al., 2002; Bustin and Nolan, 2004). Programs such as GeNorm, NormFinder, and BestKeeper have been successfully employed to determine the stability and identify the most suitable reference gene (Bustin, 2010). However, the use of a single validated gene is common in the qPCR normalization in bivalves (Volland et al., 2017). Due to some reported reference genes can vary transcriptionally under different biological and experimental factors (Mello et al., 2012; Feng et al., 2013), the appropriate selection of reference genes is essential to avoid false-positive results that may lead to misinterpretations and imprecise conclusions (Nascimento et al., 2015).
The order of stability of genes showed by GeNorm analysis was ef-1α, β-tub, act, gapdh, and 28S rRNA (Fig. 3a) in condition 1. GeNorm software generates the pairwise variation V value (Vn/Vn+1) with 0.150 cut-off value proposed. The addition a reference gene is not required below the cut- off. The V2/3 and V3/4 values were 0.05 and 0.085 (Fig. 3b), respectively. The results of the analysis suggested three housekeeping genes as normalization factors.
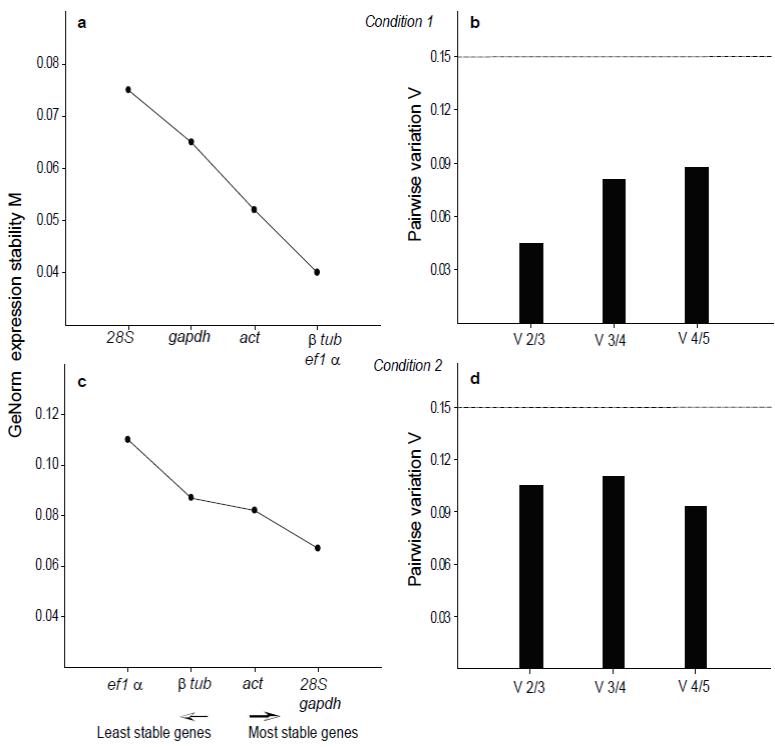
Figure 3 Gene expression stability (M) calculated by GeNorm software and pairwise variation
analysis in oysters exposed to algal mix of Prorocentrum
lima and Isochrysis galbana (a, b),
algal mix of Gymnodinium catenatum and
Isochrysis galbana (c, d). Bar values indicate
change magnitude in the normalization factor after the inclusion of
an additional reference gene.
Figura 3.
Estabilidad de la expresión génica (M) calculada por el software
GeNorm y análisis de variación por pares en ostiones expuestos a una
dieta mezclada de las algas de Prorocentrum lima e Isochrysis
galbana (a, b) y una dieta mezclada de las algas de Gymnodinium
catenatum e Isochrysis galbana (c, d). Los valores de la barra
indican la magnitud del cambio en el factor de normalización después
de la inclusión de un gen de referencia adicional.
GeNorm analysis showed that gapdh and 28S rRNA genes were the most stable (Fig. 3c) in diets of condition 2. The optimal number of genes required for accurate normalization was two. The V2/3 value was 0.11; this value did not increase significantly by incorporating the third gene, so the addition of a third reference gene was not necessary. The expression analyses showed that included two or three internal genes; the values did not change significantly (p=0.05) (Fig. 3d).
The stability analysis with NormFinder was consistent with GeNorm, where the best combination was also 28S rRNA and gapdh for condition 2 data (Table 2a). The results with NormFinder showed that the best combination was the β-tub and act gene in the mixed diet with P. lima (3 x 10³ cell mL-1) condition 1 (Table 2b). These results were consistent partially with GeNorm only for β-tub gene. NormFinder showed the act gene as the second most stable, whereas in the GeNorm analysis, this gene was the third most stable. Therefore, act was regarded as the third gene to be added for the relative expression analysis to data.
Table 2 NormFinder stability values for reference genes. An ideal reference gene has
inter-group variation as close to zero. Crassostrea
gigas exposure to mixed diet of Gymnodinium
catenatum and Isochrysis galbana (a),
mixed diet of Prorocentrum lima and
Isochrysis galbana (b).
Tabla 2. Valores de estabilidad NormFinder para los
genes de referencia. Un gen de referencia ideal tiene una variación
entre grupos lo más cercano a cero. Exposición de Crassostrea gigas
a una dieta mezclada de Isochrysis galbana y Gymnodinium catenatum
(a) y una dieta mezclada de Isochrysis galbana y Prorocentrum lima
(b).
| Gene name | NormFinder Stability Value (p) Intergroup variation | |
|---|---|---|
| (a) | (b) | |
| 28S | 0.012 | 0.012 |
| β tub | 0.011* | 0.007* |
| ef1 α | 0.014 | 0.009 |
| gapdh | 0.008* | 0.010* |
| act | 0.013 | 0.008* |
| Best pair | 0.007 | 0.003 |
Stability value for best combination of two genes (best pair). * Best combination of two genes
The BestKeeper index showed that the most stable genes were ef-1α and β-tub, for condition 1 data (Table 3a), which are inconsistent with GeNorm and NormFinder. This analysis also showed that the gapdh gene was the third most stable, thus agreeing with GeNorm. Consequently, we decided to use the two most stable genes showed by GeNorm and NormFinder to perform the reference gene validation for relative expression analysis for this condition. The BestKeeper index agreement with GeNorm and NormFinder, where β-tub was the most stable gene for condition 1 data (Table 3b).
Table 3 Correlation coefficient with the BestKeeper index of Crassostrea
gigas fed with mixed diet Gymnodinium
catenatum and Isochrysis galbana (a)
Prorocentrum lima and Isochrysis
galbana (b).
Tabla 3. Coeficiente
de correlación con el índice BestKeeper de Crassostrea gigas
alimentado con una dieta mezclada de Gymnodinium catenatum e
Isochrysis galbana (a) y una dieta mezclada de Prorocentrum lima e
Isochrysis galbana (b).
| Gene name | 28S | β tub | ef1 α | Gapdh | Act |
|---|---|---|---|---|---|
| (a) Coefficient of Correlation (r) | 0.86 | 0.98* | 0.99* | 0.96* | 0.93 |
| (b) Coefficient of Correlation (r) | 0.89* | 0.978* | 0.86 | 0.94* | 0.88 |
| p Value | 0.001 | 0.001 | 0.001 | 0.001 | 0.001 |
The coefficient of correlation (r) and the p-value measure the correlation between each gene and the BestKeeper index. *Most stable Genes
Our results suggest that β-tub/ef-1α represents a solid combination of internal controls for qRT-PCR normalization in the Pacific oyster spat stage exposed to toxic Prorocentrum lima and combination of 28S rRNA/gapdh represent the most reliable internal controls for oysters exposed to toxic Gymnodinium catenatum. Based on our results, we recommend the use of this combination of reference genes for the experimental conditions 1 and 2 (Fig. 3).
In bivalves mollusk, several genes including ef-1α, act, β-tub, 28S rRNA and gapdh are frequently used as reference genes for qPCR analysis, under exposure to marine toxins in experimental conditions (Mello et al., 2012; Feng et al., 2013; Volland et al., 2017; Martínez-Escauriaza et al., 2018). In our study, these five available candidate reference genes were selected, and their expression was monitored to revise their stability by real time quantitative PCR during in vitro exposure of C. gigas spat to the toxic dinoflagellates. The selected reference genes are involved in ribosomal metabolism (28S rRNA), cytoskeleton structure (act, β-tub), catalyzation in glycolysis (gapdh), and elongation process in protein synthesis (ef-1α). The three algorithms allowed ranked candidate reference genes according to their expression stability, showing agreement in the results (Fig. 3). The analysis provided a consensus among the three algorithms in samples of the first condition where the β-tub gene appeared as the most suitable reference gene by NormFinder; the second most stable observed was ef-1α gene by GeNorm, act gene by NormFinder, and gapdh; the third more stable gene was act, which is commonly used as an internal standard for the normalization of gene expression (Fig. 3). GeNorm and NormFinder also showed approaches concordant in samples of the second condition indicating the pair 28S rRNA/gapdh as the best combination of reference genes (Fig. 3).
Ef-1α is a eukaryotic translational elongation factor, which plays a key role in protein translation (Browne and Proud, 2002; Ejiri, 2002). It has been reported the use of ef-1α gene as the best reference gene in soft-shell clams, M. arenaria (Siah et al., 2008), as well as an internal control in studies of OsHV-1 infection in adult oysters (Renault et al., 2011). However, it is not suitable for use in oyster larvae (Du et al., 2013). In this study, ef-1α was one of the most stable genes, so it was used as a reference gene in the oysters spat exposed to G. catenatum.
The β-tub and act gene coding for cytoskeletal proteins, which are involved in structure playing a pivotal role in phagocytosis and encapsulation (Martin et al., 2010). In fact, β-tub has been used extensively as a reference standard, encloses recent studies in oysters (Zhang et al., 2011). We found this gene as one of the most stable, so it was used as a reference gene under our experimental condition (Condition 1).
In mollusks studies, act gene has been frequently used in RT-qPCR assays (Martin et al., 2010; Zhang et al., 2011; Du et al., 2013; Martínez-Escauriaza et al., 2018). The findings of the present work showed changes in the expression level of the act gene for the presence of both species of toxic dinoflagellates, which suggest act is an unstable gene.
The 28S rRNA gene, is chosen extensively as a reference gene and frequently is used in mollusks bivalves (Cellura et al., 2007; Zhang et al., 2011; Volland et al., 2017). The 28S rRNA has been reported as an unstable gene when hemocytes of soft-shell clams, M. arenaria, were challenged with Vibrio splendidus (Araya et al., 2008). However, we found this gene as one of the most stable, so it was used as a reference gene under our experimental condition (Condition 2).
The gapdh gene is frequently used as a reference gene in humans, plants, and invertebrates such bivalves; it has also been a choice for normalization in experimental approaches of bivalve tissues such as gills, digestive gland (Sussarellu et al., 2012; Martínez-Escauriaza et al., 2018). This gene expression was stable in our experiment only for condition 2, so it was suitable for the reference genes.
It has been widely reported the use of ef-1α, act, β-tub, 18S, 28S, and gapdh genes as references genes in bivalves as Ostrea edulis (Feng et al., 2013), scallops (Morga et al., 2010), Mytilus spp. or C. gigas in both experimental and field studies (Nuñez-Acuña et al., 2013; Della Torre et al., 2013; Lacroix et al., 2014), clam Ruditapes philippinarum (Volland et al., 2017) oysters Crassostrea sikamea and Crassostrea angulate (Yang et al., 2017) and Mytilus galloprovincialis (Martínez-Escauriaza et al., 2018) both in tissues (gonads, gills, and digestive gland) and hemocyte. However, Du et al. (2013), reports that none of these five common reference genes were stables due to their high variability with the experimental conditions tested, suggesting they were unsuitable as internal controls. However, our results confirmed that traditional reference genes commonly used, such as β-tub, ef-1α, 28S rRNA, and gapdh showed the highest stability, when oysters spat were exposed to toxic dinoflagellates (condition 1 and 2).
Reference gene validation to normalize gene expression To evaluate the suitability and performance of the reference genes established by the three software tools, the expressions of trypsin (tryp) and cytochrome C oxidase (COI) genes in oysters after challenge with the two toxic dinoflagellate species and compared with a calibrator (nontoxic control group) were measured. By relative qPCR, the expression pattern of target genes was evaluated. For normalization, the reference genes selected for each condition were used. From the three software, the most stable reference genes selected had a correlation coefficient of R2>0.98 (Table 1). Based on our experiments, β -tub and ef-1α were the most stable reference genes for the Pacific oyster spat stage exposed to toxic P. lima. On another hand, 28S rRNA and gapdh were the most stable reference genes for Pacific oyster spat exposed to toxic G. catenatum. Therefore, the combined use of these genes was utilized as internal controls for accurate normalization of qPCR. Expression profiles of trypand coi vary substantially between normalization strategies. These genes were affected by exposure to the toxic dinoflagellates; we found significant differences in the expression levels of genes in oysters challenged in both conditions (p < 0.05) compared with oysters fed with the non-toxic control (Fig. 4).
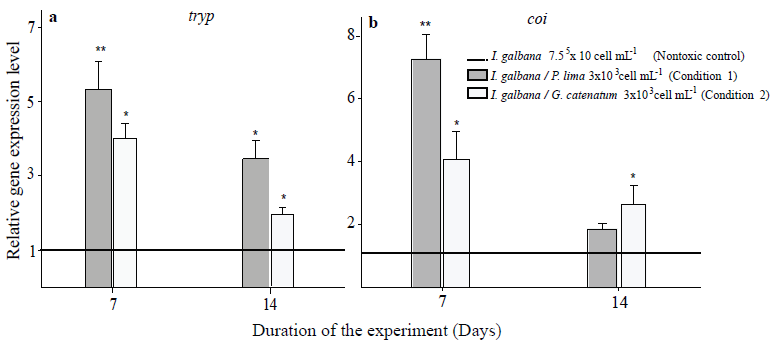
Figure 4 Relative expression of tryp (a) and coi (b) using
selected reference genes β tub and ef1α
(condition 1); 28S rRNA and
gapdh
(
condition 2
). The bars represent standard error. The asterisks
mean significant differences between treatment and control group (p
˂ 0.05 in Fisher´s LSD).
Figura 4. Expresión
relativa de tryp (a) y coi (b) usando los genes de referencia
seleccionados β tub y ef1α (condición 1); ARNr 28S y gapdh
(condición 2). Las barras representan el error estándar. Los
asteriscos significan diferencias significativas entre el grupo
control y los tratamientos (p ˂ 0.05 en LSD de Fisher).
Expression profiles of tryp and coigenes vary substantially between normalization strategies (Fig. 4). The results of this work point out to validate the reference candidate genes for different experimental conditions; also, we suggest to applied a minimum of two statistical algorithms. It is recommended to perform a complete analysis with the conditions tested in C. gigas adults and in different tissues to evaluate the level of expression by tissue, due to the expression of reported reference genes changes under experimental conditions.
Conclusions
Based on the results, we recommend the combination of β-tub and ef-1α as reference genes for the normalization in Crassostrea gigas fed a mixed diet of I. galbana and P. lima, whereas 28S rRNA and gapdh was best for oysters fed with I. galbana and G. catenatum. The combined use of these genes as optimal reference genes will be useful for data normalizing when studying expression levels in oysters spat stage exposed to these dinoflagellates, providing more reliable and accurate expression measurements, to improve the current knowledge about the effect of dinoflagellate DPS and PSP toxins producers on the Pacific oyster C. gigas. Additionally, were demonstrated the relevance of evaluating the stability of reference genes statistically because each experimental condition used to change the gene expression.

