


 nueva página del texto (beta)
 Inglés (pdf)
 Artículo en XML
 Referencias del artículo
 Enviar artículo por email
 Citado por SciELO
  Similares en
SciELO
Similares en
SciELO 
 Permalink
Introduction
Prostanoids (PGs) are derived from fatty acids of cell membranes and released by phospholipase A2 (PLA2)1. PGs are classified into three series. Series 1 components are synthesized from homo-γ-linoleic acid, which is the origin of prostaglandin E1 (PGE1)2.
For more than one decade, anabolic therapy for osteopenia has generated great enthusiasm. Four forms of the parathyroid hormone (PTH), 1-34, 1-84, 1-36, and abaloparatide, are currently the only anabolic bone therapy. PTH increases bone formation and bone resorption, causing hypercalcemia3,4. An ideal anabolic bone treatment would optimize bone formation with minimal change in resorption and no hypercalcemia3,5. Our objective was to investigate by biochemical and histomorphometry studies, including remodeling-based bone formation (RBF) and modeling bone formation (MBF), if PGE1 might be a suitable bone anabolic agent that could be used in diseases such as osteoporosis, maxillary deficiency, and others.
Methods
This study was conducted following institutional, national, and international norms6,7. Thirty 3-month-old New Zealand male rabbits of approximately 3 kg of body weight were divided randomly into three groups (n = 10): control group (with no palate disjunction + vehicle); sham group (with palate disjunction + vehicle), and PGE1 group (with palate disjunction + prostaglandin administration). Rabbits were fed with a balanced diet (Ca, 1.2%; P, 0.8%; Vitamin D3, 1 IU/g) and deionized distilled water ad libitum. Control and sham groups received 1 ml/day of vehicle (0.990 ml saline solution + 0.01 ml ethanol) intravenously for 22 days. The PGE1 group received 50 mg/ml of PGE1 dissolved in 1 ml of vehicle solution intravenously for 22 days. The PGE1 dose was calculated considering an 8% of lung inactivation8. Under pentobarbital sedation, basal X-rays from palatine suture were taken on days 1, 3, and 22 using radiologic plates at 0.08 mAmp/65 kV. The palatine suture was measured with a millimeter rack. After the basal X-ray, tensional palate disjunction was obtained with a metallic handle orthodontic fixer placed between the rabbits' incisive teeth in the sham and PGE1 groups, with a pressure of 170 g/cm2. On day 6, the disjunction was fixed with a steel bar placed under the incisive teeth and a high curing resin, and the orthodontic handle fixer was retired. Since day 6, all rabbits received an intramuscular dose (40 mg) of oxytetracycline every 12 h/2 days. Ten days later, oxytetracycline administration was repeated.
On day 22, rabbits were sacrificed under deep general anesthesia. A last X-ray palatine suture and urine sample by bladder puncture were obtained to measure Ca, P, and cross-linked N-telopeptide9,10. Blood samples from the aorta were also collected to measure total Ca and Mg (with atomic absorption flame spectrophotometry) and P levels (by quantitative phosphomolybdate complex spectrophotometry). Total alkaline phosphatase (AkPh) and its thermolabile bone fraction (AkPhO) were quantified by the modified Guttmann method and its bone isoform by the denaturation method9. Furthermore, PTH "intact" molecule (PtH1), calcitonin (25 Vitamin D), and calcitriol (1,25(OH)2 D3) were quantified through radioimmunoassay. Samples of the anterior palatine bone were fixed in 70% alcohol solution and kept at room temperature. Subsequently, they were dehydrated by increasing ethanol concentrations and embedded undecalcified in methyl methacrylate. With a hard work microtome, 4 mg thick sections were obtained, rehydrated, and stained for Masson-Goldner trichrome, toluidine blue, and unstained for fluorescence microscopy. The suture bones (wormian) were measured, starting behind the cortical-alveolar bone towards the posterior region. The anterior, posterior, left, and right bone sutures surfaces and their sub-suture and endo-suture surfaces were identified (Fig. 1). The histomorphometry study of sutural bones was identified as structural, static bone formation, dynamic bone formation, and bone resorption. All analyses were performed using a digitizing table with an osteomeasure software (Osteometrics, Atlanta GA), following the nomenclature and recommendation of the American Society for Bone and Mineral Research11-14.
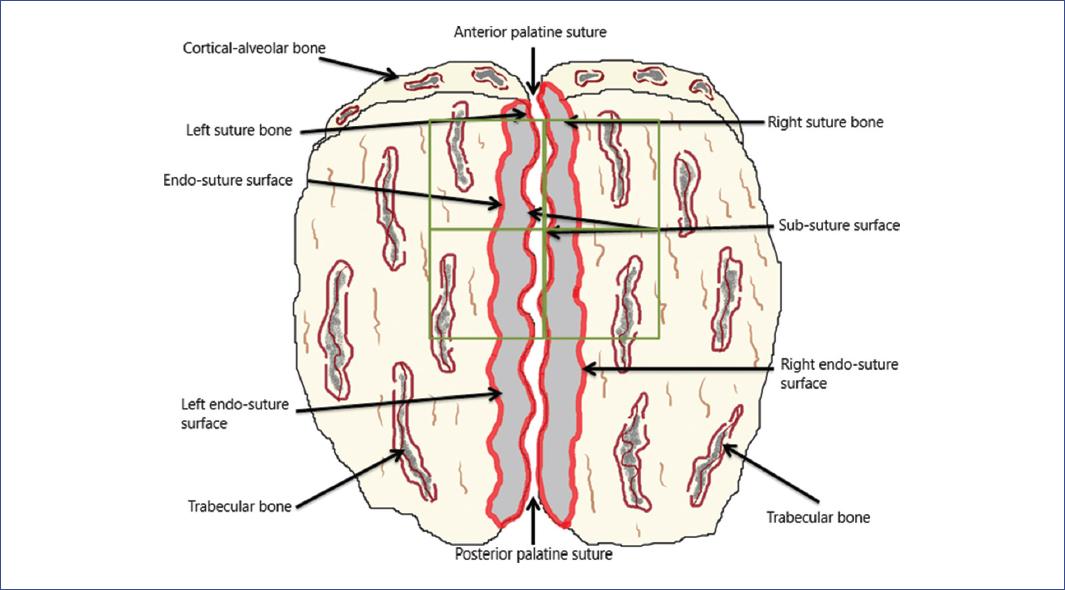
Figure 1 Anatomic diagram of the rabbit's palatine bone with the anterior and posterior regions. The square highlight of the anterior zone shows where the measures were performed; the anatomical identification of the bone surfaces is observed.
The histomorphometry structural sutural-bone parameters (Sb): bone width (SBwi), bone area (SbAr), bone thickness (SbTh), and sutural bone volume (SbV/TV) were measured in the different groups.
The histomorphometry static bone formation parameters evaluated were osteoid thickness (SbOTh), osteoid surface/bone surface (SbOS/BS), osteoid volume/bone volume (SbOV/BV), and osteoblasts surface/BS (SbObS/BS). Other static parameters of bone formation were measured to analyze the sutural bone mineralization front (SbMF) in slides stained with toluidine blue, observing the architecture of the cement lines15. The RBF was detected as cement lines scalloped due to prior osteoclast resorption. The MBF was identified as smooth cement lines as if they were forming on a quiescent BS14-17. This assessment was confirmed using a polarizing filter to highlight the collagen fibers' orientation to reflect the shape of the cement line underling the label with toluidine blue. The RBF and MBF were separately quantified as a percentage of total SbMF surfaces14-16. The quiescent surface (SbQS) was measured as the percentage of no RBF and no MBF (not stained with toluidine blue), calculated as Ominsky suggested with 100-MBF+RBF+ES/BS16. The histomorphometry dynamic parameters of bone formation measure the mineralizing surface/BS (SbMS/BS); the mineral apposition rate (SbMAR); the osteoid maturation time (Omt); the mineralization lag time (MLT), and the bone formation rate/BS (SbBFR/BS). Resorption histomorphometry bone parameters (sutural bone osteoclast surface/BS [SbOcS/BS] and sutural bone eroded surface/BS [SbES/BS]) were quantified as well11,13,14.
These histomorphometric studies were validated with the previously mentioned software comparing control versus PGE1 groups. The means and standard deviations were calculated in each subgroup. Parameter differences were tested with the Student's t-test and the Fisher test (with a significant value of < 5%). All results were analyzed with the SPSS V-18 software.
Results
Palate bone disjunction and in vivo radiological results are shown in table 1. On day 3, we observed a significant difference of palatine suture width (p < 0.05) between the sham and PGE1 groups. On day 22, a significant teeth separation (p < 0.01) was detected between these groups.
Table 1 Radiologic results of palate disjunction and teeth separation
| Radiological results | Date | Control group | Sham group | PGE1 group | p-values (sham vs. PGE1) |
|---|---|---|---|---|---|
| X-ray 1 Disjunction (mm) | Basal | 0.07 ± 0.006 | 0.09 ± 0.01 | 0.08 ± 0.009 | 0.1 |
| Day 3 | 0.09 ± 0.01 | 0.29 ± 0.05 | 0.37 ± 0.09 | 0.05* | |
| Day 22 | 0.09 ± 0.01 | 0.25 ± 0.04 | 0.24 ± 0.07 | 0.1 | |
| X-ray 2 Teeth separation (mm) | Basal | 0 | 0 | 0 | - |
| Day 3 | 0 | 4.6 ± 0.56 | 4.65 ± 0.45 | 0.1 | |
| Day 22 | 0 | 4.33 ± 0.58 | 5.14 ± 0.34 | 0.01* |
*p<0.05;
**p<0.01.
PGE1: prostaglandin E1.
Blood levels of Ca, Mg, and P were similar between groups. The absence of hypercalcemia in the PGE1 group was noticeable (Table 2). No significant differences were observed in biochemical markers concentration, except for calcitriol in the PGE1 group, which was significantly higher than the sham group (p < 0.002).
Table 2 Blood and urine bone formation markers on day 22 in rabbits with palate bone disjunction treated with PGE1
| Variables | Control group | Sham group | PGE1 group | p-values (sham vs. PGE1) |
|---|---|---|---|---|
| Ca (mg/dL) | 11.55 ± 0.72 | 11.55 ± 0.68 | 11.85 ± 0.42 | 0.1 |
| Mg (mg/dL) | 2.40 ± 0.27 | 2.01 ± 0.54 | 2.20 ± 0.20 | 0.1 |
| P (mg/dL) | 5.17 ± 0.65 | 5.03 ± 0.43 | 5.26 ± 0.14 | 0.1 |
| AkPh (IU/L) | 73.35 ± 24.3 | 67.37 ± 17.0 | 61.37 ± 11.2 | 0.1 |
| Bone AkPhO (%) | 53.12 ± 10.5 | 56.50 ± 9.38 | 50.00 ± 16.2 | 0.1 |
| Vitamin D3 (ng/mL) | 38.16 ± 15.7 | 47.0 ± 20.6 | 39.0 ± 18.7 | 0.1 |
| PTHi (pg/mL) | 28.1 ± 15.6 | 30.2 ± 26.0 | 27.4 ± 10.1 | 0.1 |
| Calcitonin (pg/mL) | 32.3 ± 11.3 | 40.1 ± 20.5 | 28.4 ± 15.1 | 0.1 |
| Calcitriol (pg/mL) | 50.5 ± 13.15 | 48.0 ± 13.8 | 82.1 ± 13.5 | 0.002** |
| Urine bone formation markers on day 22 | ||||
| Ca (mg/dL) | 186 ± 665 | 178 ± 53.3* | 376 ± 102.2 | 0.001* |
| P (mg/dL) | 28 ± 5.3 | 29 ± 14.1 | 42 ± 21.6 | 0.1 |
| N-telopeptide (nMBCE) | 32 ± 4.1 | 38 ± 16.5 | 30 ± 2.0 | 0.1 |
*p<0.001;
**p<0.002.
AkPh: total alkaline phosphatase; AkPhO: alkaline phosphatase thermolabile bone fraction; PGE1: prostaglandin E1; PTHi: intact parathyroid hormone.
Urine Ca levels group were significantly high (p < 0.001) in the PGE1, but the phosphaturia and the cross-linked N-telopeptide of type 1 collagen were similar in all groups. Interestingly, the biochemical marker of bone resorption (N-telopeptide) was not increased in the PGE1 group (Table 2).
The structural histomorphometry parameters of the sutural bone in the PGE1 group exhibited anabolic bone formation evidenced by significant increases in the SbAr (p = 0.014), SbTh (p < 0.001), and SbV (p = 0.007) compared with the sham group (Fig. 2). In the PGE1 group, the static bone formation parameters showed a significant decrease in osteoid thickness, sutural bone osteoid surface, and sutural bone osteoid volume/BV (Table 3). The number of sutural bone osteoclast surface/BS was similar in all groups.
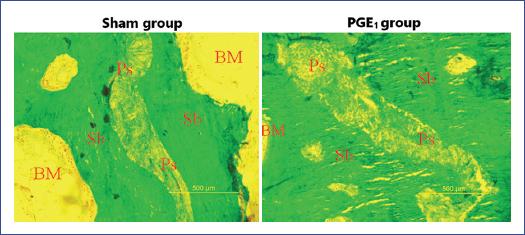
Figure 2 Comparing the sutural bone volume/tissue volume from the sham group versus the prostaglandin E1 (PGE1) group. On the sagittal sections with the same magnification for both images, we observed a significant anabolic increase of the sutural bone (right) in the PGE1 group (p = 0.007). Ps: palatine suture; Sb: suture bone; BM: bone marrow. Stained with Goldner's trichrome, 10.0 mm × 12.5 mm objective.
Table 3 Structural histomorphometry parameters of the sutural bone
| Variable | Control group | Sham group | PGE1 group | p-values (sham vs. PGE1) |
|---|---|---|---|---|
| SbWi (µm) | 125.36 ± 38.79 | 201.32 ± 96.91 | 260.08 ± 66.85 | 0.1 |
| SbAr (mm2) | 0.29 ± 0.12 | 0.36 ± 0.09 | 0.53 ± 0.08 | 0.014* |
| SbTh (µm) | 452.47 ± 86.14 | 810.03 ± 373.8 | 1007.8 ± 246.4* | 0.001** |
| SbV/TV (%) | 35.62 ± 11.1 | 42.23 ± 11.25 | 57.20 ± 8.12 | 0.007* |
| Static histomorphometry parameters of sutural bone formation | ||||
| SbOTh (µm) | 14.05 ± 1.85 | 13.65 ± 2.02 | 7.98 ± 2.79 | 0.004* |
| SbOS/BS (%) | 38.35 ± 10.04 | 20.12 ± 7.56 | 8.71 ± 5.10 | 0.01* |
| SbOV/BV (%) | 0.45 ± 0.27 | 0.67 ± 0.36 | 0.26 ± 2.26 | 0.007* |
| SbObS/BS (%) | 18.62 ± 8.01 | 19 ± 6.45 | 15.45 ± 2.60 | 0.345 |
| SbRBF (%) | 13.81 ± 2.85 | 19.7 ± 6.12 | 8.64 ± 1.34 | 0.001** |
| SbMBF (%) | 3.36 ± 0.74 | 5.98 ± 2.53 | 16.68 ± 4.42 | 0.001** |
| SbQS (%) | 81.53 ± 2.96 | 72.96 ± 7.92 | 73.84 ± 4.44 | 0.293 |
| Dynamic histomorphometry parameters of sutural bone formation | ||||
| SbMS/BS (%) | 67.671 ± 13.56 | 281.85 ± 56.37 | 273.07 ± 54.61 | 0.1 |
| SbMAR (µm/day) | 2.85 ± 0.49 | 4.73 ± 1.13 | 4.81 ± 0.77 | 0.983 |
| Omt (days) | 5.11 ± 1.35 | 3.00 ± 0.69 | 1.72 ± 0.77 | 0.009* |
| MLT (days) | 23.30 ± 4.03 | 22.21 ± 3.18 | 10.38 ± 2.95 | 0.001** |
| SbBFR/BS (µm3/µm2/year) | 703.94 ± 140.78 | 4865.99 ± 973.19 | 4794.15 ± 958.33 | 0.1 |
| Static histomorphometry parameters of sutural bone resorption | ||||
| SbOcS/BS (%) | 1.12 ± 0.52 | 1.34 ± 0.98 | 0.87 ± 0.38 | 0.1 |
| SbES/BS (%) | 3.63 ± 1.44 | 4.04 ± 3.15 | 3.18 ± 1.62 | 0.1 |
*p<0.05;
**p<0.001.
PGE1: prostaglandin E1; SbWi: sutural bone width; SbAr: sutural bone area; SbTh: sutural bone thickness; SbV/TV: sutural bone volume/tissue volume; SbOTh: sutural bone osteoid thickness; SbOS/BS: sutural bone osteoid surface/bone surface; SbOV/BV: sutural bone osteoid volume/bone volume; SbObS/BS: sutural bone osteoblast surface/ bone surface; SbRBF: sutural bone remodeling bone formation; SbMBF: sutural bone modeling bone formation; SbQS: sutural bone quiescent surface; SbMS/BS: sutural bone mineralizing surface/bone surface; SbMAR: sutural bone mineral apposition rate; Omt: osteoid maturation time; MLT: mineralization lag time; SbBFR/BS: sutural bone formation activity/bone surface; SbOcS/BS: sutural bone osteoclast surface/bone surface; SbES/BS: sutural bone eroded surface/bone surface.
In the sham group, we observed 19.7% of SbRBF but only 5.9% of SbMBF. On the contrary, in the PGE1 group, we observed 8.6% of SbRBF and 16.6% of SBMBF (Table 3).
Under polarized light, we corroborated the irregular lamellar lines of RBF and the regular lamellar lines of SbMBF (Fig. 3). The sutural surface of quiescent bone areas was similar between the sham and PGE1 groups (Table 3).
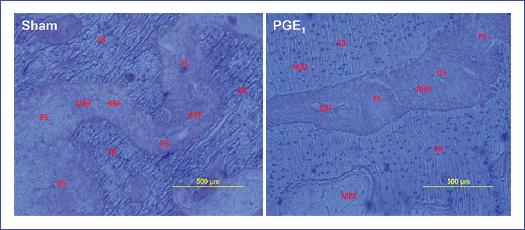
Figure 3 Mineralization front of the sutural bone was identified with a toluidine blue stain. In the sham group (no prostaglandin E1 [PGE1]), the scalloped cement lines predominated (remodeling-based bone formation). In contrast, in the PGE1 group, the smooth cement lines predominated (modeling-based bone formation). MBF: modeling bone formation; PS: palatine suture; QS: quiescent surface; RBF: remodeling bone formation; SB: suture bone. Toluidine blue stain, 10.0 mm × 12.5 mm objective.
Dynamic histomorphometry parameters of sutural bone formation showed differences in mineralizing bone markers. When comparing the control group versus the PGE1 group, we observed a significant shortening of Omt (p = 0.009) and mineralizing lag time (p < 0.001) (Table 3). The SbBFR/BS activity were similar between the sham and PGE1 groups but higher than the control group. With Masson-Goldner trichrome stain, no significant differences were observed in the static histomorphometry resorption parameters of the sutural bone between groups (Table 3).
Discussion
The present study demonstrated that PGE1 treatment produced a wider palate disjunction with fast anabolic sutural bone formation, significant reduction of the mineralizing time, and slight bone resorption, resulting in histomorphometry increased BV mainly through modeling-formation with no hypercalcemia. Significant increases in bone mineral volume and fracture risk reduction have generated much enthusiasm for using anabolic therapy in osteoporotic patients.
In the present study, the anabolic impact of PGE1 administration on the palatine-bones was confirmed by biochemical and histomorphometry findings. PGE1 increased significantly the synthesis of 1,25(OH)2D3 (p < 0.002) compared to the control and sham groups but did not produce hypercalcemia, even though hypercalciuria (p < 0.001) was detected in rabbits that received PGE1 (Table 2). We previously observed this phenomenon in vivo in rabbits and in vitro5. The resorption markers (N-telopeptide levels) remained similar due to an apparent low PGE1 resorption (Table 2).
The histomorphometry study on the sutural bones exhibited a significant anabolic growth characterized by a significant increase of the sutural area (p < 0.01), sutural thickness (p < 0.001), and the SbV (p = 0.007) compared with the sham group16,18.
When comparing the histomorphometry parameters between the sham and PGE1 groups, we found that bone formation was reversed. The RBF in the sham group was significantly higher (SbRBF = 19.7%) when compared with the MBF of the same group (SbMF = 5.9%). In the PGE1 group, the histomorphometry bone formation values were contrasting because the MBF was high (SbMF = 16.7%), and apparently, PGE1 inhibited the activation of bone remodeling (SbRBF = 8.6%) as reflected in decreased sutural bones resorptive parameters (Table 3). Serum biochemical markers were correlated with the histological findings, as the group that received PGE1 did not exhibit hypercalcemia. No increased resorption marker (N-telopeptides) was found in either the control or PGE1 groups (Table 2). These findings suggest that PGE1 differs from other anabolic bone agents and is near to be the "ideal bone anabolic molecule" that could optimize the impact on bone formation, producing fewer histomorphometry changes in resorption, and not inducing hypercalcemia3.
After Villanueva et al.14 identified the MF with toluidine blue staining, Miller and Marks18, using fluorochrome technology, observed that after PGE1 administration, periosteal bone formation was not preceded by the resorption phase, indicating that bone anabolism is stimulated mainly by bone modeling19.
At present, the only anabolic bone therapies available are the PTH forms: PTH 1-34, PTH 1-86, PTH 1-36, and abaloparatide3,4. These therapies have proved to be safe and effective. However, they increase bone resorption and induce hypercalcemia. Horwitz et al.20 suggested that PTHr related proteins might increase bone formation in the absence of hypercalcemia; slight resorption was also observed. Another exciting area in the exploration of combining PTH therapy with antiresorptive agents has produced intriguing results21,22. Some authors used antibodies against inhibitors of bone formation, such as the sclerostin (osteocytes secreted negative regulator of bone formation)16, odanacatib (cathepsin K inhibitor)23, and denosumab (a human monoclonal antibody that binds and inhibits RANK)24, and found that these antibodies favored anabolism and did not produce hypercalcemia. Most of these bone inhibitor antibodies, including PGE1, produced bone anabolism by a mechanism in which the MBF is observed predominately as smooth cement lines. Those changes are significant findings since they may be interpreted as an activation that produces bone anabolism with inadequate bone resorption, usually without hypercalcemia14-16,19.
These findings suggest that PGE1 treatment could act through an MBF mechanism to achieve anabolism with low resorption and no hypercalcemia in osteopenic diseases. This therapy could be evaluated in clinical research for other diseases, including human maxillary deficiency (a frequent disease in children), osteoporosis in adults, or any osteopenic problem. Our findings may represent new potential information for repairing bone fractures, osteomalacia/rickets, and other osteopenic disorders.
The SbOTh, SbOS/BS, and the SbOS/BV on the PGE1 group were less than the other groups, perhaps due to the acceleration of osteoid mineralization, while the mild increase in the mineral appositional rate is indicative of increased bone production25. Regarding the dynamic bone formation parameters, after 22 days of PGE1 treatment, we observed a significant shortening of the time of osteoid mineralization and MLT26. These findings suggest that PGE1 accelerates bone matrix mineralization, decreasing the osteoid sutural BS and increasing bone anabolism.
Understanding the effects of PGE1 on bone modeling and remodeling might help clarify its effects on bone formation and evaluate bone increase. We observed the same percentage of RBF and MBF in healthy children in iliac crest biopsies of the trabecular bone tissues15.
The effect of PGE1 on MBF has not yet been demonstrated in human adults. However, the biomarker's profile and histomorphometry results in children and animal models are encouraging14,16,25. We should further compare the MF identification with staining techniques, like tetracycline chelation.
In conclusion, the exogenous PGE1 treatment in rabbits exhibited a wider suture palate disjunction, increased calcitriol synthesis, and the sutural palatine bones volume, and shortened MLT. The bone anabolic effect may be exerted mainly through MBF, producing mild resorption without hypercalcemia. These findings could lead to new potential options for osteopenia treatments.

