


 text new page (beta)
 English (pdf)
 Article in xml format
 Article references
 Send this article by e-mail
 Cited by SciELO
  Similars in
SciELO
Similars in
SciELO 
 Permalink
Background
Despite the invasive character of the method, metabolic bone biopsy for the study of bone metabolic diseases in children is gaining fans. Several studies in children, without tetracycline or calcein labeling, showed histomorphometric static normal or abnormal values, but data in children with dynamic parameters are scarce1-3. This may be because histomorphometry requires an intense labor and needs special equipment and expertise. Other possible reason includes overestimation of the utility of laboratory bone diagnostics and poor information about what the bone histomorphometry does4-6. Our aim was to validate in a normal children group, bone normality by clinical, biochemical, and bone histomorphometric parameters. In the cortical and trabecular zones, the bone structure (size, form, and number), static (fixed bone formation parameters) with remodeling (with resorption) and modeling (without resorption), the dynamic (movably) bone formation, and the resorptic (bone degradation) parameters were analyzed7,8. Because in the growing children, the remodeling and modeling bone formations (RBF MBFs) have been rarely reported, it is important to qualified data obtained from a control group to compare with a given patient. In the present histomorphometric study, we are searching for reference results to be used as control in our laboratory and by others in the field. Since it is well known that the sensibility and specify of the clinical findings are not always exactly9,10 (e.g., osteoporosis vs. rickets), we need the bone biopsy as help.
Methods
This study was performed according to the recommendations of the World Medical Association of Helsinki declaration and approved by the Hospital Internal Review Board and ethics committee11. In all cases, parental written consent and assent of the children were obtained.
In a prospective protocol, the study comprised 20 Mexican children, age 8-17 years; 13 boys and 7 girls with bone transiliac biopsies obtained during surgery to correct congenital pale fissure. At the beginning, 20 subjects were studied, but one girl was excluded from the histomorphometry analysis because her bone biopsy was not representative (crushed biopsy core). All the children had normal renal function before surgery and no evidence of any clinic metabolic bone disease. Patient nutrition was evaluated through Z-score from body mass index considering the following rage: normal ≥ 1 to 1; low ≤ - 1; overweight ≥ + 1 to < 2, and obese ≥ + 212. None of the children were immobilized before surgery or received medications known to affect bone metabolism. Blood and 24 h urine were collected. In blood, Ca, P, Mg, creatinine, alkaline total phosphatase and its bone enzyme13,14, parathyroid hormone (PTH), calcidiol (25(OH)D3), and calcitriol (1,25(OH)2D3) were measured by radio immunoanalysis and in urine, volume, creatinine, Ca, phosphorous, cross-linked N-telopeptide of type collagen evaluated with ELISA13, and a urine culture was performed. To compare normal biochemical metabolic bone parameters, biochemical controls from 170 children were used15.
Under general anesthesia and after dual labeling with tetracycline (1 g/day taken orally during 2 days separated by a 10 day free interval), the biopsies were collected 48 or 72 h after the dual labeling. Transiliac bone biopsies were obtained with a Bordier trephine (7-8 mm core diameter) from 2 cm below and behind the anterior superior iliac spine in 20 children. No side effects were noticed.
Biopsy specimens were fixed in 70% alcohol and kept at room temperature. They were dehydrated in increasing concentrations of ethanol, cleared with xylene, and embedded undecalcified in methyl methacrylate. Sections (4-5 µ - thick) were cut with a Polycut M microtome (Reichert-Jung, Heidelberg, Germany). The sections were desplastified with ethylene glycol monoethyl acetate and rehydrated for optimal staining. They were stained with Masson Goldner trichrome, toluidine blue, and the third mounted unstained for fluorescence microscopy3,15.
Histomorphometry
The histomorphometric analysis was studied using a digitizing table with osteomeasure software (Osteometrics, Atlanta, GA) nomenclature and abbreviations followed the recommendations of the Committee from the American Society for Bone and Mineral Research16. According to this definition, “bone” is bone matrix (mineralized or not), “tissue” refers to bone and associated soft tissue as bone marrow, muscles, etcetera. Histomorphormetric measure is performed in two-dimensional sections. Nevertheless, to stress the three-dimensional nature of the bone, the nomenclature committee favored a three-dimensional nomenclature. To study the bone histomorphometric parameters, they are analyzed as structural, static with MBF and RBF, dynamic bone formation, and bone resorption parameters3,16,17.
Structural parameters
These parameters are defined as cortical width (Ct.Wi µm), which is the combined thickness, in mm, of both cortices; cortical bone area (Ct.B.Ar in mm2); cortical porosity (Ct.Po%), the percentage of intracortical holes in the total cortical area; trabecular thickness (Tb.Th µm), which is the mean distance across individual trabecule; trabecular number (Tb.N/mm), which is the number of trabecule that a line through a trabecular compartment would hit per millimeter of its length; osteocytes number in cortical tissue area per mm2 (Ct.Ot/mm2); and bone volume/tissue volume (BV/TV%), which is the percentage of the total marrow area occupied by trabecular mineralized and unmineralized bone (bone area/tissue area) × 1003,16,17.
Static formation parameters
Static formation parameters comprise the quantity of osteoid matrix, the osteoblast cells covering the bone surface and the MBF and RBF. They are evaluated as osteoid thickness (O.Th µm), which is the distance between the surface of the osteoid seam and mineralized bone (with a width of > 1.5 µm); osteoid surface/bone surface (OS/BS%), which is the percentage of bone surface covered by osteoid; osteoid volume/bone volume (OV/BV%), which is the percentage of bone volume that consists of osteoid; osteoblast surface/bone surface (Ob.S/BS%), which is the percentage of bone surface covered by osteoblast; and wall thickness (W.Th µm from average of the new bone formed per activation event, on bone surface), which is the mean thickness of bone tissue that has been deposited at a bone-forming site3,16,17.
MBF and RBF static parameters
We studied three static parameters evaluating the trabecular bone formation: RBF preceded by resorption (RBF), MBF with no prior resorption (MBR), and the quiescent surface (QS) (no RBF neither MBF). This assessment was based on the bone mineralization front (MF) identified with the toluidine blue stain, which reflected the architecture of the cement lines underlying the active bone-forming surfaces15,18-20. The RBF was identified with toluidine blue as having cement lines scalloped in appearance due to prior osteoclast resorption. The MBF was identified as having underlying smooth cement lines, as if they were generated by direct bone formation on a quiescent bone surface. RBF and MBF were separately quantified as a percentage of total MF on the trabecular surface. The percentage of QS, no RBF, and no MBF area was observed negative with toluidine blue stain, calculated with 100-(MBF+RBF+ES/BS)17,18.
Dynamic formation parameters
Dynamic bone formation parameters yield information about in vivo bone cell function and can only be measured when patients have received two courses of tetracycline label before biopsy. We worked with two basic parameters: the mineralizing surface activity, by tetracycline (MS/BS% is calculated as the length of double tetracycline label plus one half of the single label length perimeter×100) and the mineral appositional rate (MAR), rated in µm/day that the new bone has added by the osteoblast to trabecular surface, calculated as the distance between tetracycline labels divided by the labeling interval in days. The adjusted apposition rate (Aj.AR µm/d) is given by MAR × (MS/OS)/100. The mineralization lag time (MLT/day) is the time interval between the deposition and mineralization of the bone matrix, and is given by O.Th/AJ.AR. Osteoid maturation time (Omt/day) is the time interval between osteoid deposition to be prepared for its mineralization and is given by O.Th/MAR (in human is shorter than MLT). The BFR/BS µm3 × µm2/year is the bone formation rate/bone surface and is given by MAR × (MS/BS) × 3.65 = Activity of bone turnover on a given bone surface. These last four parameters are derived mathematically from the two primary dynamic measures1,3,20.
Bone resorption parameters
Eroded surface/bone surface (ES/BS%) is a static parameter represented by the percentage of eroded spicule surfaces covered with or without osteoclast. Osteoclast surface/bone surface (Oc.S/BS%) is the percentage of bone surface covered by osteoclast. Peritrabecular fibrosis (Pm.Tb.Fb), perimeter trabecular fibrosis, is the histological finding that usually accompanies the high resorption state, and was evaluated as present or absent1,2,10,21, and was expressed as percentage. We compared the histomorphometric parameters between ages and sexes and analyzed the differences.
Statistical analysis
The 19 participants were separated into two age groups: 8-11 years (n = 10) and 12-17 years (n = 9); of this group, 13 were male and 6 were female. The statistical analysis was done with the SPSS program version 23, adapted to windows with interphase graphic.
The histomorphometric parameters (structural, static, dynamic, and resorptic) were described with a median and central dispersion tendency. Because not all histomorphometric parameters were normally distributed, median and ranges are also given.
We used the Mann-Whitney non-parametric test to compare between sexes and ages. Since our sample of normal bone metabolism in children was limited, but assuming that we had a normal distribution, we decided to use a Monte Carlo simulation obtained with 1000 hypothetic children, to verify that the results are similar that those obtained with the histomorphometric results. For more precise results, we used percentiles to calculate RBF and MBF in these pediatric populations; the median and range of each parameter in all the studied population are also given22.
Results
The Z-score was normal in the 100% of children (Z-score = 0.84). On Table 1, we compare blood and urine biochemical parameters of the 19 children, with their control values14,23. We observed that in blood: serum Ca, phosphorus, Mg, creatinine, total alkaline phosphates’, and its osseous enzyme are between normal limits. The calciotropic parameters: vitamin D, calcitriol, and PTH hormones also are normal. The findings in the 24 h. urine: volume, creatinine, P, Ca, and the cross-linked N-telopeptide of type 1 collagen (as marks of bone resorption) are within normal levels too.
Table 1 Biochemical hospital data controls compared with our children studies.
| Blood | Controls (N = 170)21 | Studied children (N = 19) |
|---|---|---|
| Ca (mg/dl) | 9.53 ± 0.68 | 8.72 ± 1.26 |
| Mg (mg/dl) | 2.14 ± 0.31 | 2.29 ± 0.53 |
| P (mg/dl) | 4.11 ± 0.96 | 5.04 ± 0.88 |
| Creatinine (mg/dl) | 0.67 ± 0.30 | 0.57 ± 0.31 |
| ALP (total) (U/L) | < 40023 | 264.9 ± 184.4 |
| ALP (bone enzyme) (%) | < 20%13 | 77.88 ± 13.96% |
| 25(OH)D3 (ng/ml) | 9.0 ± 37.6 | 20.67 ± 7.51 |
| 1,25(OH)2D3 (pg/ml) | 25.1 ± 66.1 | 50.97 ± 20.08 |
| PTH (pg/ml) | 33.94 ± 12.7 | 27.57 ± 13.76 |
| 24 h urine | ||
| Volume ml | 307.59-1,058.33 | 800-1,400 |
| Creatinine/24 h | > 1 mg/24 h | 673.27 ± 655.3 |
| P mg/24 h | 400 a 1300 | 651.4 ± 255.8 |
| CaU/mc | ≤ 4 mg/kg/24 h | 1.73 ± 1.12 |
| Cross-linked N-telop nMBCE/liter | < 20 | 15.6 |
Values are expressed as mean ± SD.
N: cases number, PTH: parathyroid hormone, CaU/mc: urinary calcium/body mass, nMBCE/liter: Nanomoles of bone collagen equivalents/liter, Mg: magnesium, P: phosphorus, Ca: calcium, ALP: alkaline phosphatase, SD: standard deviation.
Table 2 summarizes the mean and the SD, as well the median and ranges of each bone histomorphometric parameters (structural, static bone formation, dynamic bone formation, and bone resorption) from the biopsies of all children.
Table 2 Bone histomorphometric parameters from transiliac bone biopsies in 19 healthy children of 8-17 years.
| Parameters | Parameters abbreviation and units | Values and mean ± SD | Median and range |
|---|---|---|---|
| Structural parameters of bone | Ct.Wi µm | 650.13 ± 243.8 | 594.86 (366.8-1317.5) |
| Ct.B.Ar mm2 | 2.19 ± 0.62 | 2.18 (1.43-3.7) | |
| Ct.Ot/mm2 | 142.94 ± 42.65 | 136.11 (59.5-181.0) | |
| Ct.Po% | 6.2 ± 2.67 | 6.23 (2.11-12.15) | |
| BV/TV% | 22.40 ± 3.17 | 22.73 (16.1-28.0) | |
| Tb.Th µm | 77.2 ± 17.4 | 74.19 (56.9-129.4) | |
| Tb.N/mm | 3.0 ± 0.65 | 2.88 (1.95-4.4) | |
| Static parameters of bone formation | O.Th µm | 7.40 ± 1.56 | 7.84 (4.7-9.8) |
| OS/BS% | 23.69 ± 13.01 | 23.21 (6.2-48.7) | |
| Ob.S/BS% | 9.48 ± 3.0 | 9.28 (5.0-14.9) | |
| OV/BV% | 2.99 ± 2.01 | 2.22 (1.2-8.3) | |
| W. Th µm | 30.49 ± 2.86 | 31.6 (25.45-35.26) | |
| MBF% | 15.92 ± 3.2 | 15.36 (11.18-23) | |
| RBF% | 18.09 ± 4.0 | 18.22 (11.2-24.6) | |
| QS% | 65.06 | 65.66 (56.3-74.1) | |
| Dynamic parameters of bone formation | MS/BS% | 9.57 ± 4.80 | 7.39 (3.9-19.0) |
| MAR µm/d | 0.79 ± 0.32 | 0.75 (0.32-1.6) | |
| Aj.AR µm/d | 0.24 ± 0.2 | 0.21 (0.03-0.65) | |
| Omt µm/d | 9.14 ± 3.0 | 10.97 (2.9-14.8) | |
| MLT µm/d | 18.38 ± 6.3 | 18.32 (7.0-39.3) | |
| BFR/BS µm3/µm2/y | 25.80 ± 13.7 | 26.85 (6.6-51.8) | |
| Static parameters of bone resorption | ES/BS% | 16.9 ± 5.9 | 15.34 (9.6-31.2) |
| Oc.S/BS% | 0.92 ± 0.3 | 0.93 (0.61-1.5) | |
| Fb.Pm.Tb% | Absent | Absent |
Mean ± SD in the central row and the median and range in the right row.
Ct.Wi µm: thickness of the both cortices, Ct.BAr mm2: cortical bone area, Ct.Ot/mm2: osteocytes in cortical tissue, CtPo%:cortical porosity, BV/TV%: bone volume/tissue volume, Tb.Th µm: trabecular thickness, Tb.N/mm: trabecular number/mm, O.Th µm: osteoid thickness, OS/BS%: osteoid surface/bone surface, Ob.S/BS%: osteoblast surface/bone surface, OV/BV%: osteoid volume/bone volume, W.Th µm: wall thickness of the new bone, MBF%: modeling bone formation, RBF%: remodeling bone formation, QS%: quiescent bone surface, MS/BS%: mineralizing bone surface, MAR µm/d: mineral appositional rate, Aj.AR µm/d: adjusted apposition rate, Omt µm/d: osteoid maturation time, MLT µm/d: mineralization lag time, BFR/BS µm3/ µm2/year: activity of bone turnover on a given bone surface, ES/BS%: eroded surface/bone surface, OcS/BS%: osteoclast surface/bone surface, Fb.Pm.Tb: % peritrabecular fibrosis, SD: standard deviation
Seven of the structural bone parameters were analyzed. The results of the histomorphometric structural parameters represent the individual normative values for bone volume and sides. When the BV/TV% and the MAR were compared by ages (Table 3), the oldest group significantly increases (21.20 ± 1.57 vs. 23.73 ± 3.26) as well as the MAR (0.68 ± 0.34 vs. 0.88 ± 0.29 in both with p = 0.043). The rest of the histomorphometry structural parameters are similar.
Table 3 Bone histomorphometric results from the 19 children compared between ages.
| Parameters | Parameters abbreviation and units | Group 1 from 8 to 11 years (N = 10) Mean ± SD | Group 2 from 12 to 17 years (N = 9) Mean ± SD | P |
|---|---|---|---|---|
| Structural parameters | Ct.Pf.Wi µm | 650.89 ± 198.94 | 649.29 ± 298.79 | 0.549 |
| Ct.B.Ar mm2 | 2.38 ± 0.60 | 1.99 ± 0.61 | 0.156 | |
| Ct.Ot/mm2 | 136.66 ± 11.66 | 149.92 ± 61.93 | 0.549 | |
| Ct.Po% | 5.81 ± 1.57 | 6.63 ± 3.58 | 0.518 | |
| BV/TV% | 21.20 ± 2.71 | 23.73 ± 3.26 | 0.043 | |
| Tb. Th µm | 75.9 ± 11.6 | 78.7 ± 23 | 0.730 | |
| Tb. N mm | 2.84 ± 0.54 | 3.16 ± 0.73 | 0.293 | |
| Static parameters of bone formation | OS/BS% | 20.59 ± 11.97 | 27.13 ± 13.95 | 0.315 |
| Ob.S/BS% | 8.49 ± 2.68 | 10.58 ± 3.12 | 0.133 | |
| O.Th mm | 6.76 ± 1.50 | 8.11 ± 1.37 | 0.095 | |
| OV/BV% | 2.37 ± 0.90 | 3.68 ± 2.67 | 0.661 | |
| W.Th µm | 0.31 ± 0.02 | 0.30 ± 0.02 | 0.22 | |
| MBF% | 15.40 ± 3.15 | 16.49 ± 3.43 | 0.549 | |
| RBF% | 18.37 ± 3.67 | 17.77 ± 4.37 | 0.842 | |
| QS% | 65.20 ± 4.98 | 64.91 ± 6.35 | 1.0 | |
| Dynamic parameters of bone formation | MS/BS% | 9.11 ± 4.32 | 10.08 ± 5.51 | 0.842 |
| MAR µm/d | 0.88 ± 0.29 | 0.68 ± 0.34 | 0.043 | |
| AjAr µm/d | 0.25 ± 0.15 | 0.22 ± 0.25 | 0.10 | |
| Omt µm/d | 8.41 ± 3.17 | 9.96 ± 2.90 | 0.211 | |
| MLT µm/d | 17.22 ± 4.82 | 19.67 ± 7.68 | 0.780 | |
| BFR/BS µm3/µm2/y | 28.47 ± 13.06 | 22.83 ± 14.69 | 0.497 | |
| Static parameters of bone resorption | ES/BS% | 17.11 ± 5.57 | 16.81 ± 6.64 | 0.720 |
| Oc.S/BS% | 0.99 ± 0.17 | 0.83 ± 0.49 | 0.497 | |
| Fb.Pm.Tb% | Absent | Absent |
Bone histomorphometric results in Group 1 (8-11 years) compared with Group 2 (12-17 years).
Ct.Wi µm: thickness of the both cortices, Ct.BAr in mm2: cortical bone area, Ct.Ot/mm2: osteocytes in cortical porosity, Ct.Po%: cortical porosity, BV/TV%: bone volume/tissue volume, Tb.Th µm: trabecular thickness, Tb.N/mm: trabecular number/mm, O.Th µm: osteoid thickness, OS/BS%: osteoid surface/bone surface, Ob.S/BS%: osteoblast surface/bone surface, OV/BV%: osteoid volume/bone volume, W.Th mm: wall thickness of the new bone, MBF%: modeling bone formation, RBF%: remodeling bone formation, QS%: quiescent bone surface, MS/BS%: mineralizing bone surface, MAR µm/d: mineral appositional rate, Aj.AR µm/d: adjusted apposition rate, Omt µm/d: osteoid maturation time, MLT µm/d: mineralization lag time, BFR/BS µm3/ µm2/year: activity of bone turnover on a given bone surface, ES/BS%: eroded surface/bone surface, Oc.S/BS%: osteoclast surface/bone surface, Fb.Pm.Tb: % peritrabecular fibrosis.
From the bone static formation parameters, eight were histomorphometric reviewed. The wall thickness (W.Th mm), when compared by gender, was significantly higher in girls (girls 41.3 vs. boys: 37.6 p = 0.02) (Table 4). With the toluidine blue stain, we can observe and identify the bone MF15. The MBF looks as smooth cement lines, which represent 16.0% of the MF. The RBF as scalloped cement lines, which exhibits 18.0% of the MF (Table 2, Figs. 1-3). Even when the RBF parameter is slightly higher that the MBF, there is not statistical difference between them. The QS (without RBF or MBF) represents 65.0% of the MF (Fig. 1). The rest of the static histomorphometry parameters were similar (Table 2, Figs. 1-3).
Table 4 Bone histomorphometric results from the 19 children compared between sexes.
| Parameters | Bone parameters abbreviation units | Boys (N = 13) Mean ± SD | Girls (N = 6) Mean ± SD | P |
|---|---|---|---|---|
| Structural parameters | Ct.Pf.Wi µm | 698.46 ± 255.14 | 545.42 ± 196.49 | 0.152 |
| Ct.B.Ar mm2 | 2.32 ± 0.60 | 1.92 ± 0.62 | 0.179 | |
| CtOt/mm2 | 151.98 ± 45.11 | 123.34 ± 31.46 | 0.282 | |
| Ct.Po% | 6.68 ± 2.85 | 5.16 ± 2.06 | 0.261 | |
| BV/TV% | 21.85 ± 2.71 | 23.58 ± 4.03 | 0.210 | |
| Tb. Th µm | 77.2 ± 18.84 | 77.2 ± 15.51 | 0.898 | |
| Tb. N mm | 2.91 ± 0.49 | 3.17 ± 0.9 | 0.424 | |
| Static parameters of bone formation | OS/BS% | 25.07 ± 12.26 | 20.69 ± 15.28 | 0.416 |
| Ob.S/BS% | 10.15 ± 2.96 | 8.04 ± 2.82 | 0.244 | |
| O.Th mm | 7.28 ± 1.77 | 7.67 ± 1.05 | 0.831 | |
| OV/BV% | 3.16 ± 2.21 | 2.63 ± 1.61 | 0.639 | |
| W.Th µm | 37.6 ± 3.18 | 41.3 ± 2.11 | 0.022 | |
| MBF% | 15.39 ± 3.66 | 17.05 ± 1.87 | 0.127 | |
| RBF% | 17.90 ± 3.77 | 18.49 ± 4.55 | 0.701 | |
| QS% | 65.79 ± 5.53 | 63.48 ± 5.62 | 0.368 | |
| Dynamic parameters of bone formation | MS/BS% | 10.19 ± 4.66 | 8.23 ± 5.27 | 0.323 |
| MAR µm/d | 0.84 ± 0.36 | 0.67 ± 0.20 | 0.323 | |
| MLT µm/d | 16.92 ± 4.37 | 21.54 ± 8.86 | 0.323 | |
| Omt µm/d | 8.56 ± 3.22 | 10.42 ± 2.45 | 0.282 | |
| BFR/BS µm3/µm2/y | 27.64 ± 11.98 | 21.81 ± 17.59 | 0.282 | |
| Static parameters of bone resorption | ES/BS% | 19.19 ± 5.76 | 12.16 ± 2.53 | 0.005 |
| Oc.S/BS% | 0.93 ± 0.35 | 0.89 ± 0.41 | 0.966 | |
| Fb.Pm.Tb | Absent | Absent |
Bone histomorphometric abbreviation parameters and units in the left row. Boys histomorphometric values in the central row and girls in the right row.
Ct.Wi µm: thickness of the both cortices, CtBAr in mm2: cortical bone area, Ct.Ot/mm2: osteocytes in cortical, Ct.Po%: porosity, BV/TV%: bone volume/tissue volume, Tb.Th µm: trabecular thickness, Tb.N/mm: trabecular number/mm, O.Th µm: osteoid thickness, OS/BS%: osteoid surface/bone surface, Ob.S/BS%: osteoblast surface/bone surface, OV/BV%: osteoid volume/bone volume, W.Th µm: wall thickness of the new bone, M/BF%: modeling bone formation, R/BF%: remodeling bone formation, QS/BF%: quiescent bone surface, MS/BS%: mineralizing bone surface, MAR µm/d: mineral appositional rate, Omt µm/d: osteoid maturation time, MLT µm/d: mineralization lag time, BFR/BS µm3/ µm2/year: activity of bone turnover on a given bone surface, ES/BS%: eroded surface/bone surface, Oc.S/BS%: osteoclast surface/bone surface, Fb.Pm.Tb: % peritrabecular fibrosis.

Figure 1 This figure represents the percentage of bone formation analyzed on the mineralization front (stained with toluidine blue) and analyses through the remodeling, the modeling, and the quince zones. The percentage of the remodeling and the modeling bone formation is similar, and the quince zone (free of stain) is the larger. MF: mineralization front, MBF: modeling-based bone formation, RBF: remodeling-based bone formation, QS: quiescent surface.
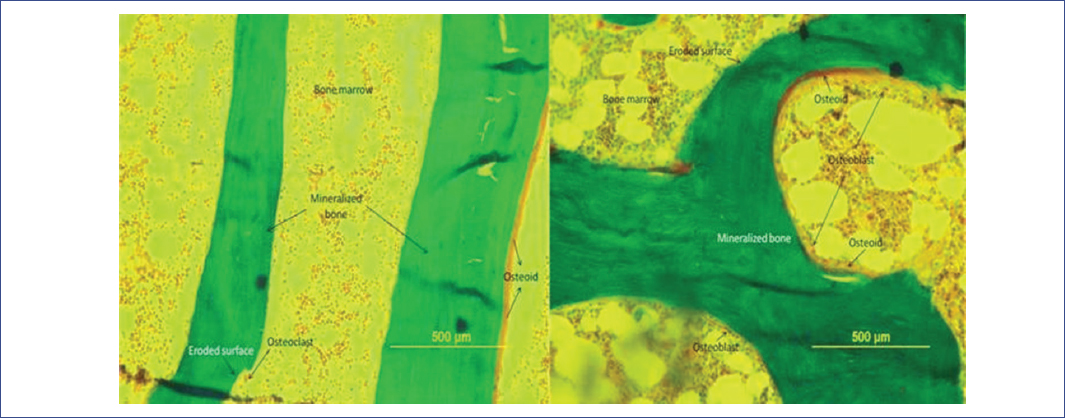
Figure 2 Microphotographs from trabecular bone stains with “Goldner trichrome on children of 11 and 15 years old.” The BV/TV% (21.7 vs. 23.73) is slightly thinner on the younger children (left) when is compared with the older (right). The number of osteoblast and the osteoid volume are normal. Undecalcified bone, 10 × 12.5 mm.

Figure 3 Microphotographs from normal mineralization front, from an 11 and 15 years to old boys stained with toluidine blue and observed as blue-stained lines, underlying the active bone-formation surfaces. The remodeling formation (RBF) surfaces are associated with scalloped cement lines reflecting previous resorption of the remodeling cycle. The modeling bone formation (MBF) is associated with straight cement lines consistent to have been originated on quiescent surface. The quiescent surface (QS) does not exhibit stained surface, which means there is no mineralizing formation activity. Undecalcified bone and photomicroscograph 10.0 × 12.5 mm. Toluidine blue of undecalcified bone.
Dynamic bone formation parameters from all the children can be observed in Table 2. We evaluate six dynamic parameters. The mineral apposition rate (MAR) was significantly increased in the youngest group compared the oldest (0.88 ± 2.9 vs. 0.68 ± 34 p = 0.043) (Table 3). The rest of the dynamic histomorphometric parameters were similar.
We analyzed only three histomorphometric parameters to evaluate the bone metabolic resorption. The eroded surface/bone surface (ES/BS%) exhibits a significant difference when compared between genders (ES/BS%; boys 19.19 ± 5.76 vs. girls 12.16 ± 2.53; p = 0.005) (Table 4). Other bone histomorphometric gender parameter comparisons yielded no significant differences. The osteoclast percentage on the trabecular surface (Oc.S/BS%) and the percentage of peritrabecular fibrosis were similar. On Table 5, the Monte Carlo simulation with 1000 iterations and handled with percentiles from 5% to 95%, the histomorphometry parameters between 50% and 90% verified a tendency of normal distribution, which helped to identified histopathological abnormalities in the children.
Table 5 Percentile to show the distribution of histomorphometric parameters using Monte Carlo simulations with 1000 iterations.
| Abbreviations | 5% | 10% | 50% | 90% | 95% |
|---|---|---|---|---|---|
| BV/TV | 19.65 | 20.54 | 23.05 | 26.04 | 26.84 |
| Tb.Th | 37.65 | 52.22 | 83.9 | 105.43 | 110.3 |
| Tb.N | 1.88 | 2.11 | 2.98 | 3.78 | 3.99 |
| O.Th | 5.21 | 5.66 | 7.41 | 9.17 | 9.63 |
| OS/BS | 13.57 | 16.39 | 26.28 | 35.69 | 37.78 |
| OV/BV | 1.5 | 1.76 | 2.59 | 3.48 | 3.78 |
| Ob.S/BS | 5.85 | 6.63 | 9.93 | 13.18 | 14.17 |
| MS/BS | 6.4 | 7.86 | 12.96 | 18.36 | 19.34 |
| MAR | 0.35 | 0.47 | 0.93 | 1.38 | 1.5 |
| Omt | 3.08 | 4.41 | 9.18 | 13.92 | 15.28 |
| Mlt | 13.37 | 14.59 | 18.77 | 22.8 | 23.45 |
| BFR/BS | 25.48 | 28 | 37.31 | 46.53 | 49.79 |
| ES/BS | 0.33 | 1.29 | 4.72 | 7.99 | 8.92 |
| Oc.S/BS | 0.52 | 0.63 | 0.99 | 1.34 | 1.44 |
| MFB | 11.64 | 13.06 | 15.36 | 16.62 | 17.02 |
| RFB | 11.02 | 14.11 | 18.22 | 20.55 | 23.27 |
| QS | 58.41 | 60.94 | 65.87 | 71.54 | 74.11 |
BV/TV%: bone volume/tissue volume, Tb.Th µm: trabecular thickness, Tb.N/mm: trabecular number/mm, O.Th µm: osteoid thickness, OS/BS%: osteoid surface/bone surface, Ob.S/BS%: osteoblast surface/bone surface, OV/BV%: osteoid volume/bone volume, MS/BS%: mineralizing bone surface, MAR µm/d: mineral appositional rate, Omt µm/d: osteoid maturation time, MLT µm/d: mineralization lag time, BFR/BS µm3/µm2/year: activity of bone turnover on a given bone surface, ES/BS%: eroded surface/bone surface, Oc.S/BS%: osteoclast surface/bone surface, MBF%: modeling bone formation, RBF%: remodeling bone formation, QS%: quiescent bone surface.
Discussion
Since reference data for bone metabolic histomorphometric children data are poor, we tried to fill this gap, testing histomorphometric results obtained from 19 children, apparently with no evidence of metabolic bone disease. On Table 1, we observe that their serum electrolytes, bone alkaline phosphates, and calciotropic hormones were normal, and in urine, the electrolytes and the cross-linked N-telopeptide of type 1 collagen were within normal limits, so the children clinically and biochemically were apparently healthy.
The structural histomorphometric parameters observed in Table 2 are similar to other reference material reports, using a similar histomorphometric methodology. We only found two parameter results that differed from thus observed by Glorieux et al. In our study, the bone trabecular thickness appears thinner (Tb.Th µm = 77.2±17.4 vs. 139 ± 28) and the number of bone trabecular increased (Tb.N mm = 3.0 ± 0.65 vs. 1.72 ± 0.23). The rest of the histomorphometric parameters were similar, though we think the low thickness of the bone trabecular is compensated by the increase in its number, or might have a geographic or ethnic cause.
The measure of the cortical volume, its porosity, and the number of its osteocytes are rarely mentioned, but these histomorphometric parameters are an important data to be correlated with fractures, phosphaturias, and bone volume. Observing the structural histomorphometric parameters, classified by ages (Table 3), we found that the children in the oldest group exhibited a significant greater bone volume than that observed in the youngest group (BV/TV% = 21.20 ± 2.71 vs. 23.73 ± 3.26; p = 0.043); this finding of bone volume increase is an issue normally seen in the oldest group3,20. The W.Th measure by gender was significantly thicker in the girls (Table 4) and was similar compared by ages (Table 3). In the static formation parameters, comparing the amount of osteoid on the bone surface and the number of osteoblast, the results are similar too.
To evaluate the MF and its cement lines apparently for the 1st time, we used the toluidine blue stain15. With this method, if the lines are scalloped, they reflect an initial resorption phase of the remodeling cycle (RBF), whereas if they are straight, they represent MBF, which is associated with a previously QS17,18 (Figs. 2 and 3). Using these techniques, the proportion of active MBF was 16% and the RBF was 18%, statistically not different (Fig. 1). These findings suggested that the normal bone formation developed on the trabecular area by two different mechanisms: remodeling and modeling, and their activity is similar. Recently, some authors have started to identify the MF with tetracycline to measure the MBF and RBF15,17,18. The results with the toluidine blue stain are similar to Villanueva’s15 and easier to interpret. This means that we have to emphasize this finding to evaluate the bone formation activity in each bone histomorphometric study and try to investigate the biochemical markers to correlate them, but up to date, there is no specific biochemical marker for the MBF. Dynamic bone formation parameters can be observed in Table 2. They yield information on in vivo bone cell function only when the children or the patient have received dual labeling with tetracycline before biopsy20. We evaluate six dynamic parameters, two of them are basic. One is the surface extent of mineralization activity per bone surface identified with the tetracycline MS/BS% (9.57 ± 4.80) and the second is the MAR or the distance between two tetracycline labels divided by the length of the labeling interval (0.79 ± 0.32). When we compared between ages in Table 3, the MAR is significantly higher in the youngest group (0.88 ± 0.29 vs. 0.68± 0.34 µm/d; p = 0.043); this is explained by a more active osteoid formation by the osteoblast in the youngest group16,17,19. The MAR could be different too, with the dosage of the MF marker3. The other four histomorphometric parameters are the adjusted opposition rate (Aj.AR), the MLT, osteoid maturation time (Omt), and the bone formation rate per bone surface (BFR/BS)1,10. Comparing between ages, there were no differences.
We analyzed only three parameters to evaluate the bone metabolic resorption. The first one consists in counting the percent of eroded trabecular perimeter or eroded surface/bone surface (ES/BS). A significant difference in histomorphometric parameters between genders was found when we compared eroded surface/bone surface from the boys group versus girls (boys 19.19 ± 5.76 vs. girls12.16 ± 2.53, p = 0.005) (Table 4). This measure is rather subjective for interpretation3, but in the present study, erosion surface observed by golden stained was similar to that quantified with toluidine blue stain (ES/ES% = 17 vs. RBF% = 18). The rest of the gender histomorphometric parameters (Oc.S/BS and the Fb.Pm.Tb)21,24,25 yielded not significant differences. The individual parameter forms are reported in Table 2, and these values represent our histomorphometric bone reference data.
Our study has several limitations. The children number was small. The biomarker profiles are consistence with the histomorphometry findings, but their clinical studies were limited, for instance, the pubertal stages were not evaluated. The effect of toluidine blue at the cortical area was not described and could be an interesting area for future investigation. Finally, characterizing the MF on MBF across human ages and across species could be interesting3,9.
In summary, the present report exhibited the bone histomorphometry reference data for children between 8 and 17 years. There were few differences related to their ages and gender. The assessment of MBF and RBF with toluidine blue stain is reported, and they had similar extension, suggesting equal activity in the normal children (MBF% = 16 and the RBF% = 18) (Table 2). Additional studies are needed to elucidate the cellular and molecular mechanisms regulating the activity of bone formation. Children with fractures not explained with non-invasive examination should have a bone biopsy that provides data that cannot be obtained in any other way. We believe that all these bone histomorphometric parameters for children of this age and with these techniques can be used as bone histomorphometric reference data.

