


 nova página do texto(beta)
 Inglês (pdf)
 Artigo em XML
 Referências do artigo
 Enviar este artigo por email
 Citado por SciELO
  Similares em
SciELO
Similares em
SciELO 
 Permalink
I. Introduction
Many factors affect the essence and quality of education. Teacher competence is a crucial factor that directly affects educational quality. Teachers should have certain competencies to offer a high quality education. It is possible to enhance the quality of education by identifying the competencies that teachers, who play a key role in this process, should possess, and by offering these competencies to teachers through pre-service or in-service training programs (Konokman & Yelken 2013). Effective communication and speaking skills are an attribute every qualified teacher should have.
One of the most basic functions of today's teachers is to guide students during class, and by making them active in class, bring their students’ behavior in line with the school’s target. From this perspective, teachers should be trained to meet current requirements. As many scholars have stated, the quality of teachers and teaching is undoubtedly among the most important factors shaping students’ learning (Ingersoll, 2004, p. 1; Shieh & Demirkol, 2014; Ozkan, Albayrak, & Berber, 2005; Hosgorur & Apikoglu, 2013). At this point, the importance of teacher training programs has become clear; however, as Morgan 1989) stated, one of the most neglected aspects of teacher training is preparation in the various communication skills needed by good teachers in today's schools. Hargreaves (1995) denounced this situation as it overlooks the emotional nature of teaching.
One important factor in increasing the impact on students is being able to communicate effectively in class. Many studies have reported that teachers with effective communication skills are very successful in establishing positive relationships with students and making them love the lesson (Hamre & Pianta, 1999; Sen & Erisen, 2002; Guskey & Huberman, 1995). Therefore, (Andrzejewski 2008, 171) argues that this should constitute the sole focus of teacher preparation programs. Some of the basic skills that teachers will inevitably use in class such as planning, instruction, classroom management, communication, reflection, and assessment can be improved through practice. Communication and speaking are key teaching skills that can be improved through practice in university training programs.
The main purpose of this research is to adapt and validate the Turkish version of the Personal Report of Public Speaking Anxiety (PRPSA) for teacher candidates. The validation process involves accumulating evidence to provide a sound scientific basis for the proposed score interpretations (AERA, APA, & NCME, 1999, as cited in Goodwin & Leech, 2003). PSA can be described as “a situation-specific social anxiety that arises from the real or anticipated enactment of an oral presentation” (Bodie, 2010, p. 72). Public speaking ability is an important skill for teachers, who should be trained in this area. As stressed by Vangelisti, Daly, & Friedrich (2013), constructing speeches with accuracy, order, and rigor is vital. Helping individuals to become capable, responsible speakers helps them to become capable, responsible thinkers. However, according to Furmark et al. (1999), about 77% of the general population fears public speaking. A fear of public speaking causes anxiety and a decrease in achievement and motivation. There can be various reasons for public speaking anxiety, which causes individuals to experience negative feelings such as confusion, trembling, anxiety, tachycardia, a fear of making mistakes, shaking knees, a quivering voice, nausea, low performance in speaking, and a failure to express themselves (American Psychiatric Association, 2000, as cited in Hunter, Westwick, & Haleta, 2014; Gaibani & Elmenfi, 2014). It can be said that adapting the public speaking anxiety scale into Turkish will be beneficial due to the high rate of public speaking anxiety and the resulting pressure experienced by individuals. Indeed, ascertaining teacher candidates’ public speaking anxiety levels may help to solve the problems that novice teachers face during the first year of their professional career. The findings of this study may help to define teacher candidates’ psa levels and also evaluate the capacity of teacher training programs to provide teacher candidates with the speaking skills they will badly need when teaching. Considering that problems in teacher training are universal and similar in most countries, the result of the study will enable educators to consider teacher training programs at university level in a broader framework.
II. Method
This section of the study will explain the basic characteristics of the participants, the data collection instrument, and the procedure followed by the researchers.
2.1 Study sample
The study sample was composed of 322 randomly-sampled teacher candidates from universities in the Elazig, Bartın and Kahramanmaras provinces of Turkey in the 2014-2015 academic year.
Table I Demographic characteristics of teacher candidates
| Branch | Frequency | % |
|---|---|---|
| Classroom teachers | 20 | 6.2 |
| Social science teachers | 117 | 36.3 |
| Science teachers | 134 | 41.6 |
| Others | 51 | 15.8 |
| Gender | Frequency | % |
| Male | 122 | 37.9 |
| Female | 200 | 62.1 |
| Age | Frequency | % |
| 18-23 | 190 | 59.0 |
| 24-29 | 102 | 31.7 |
| 30+ | 30 | 9.3 |
| Total | 322 | 100.0 |
It is evident from Table I that the majority of the participants are science teachers. Teachers under “others” consist of physical training and sports teachers and arts and visual arts teachers. The number of female teacher candidates participating in the research is higher than the number of male teacher candidates. The fact that the teaching profession is generally preferred by women has led to an increase in the number of females in the field (Ingersoll, Merrill, & Stuckey, 2014; Ozoğlu, Gur, & Altinoglu, 2013). Table I also displays the age interval of the participants. It is clear that the majority of participants are aged between 18 and 23. Those over 30 years old might be second-career seekers who are not satisfied with their current jobs.
2.2 Data collection instrument
The researchers gathered data through the PRPSA developed by McCroskey (1970) and Richmond and McCroskey (1992). The questionnaire consists of 34 questions that measure feelings associated with giving a presentation and has been reported as unidimensional. Participants were asked to indicate the degree to which the statements apply to them by marking whether they strongly agree (1), agree (2), are undecided (3), disagree (4), or strongly disagree (5) with each statement (Kostić-Bobanović, 2007). According to Richmond and McCroskey (1992), normalized PRPSA scores are divided into five categories (numbers in parentheses are the percentages of a normalized population fitting each category): scores between 34-84 indicate low anxiety (5%); 85-92, moderately low anxiety (5%); 93-110, moderate anxiety (20%); 111-119, moderately high anxiety (30%); and 120-170, high anxiety (40%). Mean scores on the PRPSA have rarely been reported, as the instrument was designed and used primarily for identifying highly anxious students. While 22 of the 34 items in the scale express a negative opinion, 12 items have positive meanings and were reverse-coded. This was the case for items 4, 6, 7, 8, 11, 12, 15, 16, 17, 18, 24, and 26. Thus, the scores obtained from the scale were collected in a single direction.
2.3 Procedure and findings
In the first phase of the adaptation process, the original English forms were translated into Turkish by two expert faculty members from the School of Education and an English language expert from the School of Foreign Languages. Then, the Turkish forms were back-translated and the language consistency between the two forms was reviewed. After the relevant corrections, the translated forms were examined by two faculty members competent in the field of measurement and evaluation. Hambleton and Kanjee (1993) mention that translators who are familiar with the target group and their language, who understand the content of the instrument and have received some training in instrument development, are most capable of producing a first-rate translation.
In the next phase, the latest form of the scale was used to collect data. For construct validity, a confirmatory factor analysis was conducted, before which the Kolmogorov-Smirnov test results were examined for each item in the PRPSA scale. According to the analysis results, normality was ensured for each item (P>0.05). The scale's internal consistency reliability, item analysis, and corrected item-total correlations were examined and the validity and reliability analysis was performed using SPSS 23.0 and Mplus. After the Item-Total Statistics analysis, 3 items were excluded from the form as the corrected item-total correlation loadings of these items were below .30. The item-total statistics analysis was repeated on 31 items.
Table II Item-total descriptive statistics results
| Item | Mean | Std. Deviation | Scale Mean if Item Deleted | Scale Variance if Item Deleted | Corrected Item-Total Correlation |
|---|---|---|---|---|---|
| 1 | 2.93 | 1.301 | 94.3146 | 504.035 | .614 |
| 2 | 2.71 | 1.263 | 94.5296 | 503.169 | .650 |
| 3 | 2.70 | 1.181 | 94.5452 | 508.942 | .587 |
| 4 | 3.19 | 1.215 | 94.0530 | 506.738 | .610 |
| 5 | 2.59 | 1.227 | 94.6449 | 509.873 | .546 |
| 6 | 3.20 | 1.181 | 94.0467 | 519.588 | .383 |
| 7 | 3.12 | 1.226 | 94.1277 | 503.906 | .658 |
| 8 | 2.87 | 1.275 | 94.3707 | 509.215 | .535 |
| 9 | 2.91 | 1.195 | 94.3333 | 506.267 | .631 |
| 10 | 2.44 | 1.227 | 94.8162 | 516.425 | .428 |
| 11 | 3.17 | 1.218 | 94.0810 | 515.618 | .443 |
| 12 | 3.48 | 1.192 | 93.7632 | 516.888 | .430 |
| 13 | 2.62 | 1.079 | 94.6293 | 518.015 | .457 |
| 14 | 2.61 | 1.002 | 94.6355 | 518.314 | .489 |
| 15 | 2.38 | 1.007 | 94.8660 | 518.923 | .472 |
| 16 | 2.69 | 1.206 | 94.5545 | 508.079 | .590 |
| 17 | 2.91 | 1.294 | 94.3302 | 509.584 | .520 |
| 18 | 3.41 | 1.233 | 93.8380 | 501.742 | .694 |
| 19 | 3.04 | 1.232 | 94.2056 | 503.401 | .664 |
| 20 | 2.96 | 1.221 | 94.2866 | 500.574 | .723 |
| 21 | 3.17 | 1.211 | 94.0779 | 505.772 | .631 |
| 22 | 2.49 | 1.033 | 94.7570 | 516.235 | .518 |
| 23 | 3.37 | 1.098 | 93.8692 | 515.883 | .493 |
| 24 | 2.69 | 1.228 | 94.5514 | 507.411 | .591 |
| 25 | 2.87 | 1.226 | 94.3707 | 502.790 | .681 |
| 26 | 2.84 | 1.186 | 94.4050 | 509.167 | .580 |
| 27 | 2.37 | 1.178 | 94.8785 | 509.407 | .581 |
| 28 | 2.63 | 1.350 | 94.6075 | 512.802 | .442 |
| 29 | 3.25 | 1.272 | 93.9938 | 501.300 | .682 |
| 30 | 3.10 | 1.272 | 94.1526 | 504.742 | .616 |
| 31 | 3.01 | 1.318 | 94.2368 | 502.538 | .632 |
Table II displays the values of the descriptive statistics and the impact on the reliability coefficient if items are excluded from the scale. The arithmetic mean, variance and corrected item-total correlation values can be observed for each item. According to Table II, each item has an equal contribution to the scale. These results suggest that all items contribute to the overall score reliability of the scale.
The Kaiser-Meyer-Olkin value was examined before conducting the exploratory factor analysis and the KMO value was observed to be .945. The Bartlett’s test result indicates that an exploratory factor analysis can be conducted (p=.00<.05). Therefore, an exploratory factor analysis was conducted on the data set based on the varimax principal component analysis method. The means of the explained variance and eigenvalues, according to the exploratory factor analysis, are given in Table III.
Table III Eigenvalues and explained variance according to the results of the exploratory factor analysis
| Components | Eigenvalues | % Variance |
|---|---|---|
| 1 | 11.556 | 37.278 |
| 2 | 2.573 | 8.300 |
| 3 | 1.458 | 4.702 |
| 4 | 1.196 | 3.858 |
It can be concluded from Table III that there are four components with eigenvalues above 1. This suggests that the scale may be four-dimensional. However, when the eigenvalues of the factors and explained variance are examined, the eigenvalue of the first factor and explained variance are approximately five times greater than the other three. As the first factor explained most of the variance, the scale can be thought of as unidimensional. The original form of the scale was also designed as a single-factor scale. (Slocum-Gori & Zumbo, 2011; Kaya, 2005, as cited in Duru & Balkis, 2007; Kubiatko & Arik, 2014; Gorsuch, 2003, as cited in Slocom, 2005, p. 33; Yirci, Karaköse, Uygun, & Özdemir, 2016; Williams, Browns, & Onsman, 2012).
In order to verify the scale’s single-factor structure, a confirmatory factorial analysis was carried out using the Mplus software. The Mplus software helps users in tasks such as developing a structural equation model, operating the model and evaluating multiple-level data (Muthén & Muthén, 1998-2010; Byrne, 2013). In a confirmatory factor analysis, the proposed model is examined and evaluated according to several indices. Various model fit indices are used to evaluate how well the proposed model fits the data. Examining several statistical and practical indices in order to determine whether or not to reject a particular model is very important (Brown, 2006; Heck & Thomas, 2015, p. 51). The values of some goodness-of-fit indices are more or less standardized as a range of 0-1.0, where a value of 1.0 indicates the best fit (Kline, 2015). Here are some indices and their value ranges showing acceptable model fit: 0.05≤RMSEA≤0.08, 0.05≤SRMR≤0.10, 0.95≤CFI≤0.97, 0.90≤TLI ≤0.10, 0.94≤ NFI≤0.90 (Schermelleh-Engel, Moosbrugger & Müller, 2003; Kline, 2011; Hooper, Coughlan, & Mullen, 2008; Wang & Wang, 2012). The fit indices in this study suggest that the model has a good fit (x²=840.891, df=403, RMSEA=.008, NFI=.94, TLI=.88, SRMR=.059) (Hu & Bentler, 1999). The Cronbach’s alpha coefficient for the scale is α=.94.
The path diagram for the exploratory factor analysis conducted with the Mplus software is shown in Figure 1. It can be observed that the single-factor model is valid and the factor loadings of the scale range between .39 and .92.
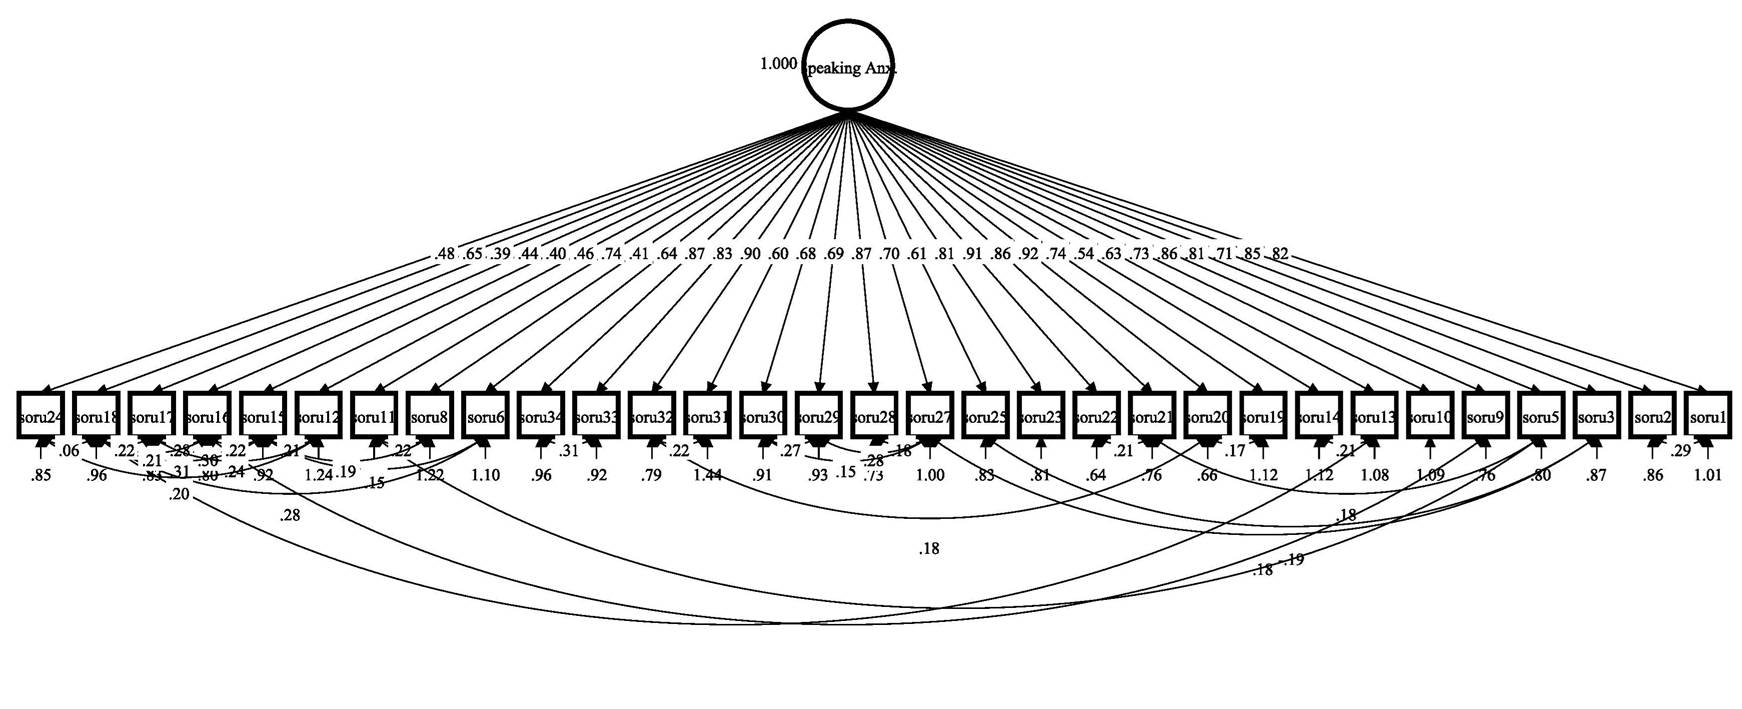
Fit indices: X²=840.891, df=403, RMSEA= .008, NFI=.94, TLI=.88, SRMR=.059
Figure 1 Path diagram for the unidimensional model of the PRPSA
The study also examined whether or not the gender variable differs significantly, with the aim of adapting the PRPSA scale into Turkish. The results of the independent sample t-test are given in Table IV.
Table IV Public Speaking Anxiety Scale and results of the t-test on the gender variable
| Gender | n |
|
SD | t | P | Levene’s test | |
|---|---|---|---|---|---|---|---|
| f | p | ||||||
| Male | 122 | 2.70 | .594 | -3.281 | .001 | 3.475 | .063 |
| Female | 200 | 2.96 | .717 | ||||
Table IV shows a significant difference
between genders in the mean scores obtained from the Public Speaking Anxiety
Scale. Female participants’ mean scores (
During data collection, the participants were asked if they had received any lessons regarding communication or speaking skills in college. The results for this question can be seen in Table V.
Table V Did you have a lesson on “communication” in college?
| Student response | Frequency | % |
|---|---|---|
| Yes | 116 | 36.0 |
| No | 206 | 64.0 |
| Total | 322 | 100.0 |
The results in Table V show that most teacher candidates in Turkey (64%) have not taken a lesson on communication, suggesting that curricula in teacher training departments in universities should be redesigned to include compulsory lessons on communication.
III. Conclusion
The main purpose of this research is to adapt and validate the Turkish version of the PRPSA for teacher candidates. In this respect, the effectiveness of equipping students with communication and speaking skills in current teacher training programs in universities is clear. The study sample was composed of 322 teacher candidates from Elazig, Bartın and Kahramanmaras. Data was collected through the PRPSA scale from students selected by random sampling. This data was then analyzed with the SPSS and Mplus software.
The coefficient for the Turkish version of the scale indicates that it has adequate reliability (Sipahi, Yurtkoru, & Çinko, 2008). The findings of the reliability and validity analysis show that the Turkish version of the PRPSA is ready for use in a Turkish context. The latest form of the Turkish version of the scale consists of 31 items and possible scores range from 31 to 155. The higher the score, the higher the participant’s degree of public speaking anxiety. According to the analysis, Turkish teacher candidates show a moderately high level of public speaking anxiety. This suggests that traditional teacher training programs in Turkey are insufficient to equip teacher candidates with the necessary speaking skills. From this perspective, it seems necessary to adapt teacher training programs urgently.
The study also has a few limitations. Firstly, the study sample only included teacher candidates studying in college. Future studies could examine the public speaking anxiety levels of novice trainee teachers. According to the confirmatory factor analysis of the single-factor structure of the PRPSA scale, the scale has acceptable fit values. As a result, it could be used in future studies to research public speaking anxiety levels in university students studying in various other socially valued professional degree programs.

