


 nova página do texto(beta)
 Inglês (pdf)
 Artigo em XML
 Referências do artigo
 Enviar este artigo por email
 Citado por SciELO
  Similares em
SciELO
Similares em
SciELO 
 Permalink
Introduction
Palpitations are one of the most common reasons for consulting a cardiologist, together with chest pain, dyspnea and side effects of medication. The psychosomatic etiology is usually the most common in the absence of structural heart damage and anxiety is probably the most common non-cardiac cause1. The presence of any type of tachyarrhythmia is the most common form in patients with heart disease, highlighting in importance the persistent forms mostly of ventricular origin and some atrial forms, particularly atrial fibrillation and atrial flutter due to their frequency, possible complications and different treatment alternatives. An echocardiography is essential for proper initial diagnosis stratification, together with an accurate clinical history, electrocardiographic analysis and outpatient monitoring systems, while the availability of state-of-the-art equipment should make an additional contribution to this first diagnostic and prognostic approach and subsequent therapeutic decisions2.
In recent decades, significant advances have been made in the knowledge and treatment options for atrial fibrillation and flutter given its associated morbidity and mortality in certain risk groups. Various physio pathological mechanisms involved in the triggering, maintenance and concluding of the arrhythmia have been checked, and the risk factors involved in the genesis including frequent atrial extra systoles appear to significantly influence the apparently healthy general population3,4.
We know less about the presence of recurrent atrial bursts, frequently excluded in Holter analyses that are more focused on the quantification of supraventricular extra systoles and the appearance of atrial fibrillation (AF) in various population groups although this seems to be an independent risk factor similar to high-density extrasystoles5 with similar prognostic implications in the general population6. However, study of left and right atrial function has continued to advance, fundamentally at the expense of the echography-doppler with myocardial deformation technology (Strain), and new electrophysiological mapping systems usually used in tertiary hospitals and for mainly investigational and therapeutic purposes.
Classic concepts related to left atrial function based on the electrocardiography and the basic echocardiography-doppler were developed, with the aim of quantitatively defining the adaptive responses to “stress” factors of the wall, promoters of a series of reactions to variations in pressure and/or volume leading to structural, functional, electrical, metabolic and neurohormonal remodeling7. The atrial extra systole interferes with the atrial-ventricular filling sequence and its duration and frequency determine changes to the intra-auricular pressure/volume promoting this remodeling and its consequences. Strain values in the atrial reservoir phase during the left ventricular systole have proven useful for the study of the left ventricular diastolic function, and its early dysfunction8. Short forms of recurrent atrial arrhythmias could either alter it directly or act as a marker of any type of disorder affecting diastolic function. In addition, their possible association as an independent factor of cardiovascular mortality or for any reason in the long-term follow-up9, the frequently asymptomatic presence, and the close association with hypertension, enhance the value of advanced echocardiography in primary cardiology.
Our study recruited patients with low comorbidity and no evidence of structural heart disease that strengthens the independent role of atrial extra systoles and forms of short atrial tachyarrhythmia in relation to left atrial function parameters. Through the analysis of the left atrial strain using 2D technology we try to obtain useful parameters to identify patients with greater risk of suffering more severe forms of atrial arrhythmia.
Materials and methods
Patient selection
Patients between 18-75 (mean age of 60) years old with palpitations from an outpatient cardiology unit over a period covering July 2019 to September 2021, who had attended on their own decision or were referred by their referring family doctor or by our hospital. All individuals were subject to a complete medical history review, as well as an examination including a psychological assessment questionnaire, electrocardiogram, 3-day Holter and echocardiogram. Structural heart disease was ruled out in all subjects following the necessary complementary tests required by the clinic and patients were excluded if they had previously been diagnosed with any of the following atrial flutter and/or fibrillation, fulguration or atrial ablation, ventricular arrhythmias in bursts or more, basal electrocardiograph alterations as well as any degree of atrial-ventricular blocking, complete blocking of the left branch, coronary heart disease, myocardiopathies, any type of stenotic valve disease or valve regurgitation more significant than mild, pericardium diseases, pacemakers, atrial surgery renal failure, known neoplastic disease and patients with a psychiatric disorder. In this study, we selected patients who were not suffering from organic heart disease, while avoiding the effects of immaturity and aging on left atrial function that would result in a less homogeneous study group and less reproducible results10. In addition, with more advanced ages we assume a greater comorbidity, fundamentally in relation to a more developed hypertension and diabetes with greater impairment of diastolic function.
The study population comprised those patients who presented palpitations with no repetitive ectopic atrial forms, patients with short-form recurrent attacks (RUNs) as well as at least four beats of less than thirty seconds in duration and forms of paroxysmal atrial fibrillation (PAF) with a duration greater than thirty seconds and less than seven days, isolated (a single episode) or repetitive (more than one episode during subsequent follow-up). We studied 270 patients divided into the following groups:
Without repetitive atrial forms (control group) (78 patients), RUNs (162 patients), Isolated PAF (7 patients) and Recurrent PAF (23 patients).
All patients received antihypertensive therapy if necessary, with ACE inhibitors or ARA II adding flecainide and/or beta-blockers at intermediate doses in RUNs cases or PAF cases. 77% of patients with PAF relapsed and underwent selective ablation of pulmonary veins. Only 13% of patients were controlled with medication during the follow-up period. None of the patients with RUNs had clinical worsening or the appearance of PAF in the follow-up holters. The programming of the follow-up three-day holters was carried out according to the symptomatic and ambulatory electrocardiographic evolution.
Clinical history
The usual face to face medical history data was obtained at each in-person medical appointment including demographic data and a simple psychiatric questionnaire: The Hospital Anxiety and Depression Scale (HADS) provides fourteen multiple-choice questions relating to states of anxiety and depression with subscales based on different scores, considering values over 11 as anxiety or depression. These subscales have also proven useful as a measure of the severity of emotional disorders in medical research, enabling more comprehensive care for the patient. The blood pressure measurement was taken at least twice during the consultation after five minutes of rest in the decubitus position with a manual cuff sensing the left brachial artery and various measurements taken on an outpatient basis or by the family doctor. We use the classification from the American Heart Association (AHA) from 2018, which considers normal values less than 120/80 mmHg, elevated blood pressure as values between 120-129 and below 80 mmHg, stage 1 hypertension with values 130-139/80-89 mmHg, stage 2 hypertension with values of 140 or over/90 or over, retaining the values of 140/90 mmHg as a cut-off point for the classification of embolic and cardiovascular risk CHA2DS2-VASc. Patients were considered diabetic if they presented limit values after fasting of 126 mg/dl (7 mmol/l) and no subjects were being treated with insulin. Body surface area values were considered normal up to 1.9 m2 in men and 1.6 m2 in women.
Electrocardiogram
An electrocardiogram was performed on all patients, Schiller AT-10 plus with 12 leads with automatic analysis including P wave duration (ms), S wave in V1 (mV) resulting from the correlation between the amplitude of terminal deflection multiplied by its duration (10) and Sokolov-Lyon criteria (mV). The electromechanical dispersion is calculated manually by subtracting the minimum P wave duration value from its maximum value. Patients with bursts of atrial extrasystoles or atrial fibrillation were reported. Recordings were taken at a velocity of 25 mm/s and a voltage of 10 mm/mV by the same investigator.
Outpatient electrocardiographic recording (Holter)
At the outset, all patients underwent continuous Holter monitoring over 3 days with DMS CardioScan II Premier and NorthEast Monitoring Inc HE/LX analysis 6.0C Enhanced devices with all the recordings being checked manually. This was followed in the consultancy with clinical and electrocardiographic tests, and further Holter monitoring was carried out as decided by the cardiologist. Short forms of atrial extra systole were considered as the existence of four or more beats with a duration of less than thirty seconds and paroxysmal atrial fibrillation with periods of greater arrhythmia of up to seven days. The existence or lack of atrial and/or ventricular extra systoles was noted, considering a slight incidence to be less than 1% of the beats. A check was performed on whether the arrhythmia appeared on one, two or three days. We included mean frequency values and SDANN in the study in relation to the time-related variability of the RR intervals with parameters related to the function of the autonomic nervous system.
Echocardiography
The recordings were taken by the same expert cardiologist with an official qualification in advanced echocardiography and having performed more than three thousand atrial myocardial deformation studies (atrial strain). A Siemens SC 2000ultrasound was used, software version 5.1, year 2018, with sensors 4V1c (1.25-4.5 Mhz for 2D-doppler-transthoracic strain study) and 4Z1c (1.5-3.5 Mhz for real-time 3D volumetric study). The guidelines of the American Society of Echocardiography (ASE) were followed to obtain the indexed left ventricular dimensions, volumes and mass. The diastolic function study focused on the septal E/e’ values obtained with the tissue doppler with a cut-off value > 15 associated with an increase in left ventricular filling pressure and the attainment of indexed left atrium volumes. The maximum and minimum 2D volumes were determined using Simpson’s biplane method. The 3D volumes were obtained using the real-time phased array probe with a sequence of two beats in apical four-chamber projection focused on the left atrium tracing the contours manually during the diastole before and after the atrial contraction (A wave) and in the systole just before the opening of the mitral valve. No geometric assumptions were made. Finally, maximum tricuspid regurgitation velocity values were recorded using a continuous doppler.
For the study of the longitudinal myocardial deformity of the left atrial wall we used the Siemens e Sie VVI Velocity Vector Imaging Technology 2D speckle tracking software using two consecutive beats between 30 and 90 frames per cycle in the apical four-chamber projection, making a single contour of the endocardium and avoiding the entry of the pulmonary veins and the left appendage. We preselected the division of the atrium into three zones: septal, lateral and posterior eliminating the latter from the analysis thus automatically obtaining the segmental strain curves in percentage/time, the global strain, global reservoir strain and the maximum longitudinal strain peaks of the segmental reservoir (PLAS). We also recording the average value of the walls and the lateral wall independently, the left ventricular ejection fraction (emptying), the time dispersion asynchrony from the start of the electrocardiograph R wave and the maximum longitudinal strain peaks and the maximum and minimum volumes. The percentage values of the active atrial contraction were obtained manually from the graphs of the strain curves. We also calculated the electromechanical conduction interval of the atrium (PA-DTI) measuring the time in milliseconds between the start of the electrocardiograph P wave and the displacement of the lateral wall just below the posterior mitral annulus in the maximum peak of the A wave for atrial contraction. Finally, we established the wall stiffness index based on the coefficient obtained between the value of E/e’ with respect to the reservoir strain (LAst). To obtain atrial strain images, we tried to achieve an apical four-chamber plane focused on the left atrium while avoiding errors involving cutting the posterior wall and overlapping of the start of the aortic outflow tract. The qualitative image tried from the start to obtain a subjective harmony recording two atrial strain results in all patients selecting the results that offered the greatest global strain and lower asynchrony. The studies used a Radiant DICOM Viewer device for their subsequent review and were repeated in case of doubt within a maximum of one month after the first recording. All the studies were performed before ablation therapy.
Statistical analysis
To compare clinical and demographic characteristics, electrocardiographic variables, Holter variables and echocardiographic variables between groups we used X2 tests for categorical variables and ANOVA for quantitative variables (or Kruskal-Wallis test for variables with non-normal distribution). Post-hoc pairwise comparisons were computed using Bonferroni’s correction. Two multivariate logistic regression models were adjusted to compare cases with controls and recurrent PAF with controls. All variables with a p-value < 0.1 in the bivariate analysis were included as covariates. The final model was obtained using a backward variable selection method. Odds ratio with their respective 95% confidence intervals were obtained. Statistical analyses were performed with the SAS system version 9.4 (SAS Institute Inc., Cary, North Carolina, USA). Statistical significance level was set at a = 0.05.
All patients signed a statement of informed consent and the study respected the Declaration of Helsinki and was approved by with the ethic local hospital committee.
Results
The clinical and socio-demographic characteristics of the 270 patients are shown in Table 1 and the echocardiographic variables in Table 2. As previously described in methods section, the RUNs group included the largest number of patients (n = 162) and the first aim of our study was to compare this group with de control group. Although apparently significant differences were observed between RUNs and control group, in the multivariate study only older age, greater left atrial volume and higher CHAD2DS2-VASc score were statistically significant (Table 1 Supplementary). Although only marginally statistically significant, anxiety was in greater percentage in control versus RUNs. In the multivariate analysis between the controls and recurrent PAF, only the age was significant (Table 2 Supplementary). Regard to the electrocardiogram, no significant differences were observed between the control group and the RUNs. However, the increased values in P-wave duration were relevant between the recurrent forms with respect to the isolated forms and the RUNs. Likewise, the dispersion of the P wave was greater in the recurrent forms with respect to the RUNs (Table 3 Supplementary) but its significance is debatable to power only a marker of electrical dispersion without functional translation.
Table 1 Patient characteristics and clinical evaluation
| Variable | Control (n = 78) | Runs (n = 162) | Isolated PAF (n = 7) | Recurrent PAF (n = 23) |
|---|---|---|---|---|
| Age | 53.9 ± 10.6* | 63.0 ± 9.5 | 42.7 ± 18.0* | 64.0 ± 8.5 I |
| Gender – Female | 60 (76.9%) | 112 (69.1%) | 2 (28.6%)* | 10 (43.5%)* |
| Married | 68 (87.2%) | 140 (86.4%) | 4 (57.1%) | 18 (78.3%) |
| Secondary education | 33 (42.3%)* | 46 (28.4%) | 1 (14.3%) | 5 (21.7%) |
| Active | 65 (83.3%)* | 90 (55.6%) | 6 (85.7%) | 9 (39.1%) * |
| Immigrant | 45 (57.7%) | 100 (61.7%) | 5 (71.4%) | 19 (82.6%)* |
| Anxiety | 8.83 ± 3.95* | 7.79 ± 3.89 | 9.43 ± 3.15 | 7.48 ± 3.75 |
| Depression | 5.08 ± 3.92 | 4.20 ± 3.49 | 4.14 ± 2.67 | 3.96 ± 2.90 |
| Previous history of palpitations | 31 (39.7%) | 85 (52.5%) | 3 (42.9%) | 22 (95.7%)* I |
| Complementary cardiac test | 44 (56.4%)* | 114 (70.4%) | 4 (57.1%) | 21 (91.3%)* |
| Treatments | 1.39 ± 0.84 | 1.51 ± 0.97 | 1.29 ± 1.38 | 2.26 ± 1.05* |
| Intense sport | 2 (2.6%) | 4 (2.5%) | 0 (0%) | 2 (8.7%) |
| Diabetes | 6 (7.7%) | 14 (8.6%) | 1 (14.3%) | 2 (8.7%) |
| Thyroid | 11 (14.1%) | 28 (17.3%) | 0 (0%) | 3 (13.0%) |
| OSAS | 4 (5.1%) | 16 (9.9%) | 1 (10.7%) | 3 (13.0%) |
| Chronic obstructive bronchopathy | 0 (0%)* | 9 (5.6%) | 0 (0%) | 3 (13.0%)* |
| No HT | 43 (55.1%)* | 48 (29.6%) | 2 (28.6%) | 3 (13.0%)* |
| Elevated BP | 12 (15.4%) | 41 (25.3%) | 1 (14.3%) | 5 (21.7%) |
| Hypertension Stage I | 22 (28.2%)* | 68 (42.0%) | 3 (42.9%) | 13 (56.5%)* |
| Hypertension Stage II | 1 (1.3%) | 5 (3.1%) | 1 (14.3%) | 2 (8.7%) |
| Ambulatory control BP | 76 (97.4%) | 154 (95.1%) | 6 (85.7%) | 20 (87.0%) |
| Corporal surface | 1.77 ± 0.21 | 1.79 ± 0.18 | 1.90 ± 0.23 | 1.85 ± 0.20 |
| CHA 2- DS2-VASc score | 1.14 ± 0.66* | 1.69 ± 0.88 | 0.86 ± 0.90* | 2.13 ± 1.18* I |
| Heredity | 11 (14.1%) | 36 (22.2%) | 0 (0%) | 3 (13.0%) |
Mean ± standard deviation for quantitative variables and n (percentage) for categorical variables.
*Indicates statistically significant differences between the different groups and RUNs; Iindicates statistically significant differences between ISOLATED and RECURRENT PAF. RUNs: repetitive ectopi catrial forms; PAF: paroxysmal atrial fibrillation; OSAS: sleep apnea; BP: blood pressure; HT: hypertension.
Table 2 Echocardiographic variables
| Variable | Control (n = 78) | Runs (n = 162) | Isolated PAF (n = 7) | Recurrent PAF (n = 23) |
|---|---|---|---|---|
| E/e’’ | 7.97 ± 2.37* | 9.12 ± 2.71 | 7.74 ± 2.32 | 8.72 ± 2.60 |
| VRT | 1.95 ± 0.50* | 2.15 ± 0.57 | 1.87 ± 0.68 | 2.30 ± 0.48* |
| Left atrial diameter | 3.44 ± 0.66* | 3.65 ± 0.66 | 3.87 ± 0.91 | 4.02 ± 0.64* |
| LA vol min | 8.59 ± 2.90* | 10.58 ± 4.44 | 12.7 ± 7.70* | 12.3 ± 5.89* |
| LA vol max 2D | 22.8 ± 5.37* | 26.7 ± 8.13 | 31.3 ± 11.34* | 32.0 ± 7.19* |
| LA vol max 3D | 25.4 ± 6.08* | 30.9 ± 9.28 | 32.7 ± 10.0* | 36.8 ± 9.42* |
| Peak longitudinal averaged atrial strain (in %) | 51.4 ± 23.9* | 43.5 ± 21.7 | 51.7 ± 17.2 | 37.4 ± 15.3* |
| Peak longitudinal lateral atrial strain (in %) | 55.9 ± 28.7 | 50.2 ± 29.7 | 48.4 ± 13.2 | 41.9 ± 21.0* |
| Peak atrial contraction strain (in %) | –23.6 ± 11.0* | –21.0 ± 7.55 | –21.7 ± 9.46 | –17.4 ± 6.13* |
| Left atrial global strain (in %) | 54.4 ± 25.0* | 44.8 ± 20.4 | 41.0 ± 16.3 | 37.7 ± 15.8* |
| Electromechanical left atrial conduction | 125.8 ± 14.9 | 127.6 ± 16.6 | 134.0 ± 11.3* | 149.7 ± 19.7* I |
| Parietal stiffness (LAst) | 0.19 ± 0.14* | 0.25 ± 0.15 | 0.26 ± 0.20 | 0.28 ± 0.20* |
| Dyssynchrony (in ms) | 31.6 ± 29.3 | 46.2 ± 44.4 | 25.8 ± 32.0* | 57.4 ± 36.8 |
| Dyssynchrony (in %) | 3.69 ± 3.54* | 4.80 ± 4.08 | 2.71 ± 3.15 | 6.57 ± 5.15* I |
| LV mass indexed | 82.5 ± 23.6* | 93.0 ± 28.2 | 91.1 ± 19.4 | 106.4 ± 24.9* |
| Global longitudinal ventricular strain (in %) | –21.5 ± 2.86 | –21.9 ± 2.95 | –20.9 ± 3.13 | –21.7 ± 2.93 |
| Left ventricular ejection fraction (in %) | 62.6 ± 3.68 | 63.0 ± 3.81 | 60.0 ± 2.94 | 62.0 ± 3.84 |
The values are mean ± standard deviation.
*Indicates statistically significant differences in the comparison with RUNs; Iindicates statistically significant differences between ISOLATED and RECURRENT PAF. RUNs: repetitive ectopic atrial forms; PAF: paroxysmal atrial fibrillation; VRT: velocity tricuspid regurgitation; LA: left atrial; Vol: volume; Max: maximum; 2D: two dimensional; 3D: three dimensional; LV: left ventricle.
In addition, the left atrial global strain, peak longitudinal average atrial strain, peak atrial contraction strain and left atrial ejection fraction are significantly reduced in the RUNs group and recurrent forms of PAF in comparison with the control group only in the bivariate statistical model. The same thing happened in the percentage of dyssynchrony and electromechanical left atrial conduction.
Intriguingly, in our study, we observed in a non-protocolized way some models of basal dyssynchrony and dynamic image sequences after an atrial extra systole that suggest different pathogenesis at the beginning of repetitive forms. Figure 1 suggest the origin of extra systole at the level of the pulmonary veins whose arrhythmogenic potential is classically defined and in addition, there is an anatomical alteration in intratrial conduction involving in some way the Bachmann’s fasciculus. This patient presented atrial fibrillation just before the ablation, during catheter manipulation and showed RUNs, and PAF in the follow-up Holters not seen in the initial analysis. Figure 2 show the initial sequences of extra systoles with changes in longitudinal and segmentary strain that guide on the functional state of the left atrium and its adaptation mechanisms.
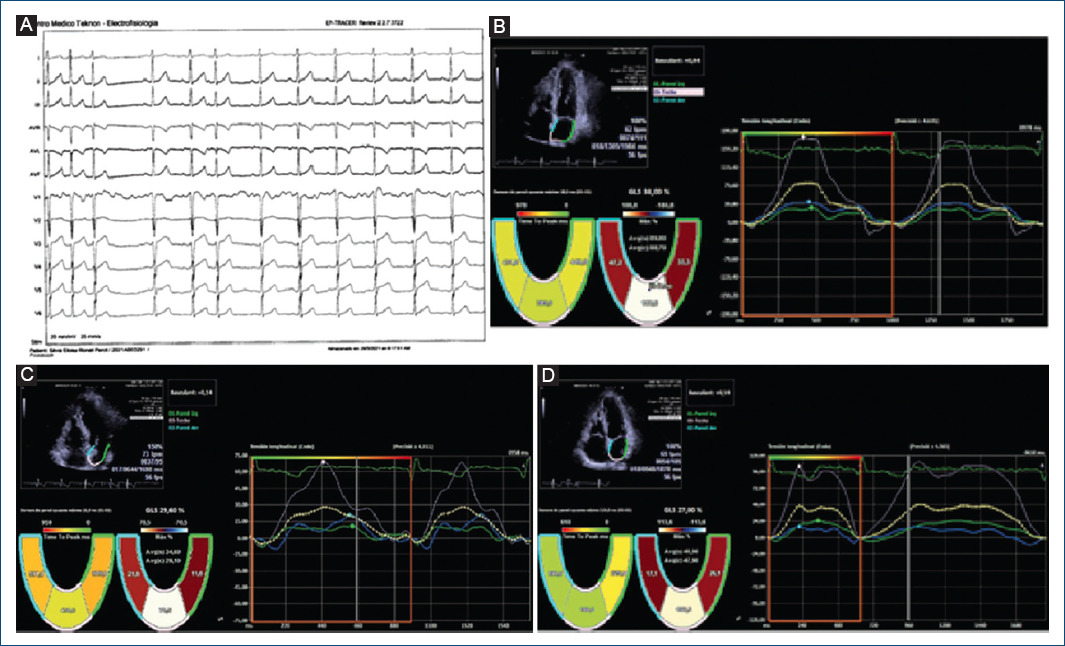
Figure 1 Global and segmental atrial strain with “gating” in the electrocardiograph R wave. Correlative frames that include an atrial extra systole and the different behavior of its longitudinal segmental deformation curves that suggest different points of origin of the arrhythmia and probably different pathogenesis. 55-Year-old female patient with elevated blood pressure treated with Angiotensin Converting Enzyme inhibitors, family history of ablated atrial fibrillation and atrial extra systole of moderate density, that was documented for the last two years not showing repetitive forms (control group) with clinical limitation to effort without obvious structural heart disease. The basal electrocardiogram showed no alterations to the P wave and the and the extrasystole was positive on the lower side and V1 with negativity in a VL suggestive of an origin in the posterior left superior pulmonary vein. (A) The basal echocardiogram showed no significant alterations or signs of delay in electro-mechanical activation or asynchrony. (B) shows the deformation curves of the septal, posterior and lateral walls during sinus rhythm, showing a maximum peak of positive longitudinal elongation. very predominant posterior aspect with slight asynchrony as regards the activation of the septal and lateral walls (18 ms) with reservoir strain values within normal ranges. During extra systole (C) we saw a decrease in global and segmental strain values with a reduction in the activation time of the posterior wall and a significant increase in asynchrony with respect to the septal and lateral walls. This suggests anisotropic conditions and a type of left intra-atrial block with delay in the activity of the basal segments possibly involving the Bachmann’s fascicle. In (D) we observe beats after the extra systole with a tendency to recover the initial global and segmental strain values.
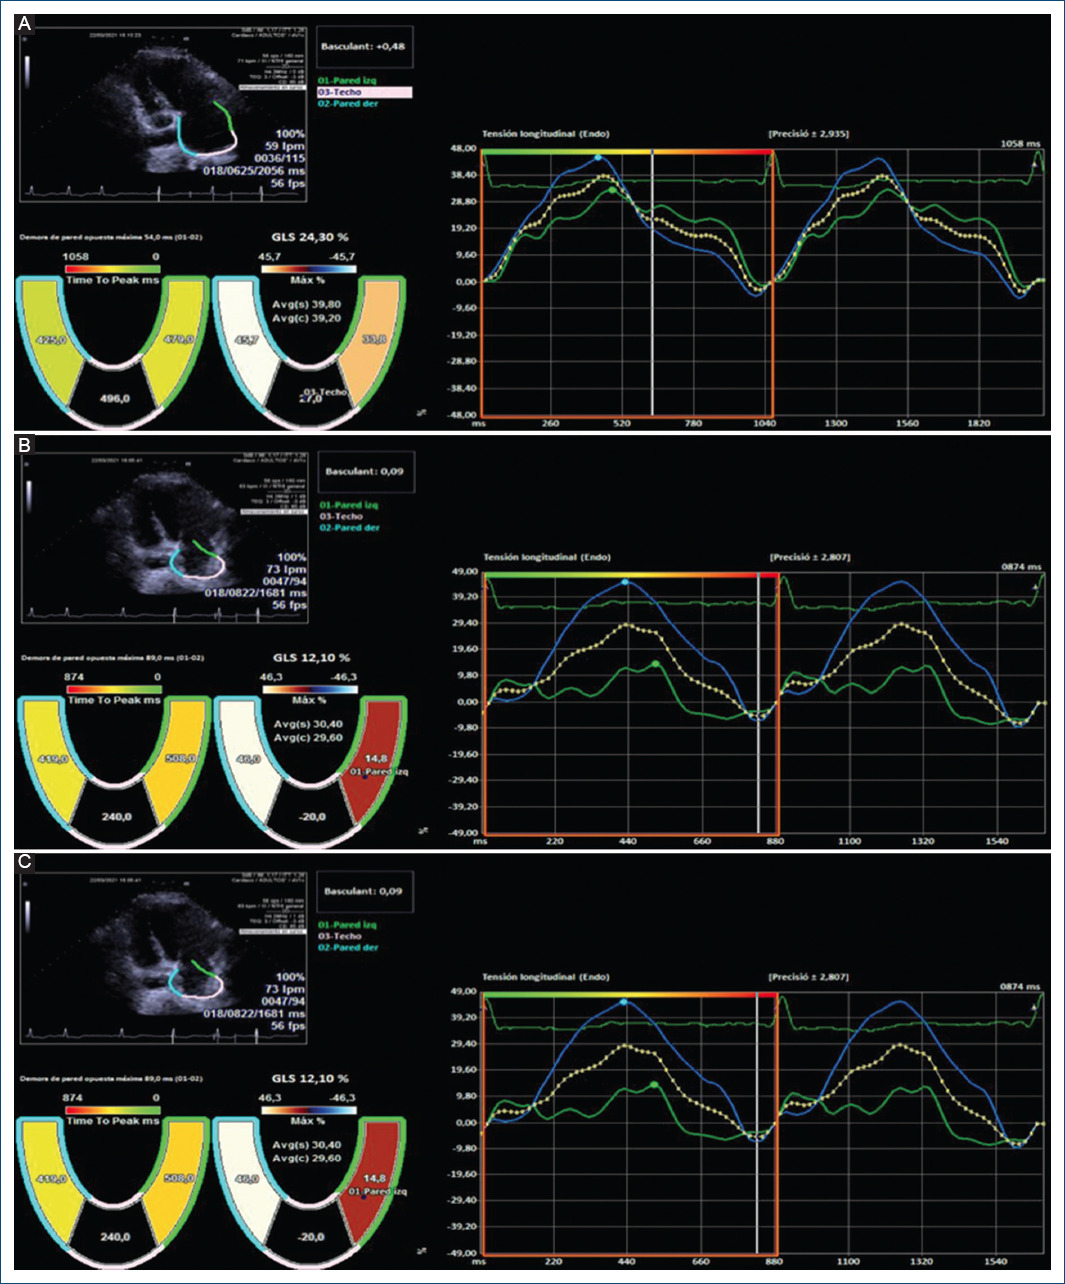
Figure 2 75-year-old patient, hypertensive with atrial extrasystole bursts and no evidence of atrial fibrillation with an electrocardiograph P wave of 122 ms and an electrocardiogram which showed slight left atrial dilation (35 ml/m2) and no increase in the electromechanical conduction time with asynchrony in the longitudinal tension between the septal and lateral walls (54 ms, 5% relative to the RR). (A) shows the basal recording; (B) is during the extrasystole with a slight increase in the asynchrony and the global strain initiating a sequence of several recurrent beats; (C) shows an increase in the global and segmental reservoir causing the disappearance of the asynchrony and equalising the wall tension values without active contraction. This suggests a homogeneous activation front without anatomical obstacle, with increased atrial pressure and adaptive stretching of the atrial wall.
Discussion
Initial electrocardiographic analysis by a specialist can also provide relevant data even when anxiety appears to be the single cause of palpitations11 specially the values of duration and dispersion of the p wave.
In our study, we selected patients were not displaying organic cardiopathy with short forms of atrial arrhythmia that could raise other arrhythmia-inducing causal factors such as anatomical abnormalities and presence of focal areas of fibrosis undetectable with traditional imaging methods. Our results show that left atrial diameter and volumes are the most significative variables, suggesting transitory and reversible changes during the short left atrial arrythmias, indicating the potential presence of sustained hidden atrial arrythmias, frequently undetectable by traditional Holter recordings.
In our work, higher values of dyssynchrony at 57 ms and 6.5% with respect to the RR interval in atrial strain were associated with a higher risk of recurrent PAF. Other recent studies with population groups and methodology similar to ours, show the importance of left intra-atrial dyssynchrony as a predictor of initial or recurrent atrial fibrillation proposing it as a first-line echocardiographic variable even in patients without structural heart disease and in silent forms12-14. Recently, its use has also been considered by transesophageal echocardiography at the level of the left atrial appendage in the assessment of emboli genic risk of patients with PAF15.
Dinov and cols., showed different models of left atrial activation after electromechanical mapping with tissue doppler at five different points, also including the lateral segment of the tricuspid annulus by measuring conduction time in reference to the electrocardiograph P wave in selected patients for pulmonary vein ablation and a control group without a history of atrial fibrillation16. All patients underwent electro-anatomical mapping with the Carto system performing circumferential pulmonary vein insertion according to the standard protocol of the center with additional ablation lines in areas of low voltage (< 0.5mV). Compared to the control group, patients with PAF had significantly lengthened conduction intervals at the septal, lateral, anterior and posterior levels of the left atrium while this not being the case at the level of the tricuspid annulus. With cut-off values of 55 ms, they were able to discriminate between the control group and PAF patients with 81.5% sensitivity and 82.8% specificity, showing activation onset in the upper area of the left atrium with delayed activation at the level of the mitral annulus, suggesting a blockage in the Bachmann bundle that connects the right atrium with the anterior-superior part of the left atrium, although genetically mediated electrical and structural family variants may also promote these different behaviors17. A recent work also using tissue Doppler in 98 patients with electrocardiographic signs of to the existence of blockade of the Bachmann´s fasciculus among whom many displayed hypertension and some ischemic disease, obtained assynchrony values in relation by comparing the activation of the septal and lateral wall thus obtaining cut-off values of 39+/-16 ms18. Seven days Holter recordings were carried out during the follow-up in symptomatic patients, resulting in 10% of patients with PAF, a similar result to that obtained by us (11%). On the other hand, the works that have studied the electro-mechanical conduction times of the atria with tissue Doppler techniques support the concepts obtained by catheter mapping techniques helping to establish cut-off values easily reproducible in everyday cardiological practice19. Another recent article using 3D speckle-tracking correlates these electro-anatomical concepts, dyssynchrony and delay in atrial conduction in patients with PAF, verifying dyssynchrony in the early stages of atrial remodeling20. Values among the normal population recorded a mean of 42 ms and 2% relative to the RR intervals with negative prognostic implications in terms of the greater risk of global mortality, atrial fibrillation and stroke mostly in females21. In summary, changes in the sequence of electro-anatomical-physiological mechanical activation can be suspected with techniques based on the left atrial strain and can occur anywhere in the left atrium facilitating the re-entry and appearance of repetitive forms22.
Some studies have also shown the usefulness of left atrial segmental longitudinal strain23, although with current software it requires offline expert analysis. Figures 1 and 2 show two examples of an extrasystole and the changes caused in the segmental left atrial deformation curves. The relationship between the place of origin of PACs and the initiation of atrial fibrillation is well known24, but is not usually taken into account in the routine assessment in primary care. To our knowledge, these images are a new contribution to an understanding of the dynamic behavior of the curves of the segmental left atrial longitudinal strain before, during and after a PAC. As they are not cinematic sequences, there is a short time lag between the acquisition of each image that prevents rigorous quantitative evaluations. Dyssynchrony studies in the comparison of this type of curve based on the segmental atrial strain peak show no significant differences in relation to the number of segments assessed (at least two). Another important aspect derived from our graphs is the stunning effect observed after PACs. Although we only show two cases in a qualitative way, it could be related to the adverse remodeling of the left atrium. Several studies with transthoracic and trans esophageal echocardiography have shown transitory alterations in the mechanical function of the left atrium and the appendage, with reversed atrial fibrillation even spontaneously with reduced Doppler velocity values fundamentally in the atrial appendage. The duration of these alterations depends on the length of the arrhythmia, the atrial diameter, its wall stiffness in relation to structural changes of the atrial connective tissue and the underlying structural heart disease25.
At present, the software used in the atrial deformation study is not specifically developed for it and adaptations are made to the model used in the left ventricle. Manufacturers should take into account the significant usefulness of studying dyssynchrony before, during and after atrial arrhythmia, as well as the stunning time, by creating cineloop sequences with easy-to-use quantitative values, as well as automatically setting the study segment. Parietal muscles adapted to the anatomy of each patient through three-dimensional echocardiography with tracking velocities adapted to the atrium, would all contribute to a great improvement in the study of these and other atrial arrhythmias.
Limitations of the study
First, the control group is not really a healthy population because they felt some palpitations and the results are not extrapolatable for the asymptomatic general people. Moreover, it was also impossible to persuade the volunteers for wearing the Holter for three days. Second, the software specially designed for exclusive use in the left atrium planned, based on the three-dimensional anatomical analysis combining cine sequences and quantitative velocity-time analysis of the maximum peaks of longitudinal deformation may be useful for establishing earlier prognostic stratification in these arrhythmias and their more appropriate clinical management groups with long-term follow-up. The graphs only represent functional and qualitative value, and their validity remains to be confirmed in subsequent studies carried out with programs developed for this purpose. Third, the echocardiograph study was carried out by only one expert, although intra-observer variability studies performed in the EACVI NORRE study and in the BEFRI study reported an excellent intra-class correlation coefficient26. Fourth, the electrocardiograph values of the terminal forces of the P wave in V1 were carried out automatically by the equipment, which may result in greater interpretation errors than with the manual analysis. Fifth, the low number of patients showing atrial fibrillation does not permit to stablish a threshold in the basal dyssynchrony analysis between control and repetitive-PAF individuals.
Conclusions
The dynamic curves of left atrial strain generated after an extra systole allow to observe activation sequences that suggest their origin around the pulmonary veins and in addition, they can show anatomical disorders in the interauricular conduction and an aid in the better understanding of the left atrial adaptation mechanisms.

