


 nueva página del texto (beta)
 Inglés (pdf)
 Artículo en XML
 Referencias del artículo
 Enviar artículo por email
 Citado por SciELO
  Similares en
SciELO
Similares en
SciELO 
 Permalink
Introduction
The standard 12-lead electrocardiogram (ECG) remains the most frequently recorded non-invasive test in medicine due to its accessibility and simplicity. It provides us with an infinity of data that constitute elementary instruments when evaluating and defining therapeutic measurements in patients with cardiovascular pathologies. The Tpeak-Tend interval of the T wave in the ECG has emerged as a new electrocardiographic marker of increased transmural dispersion of ventricular repolarization1-5. The potential of Tpeak-Tend to serve as a risk marker for the development of cardiac arrhythmias was initially proposed in 1998, in experimental models1. Since then, various studies have been carried out looking for the relationship between ventricular repolarization parameters and the presence of arrhythmias in different populations6-11. Even so, identifying patients at risk for life-threatening arrhythmias have been difficult for many years. Recent studies have suggested that the Tpeak-Tend interval and the Tpeak-Tend/QTc ratio are associated with malignant ventricular arrhythmias and an increased risk of sudden cardiac death2-12. The populations that are most represented in these studies are those with a diagnosis of long QT syndrome, short QT syndrome, Brugada syndrome, and other cardiomyopathies. Systemic arterial hypertension (SAH) also occupies a place among these pathologies. SAH is one of the most frequent pathologies in the adult population, which is why more and more emphasis is being placed on its diagnosis, treatment, and prognosis. Patients with SAH and other diseases have been shown to be at risk of developing ventricular arrhythmias and sudden death13-15. For these reasons, we aimed to determine the presence of ventricular repolarization disorders and abnormalities of the cardiac conduction system in SAH patients who possess altered Tpeak-Tend interval of the T wave.
Materials and methods
Methodological design
This was an analytical, retrospective, cross-sectional, and observational study of cases and controls with non-probability sampling.
Study patients
In total, 67 patients were included who were previously diagnosed with SAH and were examined between April 2019 and November 2019 at the Cardiology Department. The SAH patients were divided into two groups: those with prolonged (≥ 77 ms) T-peak-Tend intervals (21 patients, 31%) were in the case study group, and those SAH patients with normal (< 77ms) T-peak-Tend intervals, (46 patients, 69%) were in the control group15. Patients over 18 years of age of both sexes with a diagnosis of SAH were included in the study. All patients were adequately managed with antihypertensive drugs, and few patients had other comorbidities, namely, diabetes mellitus (six) and dyslipidemia (five). The inclusion and exclusion criteria are shown in table 1.
Table 1 Inclusion and exclusion criteria
| Inclusion criteria |
|---|
| − Hypertensive patients older than 18 years |
| − Patients of both sexes |
| − Patients with a diagnosis of Primary Hypertension, according to the definitions of the JNC 8, under antihypertensive treatment |
| − Patients with normal left ventricular systolic function |
| Exclusion criteria |
| − Patients who refused to give informed consent |
| − Patients with poor acoustic window for echocardiography studies |
| − Coexisting acute cardiovascular event |
| − Patients with atrial flutter or fibrillation |
| − Electrolyte imbalances |
| − Active infections |
| − Chronic obstructive pulmonary disease |
Sampling
Non-probabilistic analysis of consecutive cases of hypertensive patients who came for control to the Cardiology Department who fulfilled the inclusion criteria was evaluated. They were subjected to diagnostic tests (ECG, echocardiography) and these results have subsequently been analyzed.
Study variables
Alteration of ventricular repolarization manifested as a prolongation of the Tpeak-Tend interval of the T wave in the electrocardiogram, detected by computerized electrocardiographic analysis tools. Dichotomous variable defined as a normal or long interval.
Alterations in the cardiac conduction system manifested as prolongation of the QRS complex with the right or left bundle branch block morphology or QT interval prolongation; and echocardiographic alterations such as diastolic dysfunction and left ventricular hypertrophy (LVH).
Electrocardiogram parameters
All participants underwent a 12-lead ECG recorded on a digitized ECG using the EP calipers on-screen digital caliper software. All ECGs were recorded at 25 mm/s with an amplitude of 10 mm/mV. The p wave duration, PR interval, QRS duration, corrected QT interval, the Tpeak-Tend interval, and the Tpeak-Tend/QTc ratio were calculated, measured, also averaged, and corrected for heart rate. The QT interval was defined as the interval from the onset of the QRS complex to the end of the T wave. The QT dispersion was the difference between maximal and minimal QT interval duration in all measurable ECG leads. The QTc interval and the corrected Tpeak-Tend were calculated using the Bazett formula (QTc = n/√RR), (Tpeak-Tend = n/√RR). The Tpeak-Tend interval (ms) was calculated by computerized electrocardiographic analysis tools. It was measured from the peak of the T wave (or nadir if a negative or biphasic T wave was obtained) and the intersection between the tangent at the steepest point of the downward slope of the T wave and the isoelectric line (Fig. 1). Two consecutive QT intervals were measured in each lead and the arithmetic mean was calculated. The 12-leads of the ECG variables were measured in detail, and a minimum of eight leads was measured for each patient depending on recording quality12. The 12-lead ECG variables were examined by two independent observers (JC and JA), who were blinded to the clinical data. Kappa values were utilized to determine interobserver variability and reliability for categorical variables; values of 0.81-1.0 are indicative of excellent agreement; 0.61-0.80, substantial agreement; 0.41-0.60, moderate agreement; 0.21-0.40, fair agreement; 0-0.20, slight agreement; and values < 0, poor agreement16. This method produced an excellent correlation between the two observations with a kappa statistic of 0.94. In case of a difference of more than 20 ms in each measurement, an agreement was obtained with the help of a third observer (OC).
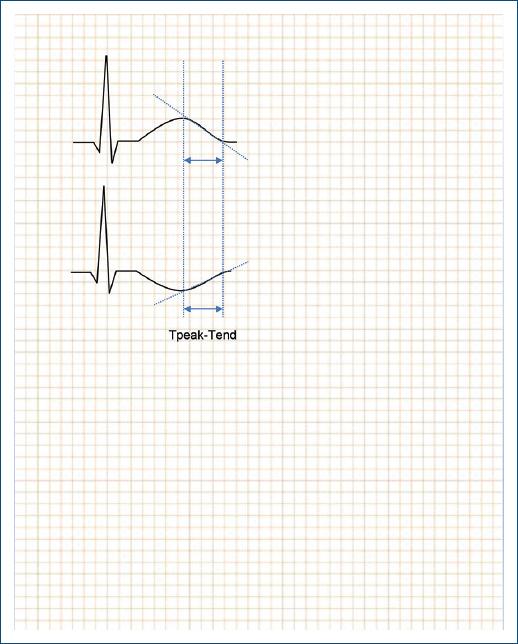
Figure 1 Depicts the measurement of an example of the electrocardiographic parameter, namely, the Tpeak-Tend interval. It was measured from the peak of the T wave (top ECG), or from the nadir if a negative or biphasic T wave was obtained, (bottom ECG), and the intersection between the tangent at the steepest point of the downward slope of the T wave and the isoelectric line.
Echocardiography
All patients underwent an echocardiographic evaluation according to the recommendations of the American Society of Echocardiography17. All examinations were performed with a commercially available echocardiographic machine (GE Vivid iQ) for the acquisition of M, 2-D mode and Doppler images to the study left ventricular dimensions, wall thickness, and function. Parasternal and apical views were used with the patient in the left lateral decubitus position. All views were recorded as digital images and then reanalyzed.
Statistical data
The variables were recorded in Excel 2019 spreadsheets. The analyzes were carried out using the Epi Info 7.2 and Epidat 3.1 software. The qualitative variables were expressed in frequencies and percentages, and the quantitative variables in means with their standard deviations; and in medians with their interquartile ranges. Comparisons between cases and controls were made using the Chi-square statistical test for qualitative variables, expressed as OR, using a 95% confidence interval and statistical significance were given for a value of p < 0.05. Comparisons of quantitative variables between both cohorts were carried out using the Bartlett test to verify the homogeneity of variances. In the cases of homogeneity of variances, statistical significance was determined with the ANOVA test. In cases without homogeneity of variances, statistical significance was determined using the non-parametric tests of Mann–Whitney Wilcoxon and Kruskal–Wallis.
Sample size estimate
The sample size was estimated using the Epi info 7.2 software. Using a confidence level of 95%, a power of 80%, a ratio of 1:1, and using as a reference a prolonged T-peak-Tend of more than 77 ms15, an odds ratio of 5 is expected for cardiovascular complications in 63% of exposed cases. A total sample of 57 patients was calculated for the study.
Ethical issues
The present research was conformed to the principles outlined in The Code of Ethics of the World Medical Association (The Declaration of Helsinki). The confidentiality of the patient’s personal data was respected through the use of numerical codes during the analysis of this research and they will not be revealed in any presentation or communication that could result from it.
Results
The baseline characteristics of the patients are summarized in table 2. The analysis of the relationship between Tpeak-Tend/QTc ratio with conduction system alterations and echocardiographic parameters is summarized in table 3.
Table 2 Patient characteristics according to the Tpeak-Tend interval
| Variables | TpTe ≥ 77ms n = 21 (31%) | TpTe < 77ms n = 46 (69%) | p* value |
|---|---|---|---|
| Male, n (%) | 13 (62) | 10 (22) | 0.001 |
| Female, n (%) | 8 (38) | 36 (78) | |
| Age media ± SD | 60.2 ± 7.2 | 62.4 ± 9.6 | 0.3 |
| BMI, media ± SD | 30.5 ± 4.6 | 28.5 ± 5.2 | 0.07 |
| p wave dispersion, ms, media ± DS | 40 ± 15 | 44 ± 14 | 0.2 |
| PR Duration, ms, media ± DS | 168 ± 29 | 167 ± 26 | 0.9 |
| QRS Duration QRS, ms, media | 110 ± 12 | 94 ± 8 | < 0.001*** |
| QRS Duration ≥ 120 ms, n (%) | 4 (19) | 3 (6) | 0.2** |
| IRBBB or CRBBB, n (%) | 1 (4) | 3 (6) | 0.7** |
| LAHB, n (%) | 3 (14) | 0 | 0.04** |
| QTc V5, ms, media | 440 ± 26 | 422 ± 15 | 0.01*** |
| QTc 12 leads, ms, media | 4 (19) | 1 (2) | 0.05** |
| Prolonged QTc V5, n (%) | 7 (33) | 5 (11) | 0.02 |
| Tpeak-Tend 12 leads, ms, media | 84 ± 5 | 65 ± 4 | < 0.001*** |
| Tpeak-Tend dispersión, ms ± DS | 28 ± 8 | 28 ± 12 | 0.9 |
| Tpeak-Tend/QTc, media | 0.19 ± 1 | 0.16 ± 1 | < 0.001*** |
| TpeakTend/QTc > 0.21, n (%) | 7 (33) | 0 | < 0.001** |
| LA Vol Index > 34 ml/m2, n (%) | 12 (57) | 13 (28) | 0.004 |
| LVH, n (%) | 14 (67) | 23 (50) | 0.2 |
| LVEF, %, media | 61 ± 2 | 67 ± 3 | 0.002*** |
| Normal Diastólic Function, n (%) | 15 (71) | 39 (85) | 0.1 |
| Indetermined Diastolic Function, n (%) | 4 (19) | 3 (7) | 0.2** |
| Diastolic Dysfunction, n (%) | 2 (10) | 4 (9) | 0.7** |
*t test (ANOVA),
**Yates Correction,
***KrusKal–Wallis test.
BMI: body mass index; IRBBB: intermitent right bundle branch block; CRBBB: complete right bundle branch block; LAHB: left anterior hemiblock; LA: left atrium; LVH: left ventricular hypertrophy; LVEF: left ventricular ejection fraction.
Table 3 Relationship between prolonged Tpeak-Tend/QTc ratio with conduction system alteration and echocardiographic parameters
| Variables | Total (n = 67) | TpTe/QTc ≥ 0.21 n = 7 (10%) | TpTe/QTc < 0.21 n = 60 (90%) | OR (IC 95%) | p* value |
|---|---|---|---|---|---|
| QTc prolongation V5, n (%) | 12 (18) | 2 (29) | 10 (17) | 2 (0.3-11) | 0.7* |
| Tp-Te V5 > 77ms, n (%) | 18 (27) | 6 (30) | 12 (20) | 24 (2.6-218) | 0.001* |
| QRS ≥ 120 ms, n (%) | 7 (10) | 1 (14) | 6 (10) | 1.5 (0.15-14) | 0.7* |
| LVH, n (%) | 37 (55) | 3 (43) | 34 (57) | 0.57 (0.11-2.7) | 0.7* |
| Diastolic dysfunction, n (%) | 13 (19) | 2 (29) | 11 (18) | 1.7 (0.3-10) | 0.8 |
The median value of QRS complex duration was significantly wider in the study group as compared to the control group (110 ± 12 ms vs. 94 ± 8 ms p < 0.001). There was a significantly greater incidence of the left anterior hemiblock in the study group (14% vs. 0% p < 0.04) as observed in table 2. The median value of the QTc interval was significantly greater in the study group (440 ± 26 vs. 422 ± 15 p < 0.01). There was a significantly greater incidence of patients with prolonged QTc interval in the study group (33% vs. 11% p < 0.02). The median value of the Tpeak-Tend interval was significantly greater in the study group (84 ± 5 ms vs. 65 ± 4 ms p < 0.001). There was a significantly greater Tpeak-Tend/QTc ratio in the study group (0.19 ± 0.1 vs. 0.16 ± 0.1 p < 0.001) as shown in table 3.
Discussion
We have shown in the present research that hypertensive patients with altered Tpeak-Tend interval are at increased risk for other ventricular repolarization disorders and abnormalities of the conduction system of the heart. To the best of our knowledge, this is the first study to demonstrate that there is a significantly greater ventricular repolarization disorders and abnormalities of the cardiac conduction system in SAH patients who possess altered Tpeak-Tend interval.
The Tpeak-Tend, QTc, and Tpeak-Tend/QTc ratio are electrocardiographic values that have been shown to be useful in predicting cardiovascular events, specifically ventricular arrhythmias and sudden death18-22. The use of these tools is relatively simple, inexpensive, and provides prognostic information in SAH patients. The QTc, generally, is the ventricular repolarization measure mostly used by cardiologists in clinical practice. Demonstrating its relationship with the other transmural repolarization dispersion (TRD) measures is extremely useful, this allows defining populations that will benefit from closer monitoring and thus serves as a tool to prevent the occurrence of major cardiovascular events23-25.
In research conducted in 2011, Mozos and Serban studied the relationship between Tpeak-Tend interval prolongation and other conduction disorders in 59 patients13. They concluded that hypertension is associated with an increased prevalence of prolonged QT intervals. In addition, QT intervals and T wave variables are closely connected in hypertensive patients. LVH is associated with prolonged QT Interval and Tpeak-Tend interval in hypertensive patients. Therefore, Mozos and Serban related their findings of QT intervals and T-wave disorders to the association with LVH13. However, we found QT interval and T wave disorders irrespective of ventricular hypertrophy in our SAH patients, since we did not find significant differences in these parameters between the SAH patients with and without LVH. As stated in table 2, 14 (67%) patients with altered Tpeak-Tend interval presented LVH, and 23 (50%) patients with normal Tpeak-Tend intervals also presented LVH. Moreover, our findings of ventricular repolarization disorders and abnormalities of the conduction system of the heart are related instead to altered Tpeak-Tend intervals in hypertensive patients. LVH and alterations in diastolic function could be related to alterations in ventricular repolarization and the appearance of arrhythmias. The studies with older populations could provide more data about this relationship.
The Tpeak-Tend interval corresponds to the TRD in the ventricular myocardium, which is a period in which the epicardium is repolarized and fully excitable, but the M cells in the subendocardium are still in the process of repolarization and they are vulnerable to the possibility of early depolarization activity26-29. Complete repolarization of the epicardial action potential coincides with the peak of the T wave and repolarization of the M cells with the end of the T wave. It is known that the duration of the M cell action potential determines the QT interval. In addition, the duration of the epicardial action potential determines the QT peak interval3. In appropriate situations, a critical early post-depolarization initiates the re-entrant circuit and continues until ventricular tachycardia or ventricular fibrillation develops. The importance of this finding lies in the predictive value of TRD measurements for the development of arrhythmias3. The prognostic value of these TRD measurements has been demonstrated in the genesis of ventricular arrhythmias and sudden cardiac death in various pathologies, namely, long QT syndrome, short QT syndrome, Brugada syndrome, hypertrophic heart disease, vasospastic angina, and spontaneous and inducible VT in patients with organic heart disease2-12.
Regarding gender aspects, we did not find a significant difference between the presence of altered (13 patients) versus normal (10 patients) Tpeak-Tend intervals in men. However, as shown in table 2, we have found that eight women had altered Tpeak-Tend interval versus 36 female patients (p < 0.001) who had normal intervals. It is well known that there are differences in terms of repolarization in men and women. In general, women have a higher resting heart rate and a longer ventricular repolarization and QTc interval30,31. The mechanisms involved in this gender difference are related to differences in the activities of some cardiac ion channels that underlie Phases 2 and 3 of the action potential32. There are evidences that hormonal differences are involved in ventricular repolarization as well, specifically testosterone, which according to the several studies shortens QTc. For progesterone and estradiol, the results are more contradictory33.
The identification of these electrocardiographic abnormalities in hypertensive patients leads to hypothetical increased risk of sudden death, which is of marked importance in clinical practice when monitoring these patients. Regarding the echocardiographic parameters, no statistically significant relationship was observed, but there was a trend with the presence of diastolic dysfunction and the prolongation of the Tpeak-Tend interval. Previously published studies propose certain mechanisms that could explain the generation of arrhythmias in patients with SAH and hypertrophy34, which is why we consider that this relationship could be demonstrated by expanding our sample size. A retrospective study such as ours has inherent limitations. Our study population was recruited from a single center. Although, the population of our study was greater than the estimated sample size needed for this research, it was relatively small. Therefore, our study might have lacked the statistical power necessary to identify all significant differences and associations.
Conclusion
There is a significantly greater ventricular repolarization disorders and abnormalities of the cardiac conduction system in SAH patients who possess altered Tpeak-Tend interval of the T wave. These findings may further help simplify future screening and research in patients at potential risk for major cardiovascular events.

