


 nueva página del texto (beta)
 Inglés (pdf)
 Artículo en XML
 Referencias del artículo
 Enviar artículo por email
 Citado por SciELO
  Similares en
SciELO
Similares en
SciELO 
 Permalink
Introduction
In prospective studies, the left ventricular geometry has been identified as an adverse cardiovascular prognostic factor1,2. There are four distinct left ventricular geometries according to the American Society of Echocardiography: normal (NL), concentric remodeling (CR), concentric hypertrophy (CH), and eccentric hypertrophy (EH)3. These geometries are associated with specific risk factors (i.e., obesity in EH and hypertension in CH), cardiovascular outcomes (i.e., hazard ratio = 3.1 in CH and hazard ratio = 5.4 in EH)2, and response to antihypertensives4. The left ventricular geometry can be addressed with magnetic resonance imaging or echocardiography (Echo)3. Magnetic resonance imaging is not routinely recommended because of availability and cost. Echo is the tool of choice to detect left ventricular geometry and monitor changes in volumes and mass3,5. Detecting abnormal left ventricular geometries with Echo have been associated with stroke, coronary heart disease, and mortality in specific populations1. However, in many clinical settings, the Echo is not available. In the absence of Echo, the electrocardiogram (ECG) could help predict Echo left ventricular geometry6,7.
Historically, most of the attention of cardiologist and general practitioners have been to predict Echo left ventricular hypertrophy (CH and EH) using the ECG8. This tendency led to dozens of ECG criteria for the left ventricular hypertrophy used in daily clinical practice worldwide8. However, there has been less attention to detecting Echo left ventricular geometry with the ECG. For example, a study that included patients with untreated hypertension showed that the combination of Sokolow-Lyon (RV5/V6 + SV1), Cornell (Ravl + SV3), and RV6/V5 ratio detected Echo left ventricular geometry with an accuracy of 67% in NL, 81% in CR, 68% in CH, and in EH 60%6. The sensitivity and specificity ranged from 44% to 68% and 64% to 84%, respectively6. Another study that included patients with essential hypertension found that the modified Cornell criteria (Ravl + SD, the deepest S wave in 12-lead ECG) have an increasing trend in the NL, CR, CH, and EH male groups in both unadjusted and adjusted models7. These studies show that the ECG can help predict Echo left ventricular geometry6,7. However, many ECG criteria in the literature to predict left ventricular geometry remain unexplored.
This paper addresses the utility of 31 state-of-the-art ECG criteria to predict Echo left ventricular geometry using accuracy, area under the curve (AUC), sensitivity, specificity, and positive and negative predictive values. Furthermore, it selects the best options in this population and develops multivariable models to understand the effect of abnormal left ventricular geometry on the ECG criteria.
Materials and methods
Study design
This study complies with the latest revision of the Declaration of Helsinki. Our local ethics committee approved this research protocol and waived the requirement for informed consent.
This cross-sectional study included consecutive adults who underwent a transthoracic Echo and ECG between January 2016 and August 2019 in the Cardiology Department of the Hospital Christus Muguerza Alta Especialidad in Monterrey, Mexico.
Sample size calculation
We used G*Power software version 3.1.9.6 for sample size calculation. The sample size was calculated using a 40% sensitivity of reported ECG criteria with a delta of 0.1 (inferiority sensitivity limit = 30%). The analysis needs at least 155 patients in each left ventricular geometry group to reach 80% power and an alpha error = 0.05.
Patient’s selection: inclusion and exclusion criteria
The total of consecutive patients who underwent a transthoracic Echo at the study time was 7567. We included adult men and women (> 18 years) who underwent transthoracic Echo and ECG during the same hospital admission, a cardiologist appointment, or a routine medical check-up. The initial exclusion criteria were age (< 18 years, n = 2300) and lack of ECG (n = 3710). Finally, other exclusion criteria were applied (n = 885): acute myocardial ischemia, elevated cardiac enzymes, tachycardia (> 110 beats/min), intensive care unit patients, cardiotomy (< 3 months), hypertrophic cardiomyopathy (unexplained left ventricular hypertrophy, defined by increased wall thickness in one or more left ventricular segments), dilated cardiomyopathy, interventricular septal defects, fusion rhythms, pacemaker rhythms, pre-excitation syndromes (i.e., Wolf-Parkinson-White), and intraventricular conduction delays (any bundle branch block or hemiblock). Ischemic heart disease by Echo was defined as segmental akinesia/hypokinesia irrespective of pathological Q waves. Myocardial ischemia and infarction zones decrease the voltage of the ECG criteria resulting in false negatives. Furthermore, it produces changes in depolarization (i.e., QRS complex) and repolarization (i.e., ST-T). Therefore, these patients were excluded. However, we included patients with ischemia by Echo to explore whether the presence of ischemic heart disease by Echo affects the final voltage of the ECG independently of other factors.
This study included 672 adults. Demographic, anthropometric, medical history, and
clinical data were collected from medical records. Body mass index is reported
in kg/m2, and the body surface area was calculated with the following
expression: 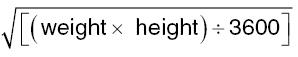
ECG data
The 12-lead ECG data were recollected using a Philips "PageWriter TC50" hardware (Best, The Netherlands). ECGs were performed using a 10 mm/mV sensitivity and a velocity of 25 mm/s. The Philips "PageWriter TC50" ECG contains the Philips DXL-16 algorithm. The Philips DXL-16 algorithm creates automatic quantitative parameters from each ECG recording. With this information, the 31 ECG criteria were calculated (Supplementary Table S1)8,9.
Echocardiographic data
All the methodology and the definitions followed the American Society of Echocardiography recommendations3. Patients underwent two-dimensional ECG-guided M mode transthoracic Echo using the Philips EPIQ7 and IE33 (Best, Netherlands) equipment. Three licensed cardiologists obtained the Echo (agreement kappa = 0.91). The following measurements were obtained in diastole: left ventricular internal diameter, interventricular septum thickness, and left ventricular posterior wall thickness, and left ventricular mass (LVM, gr). Relative wall thickness (RWT) was calculated with the next expression: RWT = 2× diastolic left ventricular posterior wall thickness ÷ left ventricular internal diameter). An RWT > 0.42 was considered abnormal (Fig. 1). LVM was calculated using the following expression: LVM = 0.8 × 1.04 (left ventricular internal diameter + diastolic left ventricular posterior wall thickness + interventricular septum thickness)3-(left ventricular internal diameter)3 + 0.6g. Indexation of LVM (gr/m2) was obtained as follows: LVM index = LVM ÷ body surface area. The definition of the left ventricular hypertrophy in male patients was LVM index > 115 gr/m2 and in female patients > 95 gr/m2 (Fig. 1).
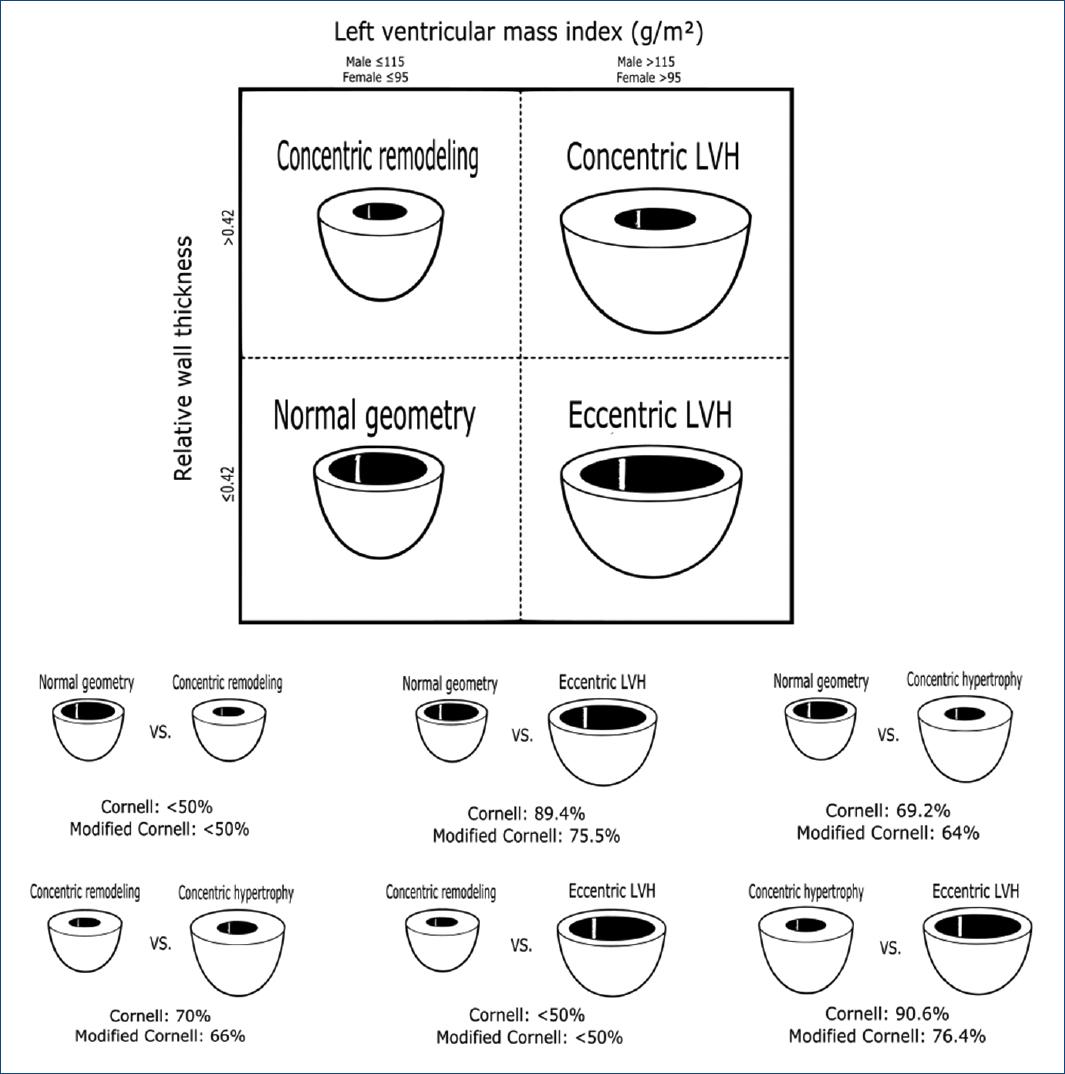
Figure 1 Left ventricular geometries and accuracy of the Cornell and modified Cornell ECG criteria for detecting different geometries. Figure 1 shows the accuracy of the Cornell (ECG21, SV3+RaVL) and modified Cornell criteria (ECG31, RaVL + deepest S in all leads) to detect different left ventricular geometries.
Left ventricular geometry
The left ventricular geometry was divided into four categories based on LVM index and RWT: NL, CR, CH, and EH (Fig. 1).
Diagnostic test parameters
The next diagnostic tests parameters were calculated:
– Accuracy = Number of correct predictions/Total number of predictions
– Sensitivity = [true positive/(true positive + false negative)] × 100
– Specificity = [true negative/(false positive + true negative)] × 100
– Positive predictive value = [true positive/(true positive + false positive)] × 100
– Negative predictive value = [true negative/(false negative + true negative)] × 100.
Statistical analysis
The Shapiro–Wilk test was used to explore normality and descriptive statistics reported in mean and standard deviation or frequency and percentages. We applied ANOVA to demographic, anthropometric, and echocardiographic parameters between the four groups of the left ventricular geometries. A post hoc Bonferroni correction was applied when necessary, and a Chi-square test was used for comparing categorical variables.
Violin plots of all the ECG criteria by each left ventricular geometry were obtained. The median voltage of each left ventricular geometry was compared using the Kruskal–Wallis test. If this test showed p < 0.05, then a Benjamini, Hochberg, and Yekutieli post hoc analysis was performed. ECG criteria without significant differences were excluded from further analysis. Then, the ECG criteria were classified by their potential to differentiate left ventricular geometries: NL from CR (Group 1), NL from CH (Group 2), NL from EH (Group 3), CR from CH (Group 4), CR from EH (Group 5), and CH from EH (Group 6). ROC curves and AUC (95%CI) of all 31 ECG criteria were obtained.
The ECG criteria were dichotomized by a specific cut value (reported in the literature or a cut value with 80% specificity), and 2 × 2 tables were constructed. We obtained accuracy and 95% CI, sensitivity, specificity, positive predictive value, and negative predictive value. Delong’s method was used to compare the AUC 95% CI of the ECG criteria with higher AUC 95% CI for each left ventricular geometry to all other criteria.
Multivariable linear regression models were used to examine the effect of the left ventricular geometry in the resultant voltage of the most useful ECG criteria (Cornell [ECG 21] and modified Cornell [ECG 31]). The dependent variable is the ECG criteria in millivolts and the independent variable, each abnormal left ventricular geometry (CR/other geometries), (CH/other geometries), and (EH/other geometries). All the models were adjusted for the next covariates: age (years), gender (men/woman), body mass index (kg/m2), hypertension (yes/no), ischemic heart disease by Echo (yes/no), diabetes (yes/no), and chronic heart disease (yes/no). Linearity was addressed with a scatterplot (y = dependent variable, x = z predictor), independence of error was defined as a Durbin-Watson test from 1.5 to 2.5, homoscedasticity was approached with a scatterplot (y = z predictor, x = z residual), multivariable normality was addressed with kurtosis/standard error (NL if > 1.98), and multicollinearity was defined as a variance inflation factor of < 3.
All statistical tests were two sided, and p < 0.05 was considered statistically significant. Only missing values of comorbidities were permitted, and complete case analyses were performed.
Results
The distribution of the left ventricular geometries was NL (n = 148, 22%), CR (n = 236, 35.1%), CH (n = 235, 35%), and EH (n = 53, 7.9%). Patients with NL were younger (mea n = 59.9, SD=16) compared with the other three left ventricular geometries (p = 0.0001) (Table 1). Patients with CH have higher body mass index (28.6, 5.6) than NL (27, 4.4) and EH (27.3, 5.8) (p = 0.03) (Table 1). The proportion of subjects with a medical history of Echo ischemic heart disease, diabetes mellitus, hypertension, chronic heart disease, chronic kidney disease, atrial fibrillation, atrial flutter, and arterial disease was different between left ventricular geometries (Table 1). Except for peripheral arterial disease and chronic kidney disease – which were more frequent in the CH group – all comorbidities were more frequent in the EH group (Table 1). As expected, al Echo parameters were different between left ventricular geometries (p < 0.0001).
Tabla 1 Demographic, anthropometrics, and echocardiographic parameters of the patients included in this study
| Variables | NL (n = 148, 22%) | CR (n = 236, 35.1%) | CH (n = 235, 35%) | EH (n = 53, 7.9%) | p | ||||
|---|---|---|---|---|---|---|---|---|---|
| Demographic and anthropometrics | |||||||||
| Age(years)(Mean, SD) | 59.9a | 16 | 64a, b | 15.1 | 66.7b | 14.3 | 67b, c | 13.2 | 0.0001 |
| Gender(female/male)(n, %) | 61/87 | 41.2/58 | 90/146 | 38.1/61. | 116/119 | 49.4/50.6 | 21/32 | 39.6/60.4 | 0.086 |
| Weight(kg)(Mean, SD) | 76.8a | 15.9 | 80.1a | 17.4 | 79.8a | 19.1 | 77.5a | 17.6 | 0.26 |
| Height(cm)(Mean, SD) | 147.7a,c | 55.2 | 140.4a | 62.5 | 166.6b | 9.7 | 164.8b,c | 25.2 | 0.0001 |
| Body surface area(Mean, SD) | 1.9a | 0.2 | 1.9a | 0.3 | 1.9a | 0.3 | 1.9a | 0.3 | 0.47 |
| Body mass index(Mean, SD) | 27a | 4.4 | 28.1a, b | 4.9 | 28.6b | 5.6 | 27.3a, b | 5.8 | 0.03 |
| Patients medical history | |||||||||
| Pacemaker(n, %) | 3 | 3.7 | 0 | 0 | 3 | 1.7 | 0 | 0 | 0.461 |
| Ischemic heart disease(n, %) | 39 | 37.9 | 73 | 47.7 | 75 | 38.3 | 29 | 61.7 | 0.012 |
| Echo ischemic heart disease(n, %) | 21 | 14.2 | 42 | 17.8 | 36 | 15.3 | 18 | 34 | 0.008 |
| Diabetes mellitus(n, %) | 26 | 26 | 31 | 21.8 | 73 | 36 | 19 | 42.2 | 0.008 |
| Hypertension(n, %) | 42 | 41.2 | 77 | 54.2 | 134 | 65.4 | 32 | 71.1 | 0.0001 |
| Chronic heart disease(n, %) | 9 | 9 | 7 | 4.9 | 22 | 10.8 | 13 | 28.9 | 0.0001 |
| Chronic kidney disease(n, %) | 5 | 5 | 6 | 4.2 | 25 | 12.3 | 4 | 8.9 | 0.03 |
| Rheumatoid arthritis(n, %) | 1 | 1 | 1 | 0.7 | 5 | 2.5 | 2 | 4.4 | 0.316 |
| ECG atrial fibrillation(n, %) | 6 | 4.1 | 11 | 4.7 | 23 | 9.8 | 10 | 18.9 | 0.001 |
| Atrial fibrillation/flutter history(n, %) | 14 | 13.3 | 17 | 11 | 38 | 18.7 | 14 | 31.1 | 0.008 |
| Pulmonary embolism(n, %) | 3 | 3 | 6 | 4.2 | 2 | 1 | 1 | 2.2 | 0.28 |
| Sick sinus syndrome(n, %) | 2 | 2 | 0 | 0 | 3 | 1.5 | 0 | 0 | 0.348 |
| Arterial disease(n, %) | 0 | 0 | 2 | 1.4 | 20 | 9.9 | 3 | 6.7 | 0.001 |
| Supraventricular tachycardia(n, %) | 5 | 5 | 6 | 4.2 | 3 | 1.5 | 2 | 4.4 | 0.306 |
| Stroke(n, %) | 5 | 5 | 15 | 10.6 | 24 | 11.8 | 3 | 6.7 | 0.241 |
| Dyslipidemia(n, %) | 13 | 13 | 20 | 14.1 | 33 | 16.3 | 10 | 22.2 | 0.506 |
| Obstructive sleep apnea(n, %) | 1 | 1 | 0 | 0 | 3 | 1.5 | 1 | 2.2 | 0.47 |
| Peripheral artery disease(n, %) | 2 | 2 | 8 | 5.6 | 6 | 3 | 2 | 4.4 | 0.439 |
| Pulmonary hypertension(n, %) | 1 | 1 | 1 | 0.7 | 3 | 1.5 | 2 | 4.4 | 0.302 |
| Hypothyroidism (n, %) | 4 | 4 | 11 | 7.7 | 27 | 13.3 | 5 | 11.1 | 0.057 |
| Echocardiographic parameters | |||||||||
| IVST(mm)(Mean, SD) | 0.9a | 0.1 | 1.1b | 0.2 | 1.4c | 0.3 | 1.1b | 0.2 | p < 0.0001 |
| LVID(mm)(Mean, SD) | 4.8a | 0.5 | 4.1b | 0.6 | 4.6a | 0.7 | 5.6c | 0.5 | p < 0.0001 |
| LVPWT(mm)(Mean, SD) | 0.9a | 0.1 | 1.1b | 0.2 | 1.4c | 0.2 | 1.1d | 0.1 | p < 0.0001 |
| RWT(Mean, SD) | 0.4a | 0 | 0.6b | 0.1 | 0.6c | 0.2 | 0.4a | 0 | p < 0.0001 |
| LVM(g/m)(Mean, SD) | 151.3a | 37 | 157.8a | 39.8 | 258.6b | 70.8 | 250.7V | 62.1 | p < 0.0001 |
| LVMI(g/m2)(Mean, SD) | 79.8a | 15.4 | 81.5a | 15.7 | 134.5b | 28.8 | 132.5b | 27.4 | p < 0.0001 |
NL: normal; CR: concentric remodeling; CH: concentric hypertrophy; EH: eccentric hypertrophy; Echo: echocardiogram; disease; IVST: diastolic interventricular septum thickness; LVID: diastolic left ventricular internal diameter; LVPWT: diastolic left ventricular posterior wall thickness; RWT: relative wall thickness; LVM: left ventricular mass; LVMI: left ventricular mass index, SD: standard deviation. Table 1 shows the demographic, anthropometric, and echocardiographic parameters classified by the left ventricular geometry. Data are presented as the mean (SD) or as n (%). Cells that do not share subindex letters have a statically different mean considering p < 0.05.
Supplement Table S2 and Supplement figure S1 show an extensive report of all 31 ECG criteria distributions and diagnostic performance for detecting distinct left ventricular geometries. The AUC 95%CI in all left ventricular geometries (groups 2-5) was similar (p > 0.05) (Supplement Table S2). The sensitivity of all ECG criteria ranged from 0.4% to 37.9% in all left ventricular geometries (Supplement Table S2). The specificity of the criteria ranged from 65.5% to > 95%, irrespective of which left ventricular geometry (Supplement Table S2).
The overall best ECG criteria for detecting distinct left ventricular geometries based on AUC were Cornell (ECG21, SV3 + RaVL) and modified Cornell (ECG 31, RaVL + deepest S in all leads) (Fig. 1). Figure 2 shows the distribution of the Cornell and modified Cornell criteria. ECG 21 (Cornell) has the highest AUC in most left ventricular geometries: NL versus CH (AUC = 0.666), NL versus EH (AUC = 0.686), CR versus CH (AUC = 0.687), and CR versus EH (AUC = 0.718). Cornell criteria (ECG21) do not differentiate NL versus CR nor CH versus EH (Supplement Table S2, Fig. 2). ECG 31 (modified Cornell) has the second highest AUC in most left ventricular geometries: NL versus CH (AUC = 0.646), NL versus EH (AUC = 0.656), CR versus CH (AUC = 0.661), and CR versus EH (AUC = 0.676). Modified Cornell (ECG31) does not distinguish elevated RWT from NL RWT (NL vs. CR or CH vs. EH) (p > 0.05) (Fig. 1). Although Cornell (ECG 21) has a higher AUC than modified Cornell (ECG31), the differences were not significant (p > 0.05).
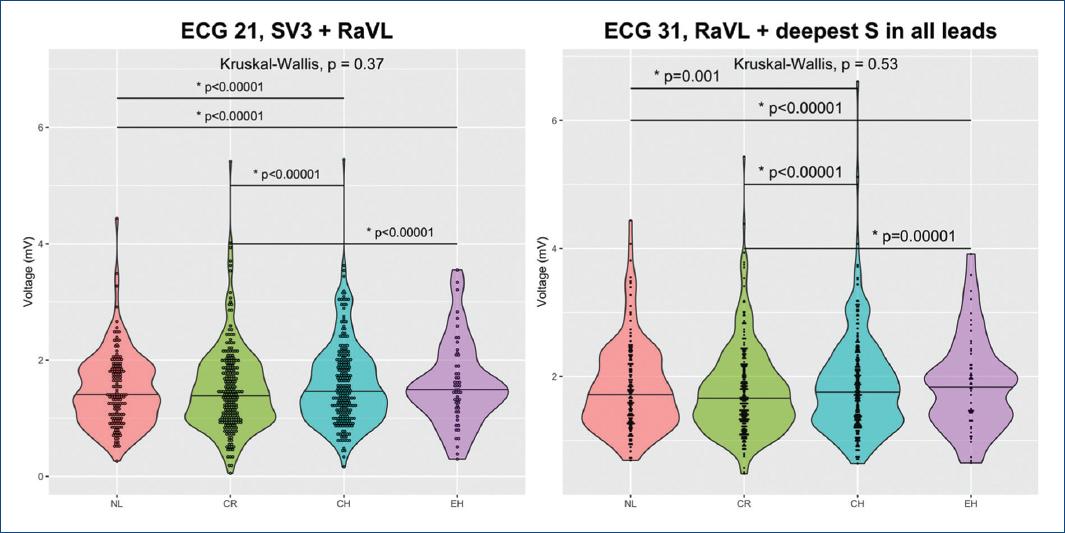
Figure 2 Shows violin plots of the distribution of the voltage of ECG 21 (Cornell, SV3+RaVL) and ECG 31 (modified Cornell, RaVL + deepest S in all leads) by distinct left ventricular geometries (normal geometry, concentric remodeling, concentric hypertrophy, and eccentric hypertrophy). Small circles represent the distribution of specific cases from each left ventricular geometry.
Multiple linear regression models showed that the left ventricular geometry has a significant effect in the result in the Cornell (ECG21) and modified Cornell (ECG31) criteria after adjusting by age, gender, body mass index, hypertension, ischemic heart disease by Echo, diabetes, and chronic heart disease (Table 2). Model 1 and Model 2 explain 16.2% (adjusted R2 = 0.162) and 14.8% (adjusted R2 = 0.148) of the variance of the voltage of the ECG criteria. CH and EH have the strongest effect (highest ß standard) of all the variables in the model, but CR was not significant. No confounding variables were found.
Tabla 2 Multivariable linear regression models of independent factors influencing the total voltage of Cornell and modified Cornell criteria
| Variables | ß Non-standard | Standard error | ß standard | t | p-value | 95%CI |
|---|---|---|---|---|---|---|
| Model 1. ECG 21(Cornell criteria) | ||||||
| Cardiac remodeling | −0.028 | 0.091 | −0.017 | −0.311 | 0.756 | −0.207-0.151 |
| Concentric hypertrophy | 0.458 | 0.086 | 0.304 | 5.329 | < 0.00001 | 0.289-0.627 |
| Eccentric hypertrophy | 0.477 | 0.126 | 0.185 | 3.772 | < 0.00001 | 0.228-0.725 |
| Male gender | 0.262 | 0.065 | 0.176 | 4.067 | < 0.00001 | 0.136-0.389 |
| Age(years) | −0.002 | 0.002 | −0.039 | −0.867 | 0.387 | −0.006-0.002 |
| Body mass index(kg/m2) | −0.016 | 0.006 | −0.112 | −2.56 | 0.011 | −0.028-0.004 |
| Hypertension | 0.142 | 0.069 | 0.094 | 2.049 | 0.041 | 0.006-0.278 |
| Ischemic heart disease by Echo | −0.138 | 0.083 | −0.073 | −1.672 | 0.095 | −0.3-0.024 |
| Diabetes | −0.064 | 0.073 | −0.039 | −0.872 | 0.383 | −0.207-0.08 |
| Chronic heart disease | 0.382 | 0.105 | 0.157 | 3.65 | < 0.00001 | 0.176-0.587 |
| Model 2. ECG 31(modified Cornell) | ||||||
| Cardiac remodeling | −0.022 | 0.096 | −0.013 | −0.225 | 0.822 | −0.211-0.167 |
| Concentric hypertrophy | 0.466 | 0.091 | 0.297 | 5.124 | < 0.00001 | 0.287-0.645 |
| Eccentric hypertrophy | 0.415 | 0.134 | 0.154 | 3.101 | 0.002 | 0.152-0.679 |
| Male gender | 0.272 | 0.068 | 0.175 | 3.999 | < 0.00001 | 0.138-0.405 |
| Age(years) | −0.005 | 0.002 | −0.097 | −2.141 | 0.033 | −0.01-0 |
| Body mass index(kg/m2) | −0.025 | 0.007 | −0.173 | −3.903 | < 0.00001 | −0.038-0.013 |
| Hypertension | 0.113 | 0.073 | 0.072 | 1.548 | 0.122 | −0.03-0.256 |
| Ischemic heart disease by Echo | −0.138 | 0.087 | −0.07 | −1.59 | 0.112 | −0.308-0.032 |
| Diabetes | −0.055 | 0.077 | −0.033 | −0.717 | 0.474 | −0.206-0.096 |
| Chronic heart disease | 0.334 | 0.11 | 0.133 | 3.046 | 0.002 | 0.119-0.55 |
Table 2. Multivariable linear regression models of the influence of left ventricular geometry on ECG criteria. These models include the continuous ECG voltage as the dependent variable and abnormal Echo left ventricular geometries, gender, age, body mass index, hypertension, ischemic heart disease by Echo, diabetes, and chronic heart disease as independent variables.
The structure of these models is: Model (ECG 21 or ECG 31) = ß0 + ß1 * CR + ß2 * CH + ß3 * EH + ß4 * Gender + ß5 * Age + ß6 * BMI+ß7 * Hypertension + ß8 * IHD by Echo + ß9 * Diabetes + ß10 * Chronic heart disease.
Where, the dependent variable is the ECG criteria, ß0 = intercept, ß1- ß10 = covariates estimate, CR (CR vs. other geometry), CH (CH vs. other geometry), EH (EH vs. other geometry), gender = (female/male), Age = years, body mass index = kg/m2, hypertension = (present/absent), ischemic heart disease by Echo (present/absent), diabetes (present/absent), and chronic heart disease (present/absent).
Discussion
This study explored the diagnostic utility of 31 ECG criteria for detecting Echo left ventricular geometries (NL, CR, CH, and EH) and selected ECG 21 (Cornell criteria, SV3+RaVL) and ECG 31 (modified Cornell criteria, Ravl + SD [the deepest S wave in 12-lead ECG]) as the most useful in this population. None of the state-of-the-art ECG criteria help differentiate NL from CR nor CH from EH. Cornell (ECG 21) and modified Cornell (ECG31) are the most useful to differentiate NL from CH, NL from EH, CR from CH, and CR from EH. Most ECG criteria have low to moderate AUC 95%CI and accuracies, low sensitivities, and moderate to high specificity. The EH group is small, and therefore, results are preliminary. Furthermore, multivariable models showed that CH and EH geometries have a stronger influence on the Cornell and modified Cornell criteria than age, body mass index, hypertension, diabetes, and chronic heart disease (Table 2). CH and EH had a similar effect than male gender.
Most of the attention has been to optimize the ECG for predicting Echo left ventricular hypertrophy but not Echo left ventricular geometry. Still, the latter is essential as it conveys cardiovascular morbidity and mortality1,2-4,8. CH and EH are the two main geometries of Echo left ventricular hypertrophy. These two geometries differ from a hemodynamic, neurohormonal, and treatment response point of view4. For example, CH has an elliptic left ventricle, high peripheral vascular resistance, NL stroke volume, elevated plasma renin, elevated natriuretic peptide levels, and therapeutic response with angiotensin II antagonist and beta-adrenergic blockers4. On the other hand, patients with EH have a spherical left ventricle, increased peripheral vascular resistance, increased stroke volume, and a lack of response to antihypertensive treatment4. The VALIANT trial prospectively recruited 14,703 patients with high-risk acute myocardial infarction and found that abnormal left ventricular geometry (high RWT) (hazard ratio: 1.60 per 0.1 unit increase in RWT; 95%CI: 1.30-1.90; p < 0.001) was associated with an increased risk of cardiovascular complications. The risk of death was lowest in NL and increased with left ventricular abnormal geometries; CR (hazard ratio: 3.0; 95%CI: 1.9-4.9), EH (hazard ratio: 3.1; 95% CI: 1.9-4.8), and CH (hazard ratio: 5.4; 95%CI: 3.4-8.5), after adjusting for baseline covariates2. The ECG could have utility in the clinical setting where Echo is lacking. Maybe, in the future, we could extend its utility to the detection of earlier stages of the disease (i.e., CR).
Few papers have addressed ECG criteria for Echo left ventricular geometry, and most studies are limited to patients with hypertension6,7,10. For example, a study that included 381 patients with hypertension correlated changes in the left ventricular geometry with the modified Cornell criteria RaVL + SD (the deepest S wave in 12-lead ECG), Sokolow-Lyon criteria (RV5/V6 + SV1), and Cornell criteria (RaVL + SV3)7. The study found that the distribution of the three criteria was different in all left ventricular morphologies (p ≤ 0.01 for all)7. However, only the modified Cornell criteria (ECG 31) were significantly different in all left ventricular geometries in univariate and multivariable analysis7. This difference was only true for males, and Sokolow-Lyon criteria (RV5/V6 + SV1) and Cornell criteria (RaVL + SV3) did not differentiate NL from CR7. In the present study, Cornell criteria ECG 21 (SV3 + RaVL) and the modified Cornell criteria (ECG 31) (RaVL + SD (the deepest S wave in 12-lead ECG) were able to differentiate three or more left ventricular geometries (NL from CH and EH, CR from CH and EH). Another study showed that in patients with untreated hypertension, a combination of ECG voltage criteria (Sokolow-Lyon, Cornell, and RV6/V5 ratio) were helpful in the identification of four different morphologies with accuracies of 67% in NL, 81% CR, 68% CH, and 60% EH6. Sensitivities ranged from 44% in EH to 68% in NL, and specificities ranged from 64% in EH and 84% in CR6.
Previously, a study in this population showed that from 22 state-of-the-art ECG criteria, the Dalfó criteria (SV3 + RaVL > 1.6 mV in males or > 1.4mV in females) have the best overall accuracy (64.1% [95% CI, 59.5-68.6]) for detecting Echo left ventricular hypertrophy (CH + EH) in general and in specific populations (i.e., both genders, all body mass index, older patients [> 60 years], and in those with Echo ischemic heart disease)11. It also performed well in patients with hypertension. VDP Cornell (> 244 mV*msec in males and > 207 mV*msec in females) had the best accuracy in patients < 60 years old and patients without ischemic findings by Echo11. The Dalfó criterion is the same as the Cornell criterion, but they differ in the cutoff value (> 1.6 mV in males or > 1.4mV in females versus > 2.8 mV in males or >2mV in females)8,12. Therefore, this study concludes that the sum of SV3 and RaVL in any version (i.e., Cornell criteria [ECG 21], modified Cornell criteria [ECG 31], Dalfó criteria, and VDP Cornell) is the best way to approach Echo left ventricular hypertrophy and changes in the left ventricular geometry with the ECG. However, the accuracy of these criteria is moderate, and sensitivity is low. Efforts to create more complex and accurate ECG models for predicting Echo left ventricular geometries are needed.
Limitations and future works
This study included a consecutive sample of patients to reproduce the actual prevalence of each left ventricular geometry in our population. However, the EH group is small, so results in this group are considered preliminary. A more significant sample could help to reproduce these results. Another limitation is that this study did not address the effect of antihypertensives or exercise on the geometry of the left ventricle.
This study included patients under the age of 35. This age permissive inclusion criterion contrasts with current guidelines recommendations3. However, a study that included 17,310 males aged 16-23, who reported for medical screening, showed that machine learning models (i.e., GLMNet, Random Forests, Gradient Boosting Machines) were superior to classical ECG for detecting Echo left ventricular hypertrophy13. Therefore, patients under 35 years were included in this analysis.
This project demonstrated the lack of an ECG criterion with sufficient accuracy to predict Echo left ventricular geometries. Machine learning models can help in this matter (i.e., C5.0, neural networks)14. Furthermore, new models that include other specific predictors of concentric or eccentric left ventricular geometries such as large weight circumference, neck circumference, systolic blood pressure, hyperuricemia, and alcohol use could increase the diagnostic performance of ECG15. Future papers will address vector cardiography data in this sample of patients.
Conclusions
This study explored 31 state-of-the-art criteria and selected Cornell criteria (ECG 21, RaVL + SV3) and modified Cornell (ECG 31, RaVL + SD (the deepest S wave in 12-lead ECG)) as the best criteria for predicting different Echo left ventricular morphologies (NL, CR, CH, and EH) based on AUC and accuracy. None of the 31 state-of-the-art ECG criteria can differentiate NL from CR or CH from EH. In general, ECG criteria have a modest AUC and accuracy, low sensitivities, and moderate to high specificity for detecting Echo left ventricular geometry. However, application of Cornell and modified Cornell criteria in daily clinical practice is easy, and even though these criteria have moderate accuracy, they represent the most accessible way to approach left ventricular geometry. Furthermore, the Echo left ventricular geometry has a stronger effect on the result of the ECG criteria than age, gender, body mass index, hypertension, diabetes, and chronic heart disease. This study in conjunction with previous publications let to conclude that the sum of SV3 and RaVL in any version (i.e., Cornell [ECG 21], modified Cornell [ECG 31], Dalfó criteria, and VDP Cornell) is the best way to approach Echo left ventricular hypertrophy and changes in the left ventricular geometry with the ECG. More complex models such as machine learning multilevel classifiers could get a more realistic model of the electrical changes in different left ventricular geometries.

