


 text new page (beta)
 English (pdf)
 Article in xml format
 Article references
 Send this article by e-mail
 Cited by SciELO
  Similars in
SciELO
Similars in
SciELO 
 Permalink
Introduction
Severe acute respiratory syndrome coronavirus 2 (SARS-CoV-2) is the causative agent of the ongoing pandemic of the coronavirus disease 2019 (COVID-19). However, the explosive growth in the number of papers has made tracking the most relevant findings increasingly difficult. Bibliometric techniques focus on scientific productivity and their impact. In fact, bibliometrics now stand as the “Google Maps” of medical investigation, showing not only the highways but also the unpaved roads and the mountains and valleys of research. Moreover, bibliometric analysis is the “psychology of scientific thinking,” because the individual study of clusters of articles helps in drafting the patterns that govern the collective mind of authors. This bird's eye view will cast light on both the gaps and overcrowded areas of science and may act as a conductor who guides the orchestra of science, setting the tempo, ensuring correct entries by ensemble members, and shaping the phrasing where appropriate.
The National Library of Medicine of the United States considers Bibliometrics as “the use of statistical methods in the analysis of a body of literature to reveal the historical development of subject fields and patterns of authorship, publication, and use. Formerly called statistical bibliography”1, thus, the present study includes an exhaustive analysis of the scientific publications.
Bibliometric studies have been published by prestigious journals in Cardiology2,3 and Medicine4, including Archivos de Cardiología de México5. Furthermore, this journal has published at least 18 studies about the impact of COVID-19 for cardiovascular health.
Records of COVID publications are now in the tens of thousands, which are well beyond the capacity of any reader. Bibliometrics help to find, measure, track, and compare literature. Where should we start reading? Which articles are from a given country? What are the areas that have been explored? Which are the most impactful papers?
The first COVID-19 papers were published during the first quarter of 2020, and therefore, this period is crucial to understanding not only the disease itself but also later developments in the research. The present study aimed to analyze both the number of publications and their citations, because the goal of bibliometrics is to examine the knowledge structure and evolution of research fields based on analysis of related publications.
We included these variables to inquire if the number of cases, gross domestic product (GDP) and population size would keep some relationship with the amount of research during the first months of the pandemic.
This makes an international review of what research is conducted, where and by whom research is done, an insightful exercise and useful source of an expeditious and efficient global research effort6.
Methods
Article selection, citations retrieval
We retrieved scientific items from PubMed (January 2020-March 2020) as in the previous studies7 using the following search terms and Boolean operators: “COVID-19,” “coronavirus 2019,” “COVID-19 virus,” and “SARS-CoV-2.” Their citations in Scopus database were recorded on June 25, 2020. By manual review, we eliminated duplicated papers and those not about COVID-19. We did not include the analysis of citations of those papers which were not indexed in Scopus.
We recorded article title, journal, journal Impact Factor (2 years IF, from Journal Citation Reports, year 2019), journal country, type of article, article category, language, affiliation country (first author), and number of authors per article.
Type of article was classified into 10 categories: original research, review, commentary, editorial, letter, news, report, viewpoint, guidelines and consensus, and other.
Categories of publications were 10: diagnosis, epidemiology, pathophysiology, prevention, prognosis, public health, social issues, special populations, treatment, and other.
Coauthorship network was analyzed using VOSviewer version 1.6.15 (Leiden University, The Netherlands).
Demographic data
Population size by April 25 was recorded based on the latest United Nations (UN) Population Division estimates (https://www.worldometers.info/world-population/)8, and the most recent GDP (2018) were obtained from the World Bank on April 28, as in the previous studies9.
Statistical analysis
Normality of data was analyzed with Kolmogorov-Smirnov test and bivariate correlations with Spearman's correlation. Variables with significant correlation at p < 0.100 were included in a multivariate analysis.
A multiple linear regression model was analyzed using log-transformed values for number of publications per journal countries or per countries as dependent variables, and GDP, population size, total cases, and deaths as independent variables. Graphs were made using GraphPad Prism 8 (GraphPad Software, CA, USA), world maps in Mapchart website10, and statistical analyses with SPSS 25 (IBM, NY, USA). Significance was accepted at a bilateral p < 0.05 level.
Results
Publications
We initially identified 2838 papers (114 from January, 695 from February, and 2029 for March), but eliminating 308 duplicated/unrelated papers, the final analysis considered 2530 articles.
Countries
The identified papers were written by authors from 75 countries, but the first authors represented 67 countries only in total: 65 countries and two territories (Puerto Rico and Palestine) according to the UN 2020 list (Table 1, Fig. 1A). China was the country with the most publications (988, 39%), followed by the United States (US, 423, 16.7%), the United Kingdom (UK, 250, 9.8%), Italy (156, 6.1%), Singapore (69, 2.7%), Canada (60, 2.4%), India (47, 1.8%), France (43, 1.7%), South Korea (42, 1.6%), and Switzerland (43, 1.6%). Thus, these top 10 nations account for 83% of the papers and including the next 10 (Germany, Australia, Japan, Iran, Thailand, Brazil, Sweden, Spain, Saudi Arabia, and Colombia) increases the amount to 94%, leaving 6% for the other 47 countries (Fig. 1A). The complete list along with the listed parameters is available from the corresponding author as an Excel file.
Table 1 Number of countries with cases/publications on COVID-19*
| Month | ≥ 1 confirmed case | ≥ 1 paper per country | ≥ 1 paper per author |
|---|---|---|---|
| January | 9.9 (20) | 7.4 (15) | 11.4 (23) |
| February | 26.8 (54) | 13.4 (27) | 19.4 (39) |
| March | 100 (201) | 15.9 (32) | 30.3 (61) |
*The table shows the percentage and number of countries with at least one confirmed case or publication; however, the percentage and number of countries with at least one publication were lower than that of countries with at least one confirmed case, except for January.

Citations
Because 151 papers lacked indexing in Scopus, all calculations involving citations and impact were made based on 2379 papers and accumulated 59,104 citations by June 25 (an average of 23.4 citations/paper) with an L0 uncitedness index of 16%. This corpus has an H-index of 105 papers and that elite group amasses 31,977 citations. However, those numbers may be underestimated due to some delay in database updating.
For the four countries which have contributed the most to citations, their absolute (and relative) contribution to world global citation count is China 36,416 (61.6%), the US 7458 (12.6%), the UK 3299 (5.6%), and Italy 2576 (4.3%). Here, the Matthew effect is further increased, as the top 10 countries sum up 95% of citations (56,049/59,104) and the top 20 accumulate 98.3% (58,084/59,104) (Fig. 1B).
Number of citations per article
The podium medalists were the Netherlands, China, and Germany (49, 41, and 40.9, respectively). Japan and the highly affected Mediterranean countries underperformed and are below the mean (23.4). Respectively, the number of papers was for Italy, Spain, and Japan: 148, 16, and 22, total citations 2576, 91, and 306, and mean citations/paper 17.4, 5.7, and 13.9. The US (18.2) and the UK (13.5) come modestly in the 8th and 20th place, and France (12.7) is not in the top 20. Both countries on either side of the Channel have counts around approximately half of the mean citations per article.
Journals
We found 632 different journals, 521 of them indexed by the JCR. The median IF of the journals was 5.099 (0.161-70.670). The top journals were The New England Journal of Medicine (IF 70.67), The Lancet (IF 59.10), and Nature Reviews Drug Discovery (IF 57.61). The journals were American (204, 32.3%), British (138, 21.8%), Chinese (52, 8.2%), Dutch (30, 4.7%), German (28, 4.4%), or from other 32 countries (32 journals, 5%). Country origin could not be determined for seven journals (1.1%).
Article category
In decreasing order, the categories were as follows: public health: 435 (17.2%), diagnosis: 406 (16%), epidemiology: 320 (12.6%), special populations: 300 (11.8%), social issues: 288 (11.4%), pathophysiology: 226 (8.9%), treatment: 223 (8.8%), prevention: 130 (5.1%), prognosis: 45 (1.8%), and other topics (ethics, rehabilitation): 157 (6.2%).
In public health, the US was the top publisher with 103 papers, but China was the first in all other categories (diagnosis 262, epidemiology 104, pathophysiology 102, prevention 43, prognosis 23, social issues 68, special populations 131, and treatment 95).
The proportion of categories was highly uneven and some countries showed a relative greater interest in specific areas: diagnosis accounted for 30.4% publications in Thailand, epidemiology 64.7% in Sweden, pathophysiology 16.6% in Colombia; prevention 11.6% in Singapore, prognosis 4.6% and treatment 25.6% in France; and Iran accumulated 37% in social issues and 22.2% about special populations. The most common category for the podium medalists was: diagnostic articles for China (262, 26.4% of 988); public health for the US and the UK, with respective figures of 103 (24.2% of 423) and 96 papers (39% of 250) (Fig. 2A).
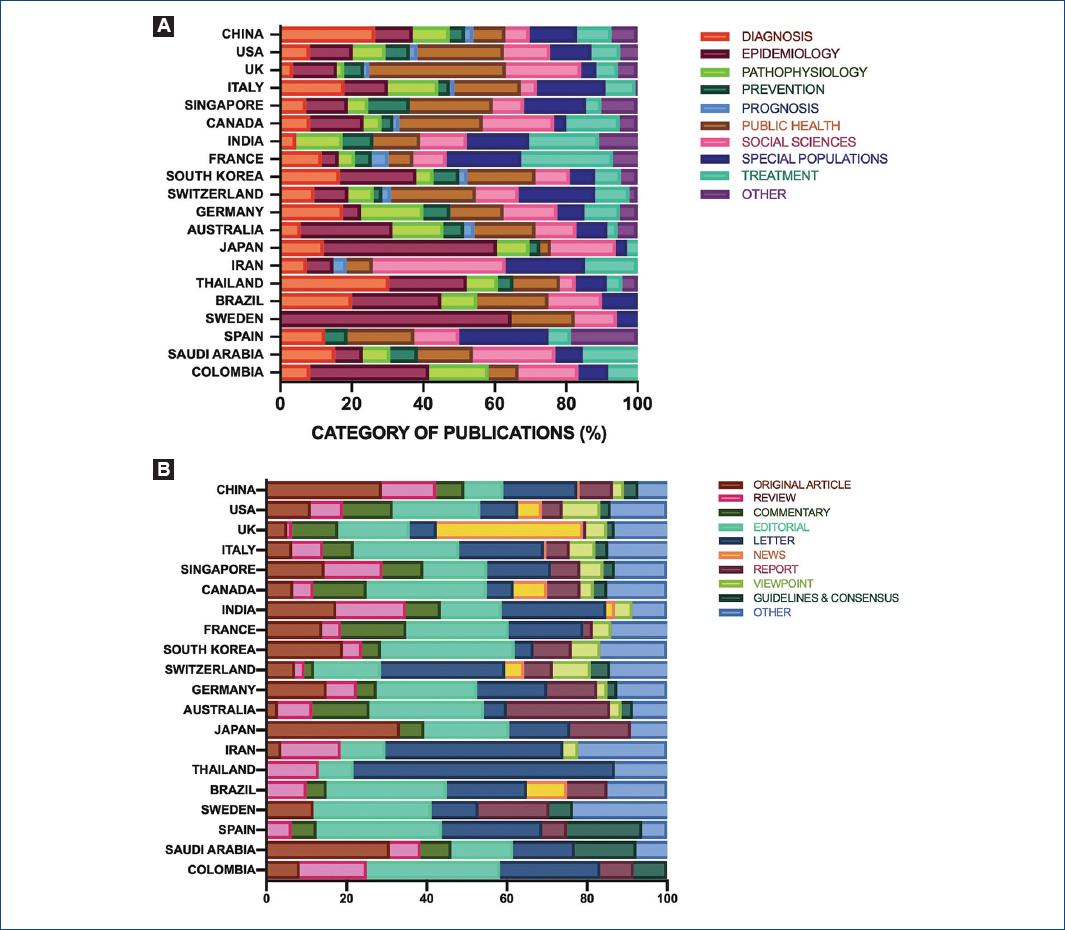
Article type
Only 435 articles (17.2%) were original, 430 (17%) editorial, 406 (16%) letters, 280 (11%) “other,” 240 (9.5%) review, 221 (8.7%) commentaries, 167 (6.6%) reports, 156 (6.2%) news, 118 (4.7%) viewpoints, and 77 (3%) guidelines and consensuses. Out of 435 original articles, 65.5% (285) were Chinese and 10.8% (47) American (representing 29.4% and 11.1% of their own totals).
In the following categories: “commentary,” “editorial,” “review,” and “letter,” China was the top with 70 (31.7%), 97 (22.5%), 133 (55.4%), and 182 (44.8%), respectively, followed by the US with 53 (24%), 93 (21.6%), 34 (14.1%), and 40 (9.8%), respectively. “News” was dominated by the UK with 92 papers (59%), followed by the US with 25 (16%), and then China and Canada with 5 (3.2%) each. The highest number of “report” articles was led by China with 83 (49.7%), while “viewpoint” articles were dominated by the US with 40 (33.9%). Finally, China and the US published more than 50% of the current guidelines and consensuses (36 [46.7%] and 11 [14.3%], respectively) (Fig. 2B).
Language of publication
The main languages were English and Chinese (2288 [90.4%] and 199 [7.9%], respectively). Other languages were French, German, Spanish, Portuguese, Hebrew, Icelandic, Italian, Norwegian, and Polish.
Coauthorship network
According to the first author country, the publication with the greatest number of coauthors in a single study was the US with 55 coauthors, followed by China with 54 coauthors, and Sweden with 52. Articles from China had an average of 6.5 coauthors per article, US 4.6, UK 2.9, Italy 5.8, Singapore 6.8, Canada 4.3, India 5.1, France 7.5, South Korea 4.1, and Switzerland 4.4. The average number of coauthors per article globally was 5.3.
The coauthorship network identified 10,756 authors. There were 6032 authors not linked to any other. Median link strength (representing the extent of the authors' collaborations) was 9 (0-194). The median number of documents per author was 1 (1-31). The author with the most publications was “Mahase, Elisabeth” (31), followed by “Wiwanitkit, Viroj” (17) and “Iacobucci, Gareth” (15); the highest total link strength was by “Liu Lei” (194), followed by “Guo, Li” (183) and “Li, Hui” (168). A total of 8963 (83%) authors were mentioned in one document only.
The 4724 linked authors were distributed in 79 clusters, the largest cluster consisted of 158 authors, and the smallest (2 clusters) consisted of 13 authors (Fig. 3).

Correlation of COVID-19 cases and publications per month
Data on total cases and deaths were obtained from the WHO reports. The number of papers and citations for each country is given in Table 2.
Table 2 COVID-19 PubMed publications by country (January-March 2020)
| R | Country | p | c | R | Country | p | c | R | Country | p | c | R | Country | p | c |
|---|---|---|---|---|---|---|---|---|---|---|---|---|---|---|---|
| 1 | China | 988 | 37,417 | 18 | Spain | 16 | 91 | 35 | Malaysia | 4 | 28 | 52 | Honduras | 1 | 6 |
| 2 | USA | 423 | 7,458 | 19 | Saudi Arabia | 13 | 106 | 36 | Turkey | 4 | 7 | 53 | Croatia | 1 | 3 |
| 3 | UK | 250 | 3,299 | 20 | Colombia | 12 | 189 | 37 | South Africa | 4 | 6 | 54 | Hungary | 1 | N/A |
| 4 | Italy | 156 | 2,576 | 21 | Netherlands | 9 | 391 | 38 | Afghanistan | 3 | 0 | 55 | Iceland | 1 | 0 |
| 5 | Singapore | 69 | 1,252 | 22 | Belgium | 8 | 58 | 39 | Ethiopia | 3 | 27 | 56 | Kenya | 1 | 10 |
| 6 | Canada | 60 | 809 | 23 | Mexico | 8 | 26 | 40 | Finland | 3 | 21 | 57 | Myanmar | 1 | 1 |
| 7 | India | 47 | 314 | 24 | Norway | 8 | 10 | 41 | Ireland | 3 | 15 | 58 | Malta | 1 | 3 |
| 8 | France | 43 | 535 | 25 | Israel | 7 | 101 | 42 | Mali | 3 | 24 | 59 | Maurice | 1 | N/A |
| 9 | Switzerland | 43 | 676 | 26 | Poland | 7 | 16 | 43 | Qatar | 2 | 2 | 60 | Maldives | 1 | 19 |
| 10 | Korea | 42 | 386 | 27 | Portugal | 7 | 8 | 44 | Austria | 2 | 5 | 61 | Nepal | 1 | 18 |
| 11 | Germany | 40 | 1,636 | 28 | New Zealand | 6 | 30 | 45 | Chile | 2 | 1 | 62 | Peru | 1 | N/A |
| 12 | Australia | 35 | 152 | 29 | Argentina | 5 | 24 | 46 | Jordan | 2 | 9 | 63 | Puerto Rico | 1 | 3 |
| 13 | Japan | 33 | 306 | 30 | Egypt | 5 | 74 | 47 | Nigeria | 2 | 2 | 64 | Palestine | 1 | 2 |
| 14 | Iran | 27 | 129 | 31 | Pakistan | 5 | 110 | 48 | Romania | 2 | 5 | 65 | Paraguay | 1 | 32 |
| 15 | Thailand | 23 | 188 | 32 | Vietnam | 5 | 155 | 49 | Emirates | 1 | 5 | 66 | Uganda | 1 | 5 |
| 16 | Brazil | 20 | 77 | 33 | Denmark | 4 | 54 | 50 | Bangladesh | 1 | 1 | 67 | Zambia | 1 | 1 |
| 17 | Sweden | 17 | 81 | 34 | Greece | 4 | 64 | 51 | Bulgaria | 1 | 3 | 68 | None | 27 | 42 |
JANUARY
Bivariate analysis: no correlation was found in the number of publications per journal country neither with total cases (rho = −0.121, p = 0.647), population size (rho = 0.225, p = 0.420), nor GDP (rho = 0.330, p = 0.250). The number of publications per country was significantly correlated with GDP (rho = 0.549, p = 0.008), population size (rho = 0.533, p = 0.009), and total cases (rho = 0.425, p = 0.043).
Multivariate analysis: the number of publications per country was correlated significantly with total cases only (F(1,10) = 10.5, p = 0.009). The model explained 51% of the variance (r2 = 0.513). Population size (p = 0.249) and GDP (p = 0.101) were not statistically significant. Deaths could not be analyzed because they were reported by one country only.
FEBRUARY
Bivariate analysis: the number of publications per journal country was significantly correlated with total cases (rho = 0.634, p < 0.001) and GDP (rho = 0.500, p = 0.009); there was a trend for a correlation with deaths (rho = 0.348, p = 0.075) and population size (rho = 0.337, p = 0.086). The number of publications per country was significantly correlated with total cases (rho = 0.698, p < 0.001), GDP (rho = 0.585, p < 0.001), deaths (rho = 0.521, p = 0.001), and population size (rho = 0.353, p = 0.027).
Multivariate analysis: the number of publications per journal country was correlated significantly, with total cases only (F(1,21) = 9.9, p = 0.005). The model explained 32% of the variance (r2 = 0.321). GDP (p = 0.163) and population size (p = 0.549) lost significance. The number of publications per country in the same month was significantly correlated (F(2,23) = 21.7, p < 0.001) with total cases (p < 0.001) and GDP (p = 0.019). The model explained 65% of the variance (r2 = 0.654). Population size lost significance (p = 0.900). Deaths were excluded from the model due to collinearity in both situations.
MARCH
Bivariate analysis: the number of publications per journal country was significantly correlated with GDP (rho = 0.681, p < 0.001), deaths (rho = 0.680, p < 0.001), and total cases (rho = 0.676, p < 0.001); there was a trend for a correlation with population size (rho = 0.349, p = 0.051). The number of publications per country in the same month was significantly correlated with GDP (rho = 0.762, p < 0.001), total cases (rho = 0.756, p < 0.001), deaths (rho = 0.694, p < 0.001), and population size (rho = 0.392, p = 0.002).
Multivariate analysis: the number of publications per journal country was significantly correlated with deaths only (F(1,29) = 25.9, p < 0.001). The model explained 47% of the variance (r2 = 0.473). Total cases (p = 0.507), population size (p = 0.166), and GDP (p = 0.124) lost significance. The number of publications per country in the same month was significantly correlated (F(2,48) = 45.5, p < 0.001) with total cases (p ≤ 0.001) and population size (p < 0.001). The model explained 65% of the variance (r2 = 0.655). Deaths (p = 0.257) and GDP (p = 0.206) lost significance.
Discussion
During the first 3 months of the pandemic, we conducted a bibliometric analysis of COVID-19 research in terms of number of papers, citations, type of publication, and geographic origin. Our study yielded several key observations.
First, the present study has included aspects not covered by previous bibliometric studies. Some of them are purely descriptive11-13, or limited to English/Chinese7,14-16, including only “relevant” papers17, or other coronaviruses18, dealing with particular aspects, like safety19, limiting their search to journals of a specific specialty20, or exclude many papers in spite of having similar time frames21-23. We, therefore, include up to 10 times more articles than other researchers and analyze the scientific impact in terms of citations as it has not been done before.
Second, we show that the leaders of science in this new area of knowledge (China) have to turn to the leaders of the journal market (US) to make their achievements visible. China, compared to the US, shows a relation of 6 to 1 in the absolute number of original articles. In addition, the proportion of original articles in China (with respect to its whole research) is also 3 times the percentage of primary research from North America. The other side of the coin is that in this period, the US is only getting a tiny slice of the cake with 16.7% of the papers, but their supremacy is further being whittled away with a meager share of the citations (12.6%). Most high-impact journals are American and China is producing tons of relevant information they have to sell to the world: it is like having a plethora of Chinese goods on the shelves of an American supermarket. To the best of our knowledge, this finding has not been reported.
Third, these 67 nations are 1/3 of all countries, but they harbor 3/4 of the world's population. Among the top 20 most populous nations, remarkably absent are Indonesia (4), Russia (9), Phillippines (13), and Congo (7). Brazil and Mexico are considered the leaders in Latin American science24, but their productivity or impact is less than expected. A highly affected country with low performance is Spain. The scientific community in these countries might implement policies encouraging their native researchers to share their experience. When considering the status of publications of Mexico and Brazil by end July, Mexico is verging the 300 papers and Brazil has surpassed the threshold of 800 publications (Lee et al., unpublished data).
Fourth, we included only the earliest period of the pandemic, but with the increasing number of cases in other countries, the epicenter of research might follow the spread of the virus and therefore these findings should be counterbalanced by studying again the scientific production and impact later this year.
Fifth, in terms of relevance, let us consider citations per paper. We found that the top three were the Netherlands, China, and Germany. This might suggest that Dutch and German researchers, with a modest production compared to China, have nevertheless been the champions of mining the most gold (knowledge) from the largest number of mines. A considerable number of publications in the “news” category (infrequently cited) might explain the unexpectedly low performance of the UK. The notably poorer performance of Spain with respect to Italy (simultaneously and equally affected) has no specific explanation, but both published virtually all their papers in journals indexed by Scopus (taking into account that it may have a delay on their database update). Japan has an unusually large one-third of its publications that were unusable due to these journals not being indexed.
Sixth, some countries exhibit a remarkable proportion of certain categories of research, like France (treatment) or Sweden (epidemiology). A more detailed analysis of this point might open new horizons for other researchers.
Seventh, on May 25, the WHO called Latin America “The COVID-19 epicenter.” Highly affected countries such as Brazil, Chile, Peru, and Mexico show poor performance in this study (Ecuador had no publications). We point at these problems, often forgotten by academia from Latin America, and our knowledge of the region gives us a few clues.
The poor salaries of physicians often lead them to have two jobs, leaving little room for research. Fluency in written English is uncommon. Many researchers submit some “our local experience” papers and are rejected by “major league” journals. This problem of rejection without review is also experienced by other countries25.
However, we affirm that these local experiences have to be published (and publicized) somewhere! Findings of research carried in European countries with different structures may not always be applicable in our limited resources settings. Some common sense solutions might help: more support from hospitals to researchers, foreign journals could give priority to papers coming from Latin America, and regional editors/publishers should target indexation in international databases.
On the other side, a British author publishes that her country holds off closing schools 1 week26, only to publish that schools set to close across the country the next week27. This deserves two papers in the BMJ (IF of 27, 5th in the category of internal medicine), which additionally quotes one of the articles a few weeks later in a paper on “public health response to COVID-19”28. Interestingly, the British author of both papers26,27 is the author with 31 publications in this period.
Eighth, in the 3 months of the study, the number of publications was positively correlated with COVID-19 cases or deaths. Our model explained 32-65% of the variance, corrected by GDP and population size. This indicates countries that were affected the most by the disease achieved the largest contributions to the medical literature and reflects the awareness of scientific communities trying to find solutions.
Ninth, the relevance of bibliometric studies to the medical practice has been previously discussed29. According to some authors, “bibliometrics have considerable potential as a research area for health-care scientists and practitioners that can be used to discover new information about academic trends, pharmacotherapy, disease, and other health sciences trends”29.
Some authors consider that “bibliometrics are to scientific papers as epidemiology is to patients”29. Bibliometric studies are relevant to clinical practice as they may be complementary for the elaboration of Clinical Practice Guidelines, as occur with the “IWGDF Guide for prevention and management of diabetic foot disease.”
Our results show that articles about diagnosis are among the most represented categories while treatment, prevention, and prognosis are relatively underrepresented. This suggests that the urgency of an accurate diagnosis is causing that other important issues become less studied, which influence the clinical practice. Furthermore, this study shows that some clinical guidelines and consensuses are available from the beginning of the pandemic.
Approximately one-third of bibliometric studies analyze medical topics and they are growing at a higher rate than all publications in medicine30. Thus, it is worth highlighting that every physician and researcher should have a basic knowledge of bibliometric analysis, to distinguish the articles that have had success, impact, or editorial relevance. This is the dissociation between “editorial success” and “scientific success.” This highlights the importance that any physician can judge a new topic in which he/she is interested or generates too much information, especially when the knowledge involves a universe of information, as is the case with COVID-19.
Tenth, this emerging effort is also reflected in a great number of researchers (more than 10,000) working together in large groups (158 authors in the largest cluster), some authors achieving at least 10 publications per month. Our coauthorship network suggests a high level of collaboration between several groups of researchers.
The truth is that to date, despite thousands of publications, the solution to many problems seems far away. We hope that our work provides a support for further bibliometric analyses of COVID-19 articles and that our publication catalog will serve like Theseus's string to help retrace our way through the labyrinth of information, thus preventing the “Corona-Minotaur” from swallowing a few scientists in this elaborate maze-like construction of new knowledge.
Limitations
Our study has several limitations, but can stand as a framework for future research.
We only used the PubMed database; gray literature has been ignored. However, in many places, medical practitioners do have not access to subscription-based repositories (EMBASE and Web of Science) and even universities cannot afford them. Therefore, PubMed stands as the main free-of-charge source of evidence for many physicians in most countries.
Many preprint studies lack clear categories as they explain some basic aspects of COVID-19 and then jump, for example, to treatment. With further advances in knowledge of COVID-19, research will become more finely focused but the “panoramic drone vision” offered by bibliometrics will provide insights and vistas of the pandemic often missed or even imagined in the coming months, with a more powerful zoom and will provide more details in the next few months.
Conclusion
The core of research papers and citations follows the Matthew effect, but the virus does not. Stakeholders of research might adopt measures to foster publication in countries which have been strongly affected in the second quarter but play a modest role in the first 3 months. Publication of local experience in terms of COVID-19 testing, lockdown measures, and the overcrowding of health services in countries with limited resources is urgently lacking. In our countries, doctors are often too busy with patient care responsibilities and publication is not a priority. However, the frustration of being rejected by major journals does not encourage the few of us who wish to publish to raise our hand and share our experience.
As publications on COVID-19 are expected to explode exponentially, we hope that the medical community can use bibliometric tools to avoid being drowned by the tsunami of information and that scientific surfers begin paddling toward the wave to pick up speed as this trend will likely be further accelerating.
The only way the scientific community can avoid getting lost in this ocean of new information generated every hour is to use this Google Maps of research to set the rhythm for exploring what can be useful and what is only redundant.

