


 nueva página del texto (beta)
 Inglés (pdf)
 Artículo en XML
 Referencias del artículo
 Enviar artículo por email
 Citado por SciELO
  Similares en
SciELO
Similares en
SciELO 
 Permalink
Introduction
Risk prediction is a typical supervised statistical learning problem since its goal is to predict the value of an outcome based on a number of input measurements. For instance, the Global Registry of Acute Coronary Events (GRACE) score is a well-known model used to predict the probability of dying after an acute coronary syndrome1. For this score, multiple validation studies have reported c-statistic values between 0.73 and 0.88 for short-term outcomes2-5. Like most risk scores, the GRACE model was developed using a logistic regression approach that can only model linear functions. This methodological limitation prevents finding potential non-linear relationships among variables, which could eventually improve score performance. Conversely, artificial neural networks (NN) are statistical learning methods that have been recognized as useful tools for non-linear statistical modeling. The central idea of a NN algorithm is to extract linear input combinations as derived features and then model the target as a non-linear function of these features. In short, while a multiple logistic regression analysis forces all the variables to adapt themselves to a single equation (logistic), a NN algorithm learns to fit itself to the different non-linear equations that best correlate the predictor variables. NN comprises a group of algorithms used for machine learning that model data using graphs of artificial neurons, usually functioning in a non-deterministic highly parallel manner. Based on how they work, NN have been also defined as MIMD machines (Multiple Instructions, Multiple Data) rather than mathematical/statistical methods.
Initial selection of candidate input variables in a NN algorithm has been traditionally based on two methods: an unguided process where all variables of the database are massively included without previous choice criteria and a guided method where some type of prior individualization is used to select NN input variables. For instance, early research comparing NN algorithms with logistic regression to predict in-hospital mortality after coronary angioplasty found that guiding initial NN variable selection with the classical univariate analysis improved the algorithm predictive accuracy with respect to the unguided initial selection method6. Somehow, subsequent investigations have also supported this observation about the advantages of the guided training method7.
Based on this framework, we hypothesized that treating the same individual predictors included in the GRACE score with NN algorithms instead of using the traditional logistic regression equation or unguided modeling could improve score performance. Hence, the aim of this study was to develop, train, and test different NN algorithm-based models to improve the GRACE score performance to predict in-hospital mortality after acute coronary syndrome.
Material and methods
We analyzed a prospective clinical database, including 1255 patients admitted with diagnosis of acute coronary syndrome in a community hospital of Buenos Aires between June 2008 and June 2017. The entire database included 40 demographic and laboratory admission variables. In the guided approach, only the individual predictors included in the GRACE score were used to train and test three NN algorithm-based models, namely: one- and two-hidden layer multilayer perceptron (MLP) and a radial basis function network. Independent risk factors at hospital admission included in the models were: age, Killip class, systolic blood pressure, ST-segment deviation, cardiac arrest during presentation, serum creatinine level, positive initial cardiac enzymes, and heart rate, all included in the GRACE score. The endpoint was in-hospital all-cause mortality. In addition, three extra unguided models were built using the 40 admission variables of the entire database. Finally, expected mortality, according to the GRACE score, was calculated using the logistic regression equation described in the literature2.
For modeling purposes, the database was randomly split into 2 datasets: 70% for model training and 30% for validation. For samples below 10 K, the recommended split is 70/30 or 80/20 (Paretos ratio) to achieve better training and minimize model over- and under-fitting. A NN algorithm is a special type of non-linear regression that presents multiple local minimum values; hence, every time the training algorithm runs, it will converge in a different model. To choose the best model, the training process was repeated 50 times. Every time the models were tested on the validation cohort, accuracy, receiver operating characteristic (ROC) area, negative predictive value (NPV), and positive predictive value (PPV) were recorded. Only models showing the best discrimination power were selected for comparison with logistic regression outcomes.
All MLP-based prediction models were implemented with a standardized rescaling method for covariates in the input layer, hyperbolic tangent activation functions (f(x) = 2/1 [ + exp(−2x)] −1) in hidden layers, a softmax activation function (fj(x) = expxj/∑Pi = 1expxi) in the output layer, and a cross-entropy error function. The radial basis function network model was implemented with a standardized rescaling method for covariates in the input layer, a softmax activation function in the hidden layer, an identity activation function (f(x) = x) in the output layer, and a sum of squares error function. The logistic regression equation used to calculate GRACE score predictions was1: log(∏/(1−∏))= −7.7035 + 0.0531 age + 0.0531 heart rate−0.0168 blood pressure + 0.1823 creatinine + 0.6931 Killip class + 1.4586 cardiac arrest + 0.4700 enzymes + 0.8755 ST-segment.
Statistical analysis
Categorical data were expressed as absolute frequencies and percentages, and continuous variables as mean and standard deviation. The KolmogorovSmirnov goodness-of-fit test was used to analyze normal distributions. Statistical comparison of ROC areas with their 95% confidence interval was done with the HanleyMcNeil test, while accuracies, NPV and PPV were compared with the Z-test for standard error of the difference between proportions. To assess the association between observed and predicted values, phi coefficient, Kendalls tau-b, and Cohens kappa statistic were calculated. Statistical analysis and NN modeling were performed with IBM SPSS 23.0 Statistics (IBM Corporation, Armonk, NY). A 2-tailed p ≤ 0.05 was considered statistically significant. The study was approved by the local institutional review board, which waived the need for informed consent due to the observational nature of the study.
Results
Baseline characteristics of the study population used for model training and validation are shown in table 1. Table 2 summarizes the performance of in-hospital mortality prediction models for patients with the acute coronary syndrome, based on individual predictors of the GRACE score and on 40 unselected admission variables (unguided models). In terms of accuracy, ROC area, and NPV, almost all NN algorithms outperformed the logistic regression approach. Only radial basis function models obtained a better accuracy level based on NPV improvement, at the expense of PPV reduction. Compared with the logistic regression approach, one- and two-hidden layers in guided and unguided MLP models improved PPV from 13.2% to 18.2% (38% increase), 15.4% (17% increase), 27.3% (107% increase), and 25.0% (89% increase), respectively, although these differences were not statistically significant.
Table 1 Baseline characteristics of the study population, including the 40 variables used in unguided models (n = 1255)
| Variable | n (%) |
|---|---|
| Age in years (mean ± SD) | 66 ± 12.3 |
| Male sex | 628 (50.0) |
| Weight in kg (mean ± SD) | 78 ± 14.1 |
| Height in cm (mean ± SD) | 170 ± 9.0 |
| Hypertension | 825 (65.7) |
| Diabetes | 235 (18.7) |
| Dyslipidemia | 687 (54.7) |
| Smoking | 458 (36.5) |
| Chronic angina | 59 (4.7) |
| Previous myocardial infarction | 341 (27.2) |
| Previous CABG surgery | 86 (6.9) |
| Previous PTCA | 231 (18.4) |
| Chronic renal failure | 66 (5.3) |
| Stroke | 52 (4.1) |
| Chronic pulmonary disease | 59 (4.7) |
| Peripheral arteriopathy | 22 (1.8) |
| Beta-blocker treatment | 501 (39.9) |
| Calcium blocker treatment | 142 (11.3) |
| ACE inhibitor treatment | 500 (39.8) |
| Acetylsalicylic acid treatment | 503 (40.1) |
| Oral hypoglycemic treatment | 160 (12.7) |
| Insulin treatment | 54 (4.3) |
| Diuretic treatment | 82 (6.5) |
| ECG ST-deviation | 515 (41.0) |
| ECG T-wave inversion | 306 (24.4) |
| Right bundle branch block | 77 (6.1) |
| Left bundle branch block | 40 (3.2) |
| Pacemaker rhythm | 24 (1.9) |
| Atrial fibrillation | 44 (3.5) |
| Maximum troponin level in IU/l (mean ± SD) | 574 ± 2082.2 |
| Maximum creatine kinase level in IU/l (mean ± SD) | 511 ± 1077.1 |
| Creatine kinase level > 195 IU/l | 519 (41.4) |
| Maximum creatine kinase-MB level in IU/l | |
| (mean ± SD) | 58 ± 136.2 |
| Serum creatinine level in mg% (mean ± SD) | 1.02 ± 0.41 |
| Serum glycemia level in mg% (mean ± SD) | 127 ± 50.6 |
| Systolic blood pressure at admission in mmHg (mean ± SD) | 137 ± 23 |
| Heart rate at admission in beats/min (mean ± SD) | 74 ± 16 |
| Killip class 3-4 | 22 (1.8) |
| Percent ejection fraction (mean ± SD) | 60 ± 7.0 |
| Cardiac arrest at admission | 2 (0.2) |
SD: standard deviation; CABG: coronary artery bypass graft; PTCA: percutaneous transluminal coronary angioplasty; ACE: angiotensin-converting-enzyme inhibitor; ECG: electrocardiography.
Table 2 Performance of in-hospital mortality prediction models for patients with acute coronary syndrome, based on individual predictors of the Global Registry of Acute Coronary Events score (guided models) and on 40 unguided input variables
| Accuracy (CI95%) | ROC area (CI95%) | NPV (CI95%) | PPV (CI95%) | |
|---|---|---|---|---|
| Logistic regression | 94.1% (92.8-95.4%) | 0.753 (0.641-0.864) | 98.8% (98.2-99.5) | 13.2% (0.1-18.7) |
| Guided models (8 selected variables) | ||||
| One-hidden layer MLP | 97.1% (96.2-98.0%) p < 0.0001 | 0.890 (0.873-0.907) p = 0.003 | 99.7% (99.4-100%) p = 0.022 | 18.2% (16.1-41.0%) p = 0.340 |
| Two-hidden layer MLP | 96.7% (94.9-98.5%) p < 0.0001 | 0.858 (0.839-0.877) p = 0.020 | 99.7% (99.2-100%) p = 0.019 | 15.4% (0.0-35.0%) p = 0.418 |
| Radial basis function network | 96.1% (94.1-98.1%) p < 0.0001 | 0.841 (0.821-0.861) p = 0.043 | 100% (100-100%) p = 0.0001 | 0.0% (0.0-0.0%) p < 0.0001 |
| Unguided models (40 unselected variables) | ||||
| One-hidden layer MLP | 96.2% (94.2-98.2%) p < 0.0001 | 0.839 (0.819-0.859) p = 0.047 | 98.5% (97.2-99.8%) p = 0.674 | 27.3% (1.0-53.6%) p = 0.153 |
| Two-hidden layer MLP | 97.3% (95.7-99.0%) p < 0.0001 | 0.836 (0.790-0.882) p = 0.053 | 99.7% (99.2-100%) p = 0.018 | 25.0% (0.5-49.5%) p = 0.179 |
| Radial basis function network | 96.9% (95.0-98.7%) p < 0.0001 | 0.830 (0.809-0.851) p = 0.067 | 100% (100-100%) p = 0.0001 | 0.0% (0.0-0.0%) p < 0.0001 |
CI 95%, 95%: confidence interval; ROC: receiver operating characteristic; MLP: multilayer perceptron, NN: neural network; NPV: negative predictive value; PPV: positive predictive value. All p-values correspond to comparisons between each algorithm and the logistic regression model.
Statistical measures of association between expected and observed values as predicted by guided and unguided algorithms and the logistic regression model are shown in table 3.
Table 3 Statistical measures of association between expected and observed values as predicted by one- and two-hidden layer guided and unguided multilayer perceptron (MLP), and the logistic regression model
| phi coefficient | Kendalls tau-b | Cohens kappa | |
|---|---|---|---|
| Guided one-hidden layer MLP | 0.34 (0.05-0.51) | 0.94 (0.92-0.96) | 0.28 (0.04-0.41) |
| Guided two-hidden layer MLP | 0.31 (0.05-0.47) | 0.93 (0.90-0.96) | 0.24 (0.04-0.36) |
| Unguided one-hidden layer MLP | 0.30 (0.07-0.60) | 0.92 (0.89-0.95) | 0.30 (0.06-0.59) |
| Unguided two-hidden layer MLP | 0.42 (0.12-0.56) | 0.95 (0.92-0.98) | 0.37 (0.10-0.49) |
| Logistic regression | 0.25 (0.16-0.32) | 0.77 (0.75-0.79) | 0.18 (0.12-0.24) |
All p < 0.001.
Results confirmed a higher level of agreement with the observed values when using NN algorithms than with the logistic regression model.
The independent normalized importance of variables in the best guided NN model (one-hidden layer MLP) is shown in figure 1. For this algorithm, the most influential factors in descending order that scored ≥ 50% for normalized importance were cardiac arrest, age, heart rate, Killip class, and blood pressure.
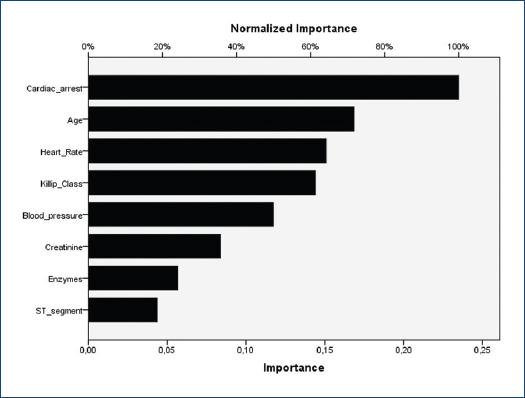
Figure 1 Normalized importance of the variables in the guided one-hidden layer multilayer perceptron, including the eight individual predictors described for the original Global Registry of Acute Coronary Events score.
The independent normalized importance of variables for the best unguided NN algorithm (one-hidden layer MLP) was: serum creatinine level 100%, Killip class 61%, ejection fraction 52%, age 44%, maximum creatine kinase level 41%, glycemia 40%, left bundle branch block 35%, and weight 33%, among the top 8 predictors. Only 3 of these top 8 predictors agreed with GRACE score variables.
Discussion
Using individual predictors of the GRACE score as input variables, all NN algorithms tested in the current study showed better overall accuracy and discrimination power than the logistic regression approach to predict risk of death after an acute coronary syndrome. These algorithms were able to accurately model in-hospital mortality when guiding variable selection was used. In this case, the eight individual predictors identified by the GRACE score were used as guiding input variables in every algorithm. Both MLP-based guided algorithms displayed a better performance than the logistic regression solution in PPV terms, although the statistical difference was only marginal.
Regarding 40-variable NN algorithm performances, although ROC areas were systematically better in guided algorithms, both MLP unguided models outperformed guided MLP and logistic regression models in terms of PPV, though the difference was not statistically significant.
Early research found no advantage of unguided NN algorithms over logistic regression and Bayesian classification for risk stratification following myocardial infarction8,9. Recently, Myers et al.10 developed a parallel model using a logistic regression analysis for clinical features and a recurrent NN to assess time series of subtle electrocardiography ST-segment deviation in patients initially admitted with a non-ST-segment elevation acute coronary syndrome. Discrimination of the combined logistic regression-NN model showed a c-statistic of 0.74 that outperformed other isolated models and the thrombolysis in myocardial infarction (TIMI) risk score. NN models were also used to improve risk stratification and prediction of stress myocardial perfusion imaging and angiographic results in patients with suspected acute coronary syndromes11. Compared with the TIMI score, NN models provided improved discriminatory power; and in relation to myocardial perfusion imaging, NN algorithms could reduce testing by 59% and maintain a 96% NPV for ruling out ischemia. Conversely, PPV for foretelling ischemia was scarcely between 7% and 15%. In another recent research, a hybrid NN-genetic algorithm model was confronted with a logistic regression approach to predict the occurrence of heart block and death following myocardial infarction12. Although the hybrid algorithm outperformed logistic regression, the authors only reported overall accuracy without NPV or PPV.
The patient risk for adverse medical outcomes after an acute coronary syndrome has been also assessed using machine learning, an NN-related method. In the study of Liu et al.13, learning machine algorithms obtained at most a c-statistic of 0.77 when measuring heart rate variability to predict outcomes. Mansoor et al.7 found that the application of random forest algorithms, a machine learning method, did not outperform logistic regression in predicting in-hospital mortality in women with ST-segment elevation myocardial infarction. In the validation cohort, the c-statistic was 0.84, 0.81, and 0.80 for the multivariate logistic regression, the 32-variable, and the 17-variable-based random forest models, respectively. In the reduced random forest model containing 17 variables, selection was based on individual variable importance. It is worth noting that in the current study, 5 out of the 8 GRACE-guided input variables scored at least 50% for normalized importance in the one-hidden layer MLP model, while in the unguided one-hidden layer MLP, only 3 top predictors of the 40 input variables corresponded to the GRACE score original variables.
Machine learning algorithms were also trained on nationwide Swedish population data to solve the binary classification problem of predicting survival versus non-survival after the first myocardial infarction14. A Support Vector Machine with a radial basis kernel developed on 39 predictors had the highest performance (c-statistic = 0.84, NPV = 0.97, and PPV = 0.28), but not significantly higher than logistic regression or random forest algorithms.
In general, the medical literature on this research area has shown that, although most models performed accurately, recurrently, high NPV and low PPV in risk stratification modeling based on NN or other machine learning algorithms seemed to be a constant for every study. This phenomenon has been observed even outside the area of cardiology15.
Improved in-hospital and discharge mortality prediction after myocardial infarction is important for identifying high-risk individuals eligible for intensified treatment and care. However, individuals at risk are better selected by accurate scores displaying higher PPV rather than stronger NPV. For medical conditions exhibiting low incidence of adverse events, as death after myocardial infarction or coronary revascularization, overall accuracy of a risk prediction score can be exaggerated by high NPV, despite poor PPV. Consequently, future improved models should be based on a more balanced relationship between these predictive values. Taking into account the importance of PPV in risk stratification, in the current study, the simplest NN algorithm based on GRACE input variables was able to slightly improve logistic regression performance. To achieve higher PPV, it was necessary to implement NN models, including up to 40 unguided variables. However, the problem with the unguided approach is that outcomes depend on the type of variables used as input in the training set. Furthermore, although an analysis of the independent importance of variables can be used to detect the most influencing predictors, this selection could be different on each iteration of the training model.
A large number of data items are routinely collected automatically in many areas of medicine. When building a decision-support system, variable selection in guided models implies the previous removal of superfluous variables that, on the one hand, can lead to more accurate models, and on the other, can save money, time, and effort by dropping unnecessary laboratory or diagnostic tests, or collecting only relevant clinical data for prediction and classification purposes. Nevertheless, from the modern concept of artificial intelligence data learning, processing sets of unguided selected variables from a whole database has the advantage of letting the algorithm think and decide by itself which are the best predictors, while expected outcomes are supervised during training.
Effective implementation of current NN models could be done in software or hardware systems. For instance, the synaptic weights of the proposed architectures could be implemented with an algorithm in Python, able to automatically read datasets from patients electronic records (NN architecture and synaptic weights of the guided one-hidden layer MLP model is included in the Supplementary material) (Fig. 2).
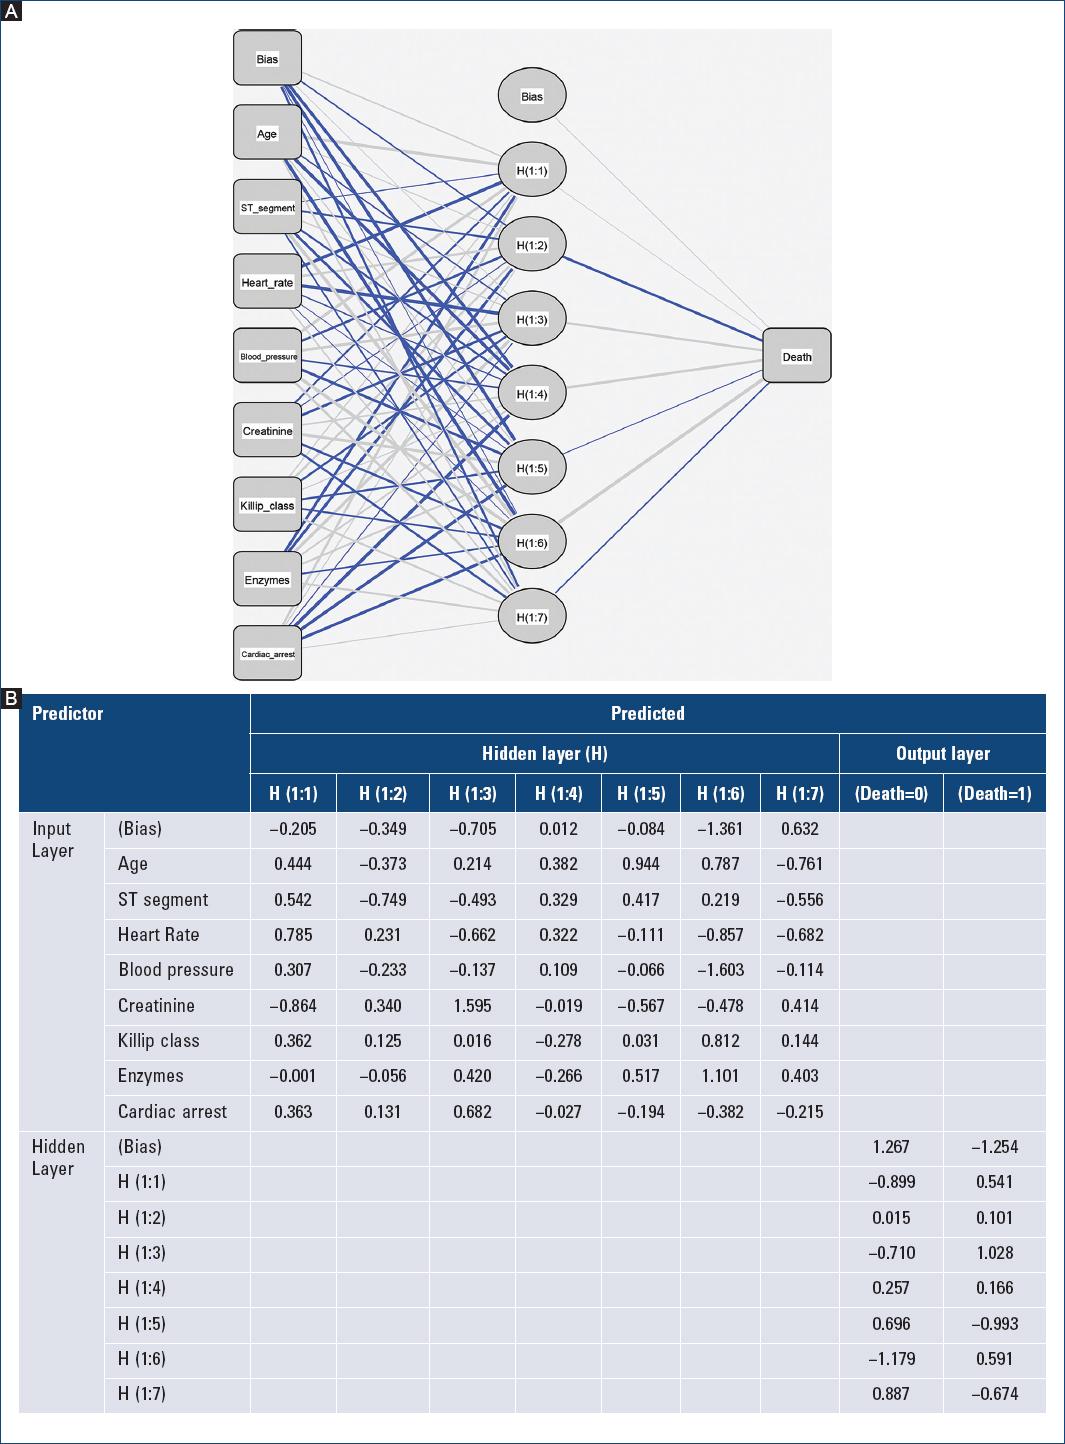
Figure 2 A: neural network architecture and B: parameter (synaptic weights) estimates used to build and test the guided one-hidden layer multilayer perceptron model to predict in-hospital mortality after an acute coronary syndrome, based on individual predictors of the Global Registry of Acute Coronary Events score.
Some limitations should be considered in the present study. First, although NN algorithms can implicitly detect complex non-linear relationships between independent and dependent variables and have the ability to solve possible interactions between predictor variables, NN are also a black box requiring greater computational resources and have limited ability to identify possible causal relationships. Second, candidate variables for the GRACE predictive model were originally selected from clinical variables extracted from previously published studies and on clinical experts opinions; then, a multiple logistic analysis was done to eliminate those factors not associated with mortality1. Consequently, it should be considered that input variables used to train current NN algorithms have been guided at least by one previous logistic regression analysis. This paradox could generate some bias when comparing performances between NN methods and logistic regression. One reason for improving risk prediction models is score simplification; however, since some of the current proposed models include even more variables than the original GRACE score, this condition could be seen as a disadvantage. However, better score performances are difficult to achieve, using less predictive variables. Ideally, risk prediction could be automatically calculated with an NN-based system by directly accessing data from patients electronic records.
Conclusion
In conclusion, this study explored NN algorithms to predict in-hospital mortality following acute coronary syndrome. Treatment of individual predictors of the GRACE score with NN algorithms improved accuracy and discrimination power in all models with respect to the traditional logistic regression approach; nevertheless, PPV was only marginally enhanced. Only unguided variable selection would be able to achieve better results in PPV terms. In short, current findings demonstrated that NN-based models with a guided or unguided previous selection of potential predictors offered alternative medical modeling to the traditional logistic regression approach of the GRACE score.

