


Services on Demand
Journal
Article
 text in
  English (pdf)
 Article in xml format
 Article references
 Send this article by e-mail
Indicators
-
 Cited by SciELO
 -
 Access statistics
Related links
-
 Similars in
SciELO
Similars in
SciELO
Share

 Permalink
Archivos de cardiología de México
On-line version ISSN 1665-1731Print version ISSN 1405-9940
Arch. Cardiol. Méx. vol.89 n.1 Ciudad de México Jan./Mar. 2019 Epub Oct 15, 2019
https://doi.org/10.24875/acm.m19000014
BASIC INVESTIGATION
Characteristics of mortality due to ischemic heart disease in Costa Rica from 1970 to 2014
1Unidad de Investigación e Innovación en Ciencias de la Salud, Costa Rica
2Departamento de Estadística, Unidad de Investigación e Innovación en Ciencias de la Salud, Universidad Hispanoamericana de San José, Costa Rica
Objective:
To update some important aspects of the descriptive epidemiology of ischemic heart (EIC) disease in Costa Rica during the period 1970-2014.
Methods:
EIC death rates were obtained in two periods: from 1930 to 1969 and then, for a more specific analysis, from 1970 to 2014, using moving and five-year averages, based on data from the Instituto Nacional de Estadística and the Centro Centroamericano de Población, to analyze them according to age, sex, geographical location and percentage contribution to the general mortality. Information was also obtained to determine the burden of the disease, in this case through Years of Adjusted Life for Disability, Years of Life Lost and Years of Life lost due to Disability.
Results:
There was a rise in rates in the general population, with greater momentum in the population from 35 to 74 years, up to the five-year period 1995-1999, after which a decline began that apparently stopped during the five-year period 2010-2014 (both sexes: r = 0.9964, r2 = 0.9928, β = -2.4950, p 0.04; men: r = 0.9994, r2 = 0.9988, β = -2.770, p = 0.02; women: r = 0.9896, r2 = 0.9793, β = -2.4950, p = 0.07). The highest rates occur in the provinces of the center of the country. It predominates during the whole period in the male sex and represents on average 14% of the general mortality.
Conclusions:
Mortality due to EIC is in a phase of decline but the increase in obesity and overweight in the country threatens to slow down this trend, at least during the last five years.
Key words Mortality; Ischemic heart disease; Descriptive studies; Descriptive epidemiology; Costa Rica
Objetivo:
Actualizar algunos aspectos importantes de la epidemiología descriptiva de la enfermedad isquémica del corazón (EIC) en Costa Rica durante el periodo 1970-2014.
Métodos:
Se obtuvieron las tasas de mortalidad por EIC en dos periodos. De 1930 al año 1969 y luego, para un análisis más específico, de 1970 al 2014, utilizando promedios móviles y quinquenios, a partir de datos del Instituto Nacional de Estadística y del Centro Centroamericano de Población, para analizarlos en relación con edad, sexo, ubicación geográfica y aporte porcentual a la mortalidad general. También se obtuvo información para determinar la carga de la enfermedad, en este caso mediante años de vida ajustados por discapacidad, años de vida perdidos y años de vida perdidos por discapacidad.
Resultados:
Se apreció ascenso de las tasas en la población general y con mayor empuje en la población de 35 a 74 años, hasta el quinquenio 1995-1999, a partir del cual se inicia un descenso que aparentemente se detiene durante el quinquenio 2010-2014 (ambos sexos: r = 0.9964, r2 = 0.9928, β = —2.4950, p = 0.04; hombres: r = 0.9994, r2 = 0.9988, β = —2.770, p = 0.02; mujeres: r = 0.9896, r2 = 0.9793, β = —2.4950, p = 0.07). Las tasas más altas se presentan en las provincias del centro del país. Predomina durante todo el periodo en el sexo masculino y representa en promedio el 14% de la mortalidad general.
Conclusión:
La mortalidad por EIC está en fase de disminución, pero el aumento de la obesidad y el sobrepeso en el país amenaza con frenar dicha tendencia, al menos durante el último quinquenio.
Palabras claves Mortalidad; Enfermedad isquémica del corazón; Estudios descriptivos; Epidemiología descriptiva; Costa Rica
Introduction
Diseases of the circulatory system (cardiovascular diseases [CVD]), understanding as such the fatal events included in the 10th International Classification of Diseases under codes I00-I99, Q20 and Q28 when the latter two are available, have been known for several decades to be the worlds leading cause of death and, among them, ischemic heart disease (IHD) is ranked at first place, even in the poorest countries on earth. In 2013, there were 17.3 million deaths from CVD, which accounts for 31% of all deaths in the world and approximately 50% of total chronic non-communicable diseases. By 2030, it is estimated that the number of deaths for these causes will amount to 23.6 million1. However, the rates are fortunately decreasing. Thus, for example, the rate in 2005 was 338.1 per 100,000, but in 2015 it dropped to 285.5 per 100,000, which meant a decrease of 15.6%2.
In the year 2010, CVDs caused the loss of 293 million disability-adjusted life years (DALYs) in the world3. Globally, CVDs were the first cause of years of life lost (YLLs)4.
To avoid confusion, CVDs and circulatory system diseases will henceforth be considered as synonyms.
Worldwide, there are large differences in circulatory system disease standardized mortality rates. Several countries have rates for males that are higher than one thousand per one hundred thousand population, like Russia (1,087.9), Ukraine (2,012.0) and Belarus (1,178.0), followed with slightly lower rates by Bulgaria (783.3), Romania (594.6) and Hungary (499.7). In general, the highest rates in Europe correspond to eastern countries formerly under communist regimes1.
In the USA, since 1900 (with exception of 1918, year of the great influenza pandemic), CVDs have caused more deaths than any other important mortality cause. In the year 2013, CVDs were the cause of 30.8% of total deaths, which equals to about one in every three deaths; on average, every 40 seconds an American dies from CVD. It has been estimated that if all main CVD causes were eliminated, life expectancy could increase by seven years1.
IHD is the leading cause of death among all CVDs and its standardized rate has been decreasing in almost every region of the world in the last quinquennia, but their disease global burden has increased by 29%, mainly due to population growth and to the phenomenon of an increasingly larger longer-lived population. In nearly all developed countries, the reduction exceeds 50% since 1990; in Denmark, the Netherlands, Norway and Israel it even reached 70%5. In the Americas, CVDs have similarly been occupying the leading positions of mortality already since several decades ago, with IHD standing out at first place. Table 1 shows the IHD rates in relation to gender, for a relatively recent date6.
Table 1 Mortality rates from ischemic heart diseases in America for the year 2015. Rates per 100,000 population
| Regions and countries | Total | Men | Women |
|---|---|---|---|
| The Americas | 63.1 | 82.8 | 46.6 |
| North America | 61.6 | 83.1 | 43.3 |
| Bermuda | 54.9 | 66.0 | 44.3 |
| Canada | |||
| USA | 61.6 | 83.1 | 43.3 |
| Latin America and the Caribbean | 63.7 | 82.4 | 48.2 |
| Latin America | 63.8 | 82.5 | 48.3 |
| Mexico | 74.9 | 94.0 | 58.3 |
| Central American Isthmus | 63.7 | 75.2 | 54.0 |
| Belize | 55.5 | 81.7 | 30.4 |
| Costa Rica | 57.6 | 75.5 | 41.6 |
| El Salvador | 55.8 | 64.4 | 48.9 |
| Guatemala | 65.7 | 77.3 | 56.1 |
| Honduras | 48.2 | 51.2 | 44.9 |
| Nicaragua | 95.5 | 111.4 | 82.5 |
| Panama | 59.1 | 75.4 | 44.2 |
| Latin Caribbean | 88.9 | 106.0 | 73.4 |
| Cuba | 80.7 | 95.5 | 66.9 |
| Guadeloupe | 11.9 | 14.7 | 9.5 |
| French Guiana | 8.8 | 9.3 | 7.6 |
| Haiti | |||
| Martinique | 10.5 | 16.1 | 6.2 |
| Puerto Rico | 49.0 | 67.8 | 34.8 |
| Dominican Republic | 119.9 | 139.3 | 101.4 |
| Andean area | 77.7 | 100.0 | 59.0 |
| Bolivia | |||
| Colombia | 102.6 | 126.3 | 83.2 |
| Ecuador | 46.5 | 61.3 | 33.1 |
| Peru | 29.1 | 38.2 | 21.1 |
| Venezuela | 104.3 | 142.8 | 72.6 |
| Brazil | 54.4 | 72.7 | 39.6 |
| Southern cone | 37.6 | 54.8 | 24.1 |
| Argentina | 34.7 | 52.3 | 21.4 |
| Chile | 33.7 | 49.4 | 21.0 |
| Paraguay | 67.5 | 83.9 | 52.0 |
| Uruguay | 36.4 | 55.4 | 23.1 |
Adapted from Pan American Health Organization, 20166.
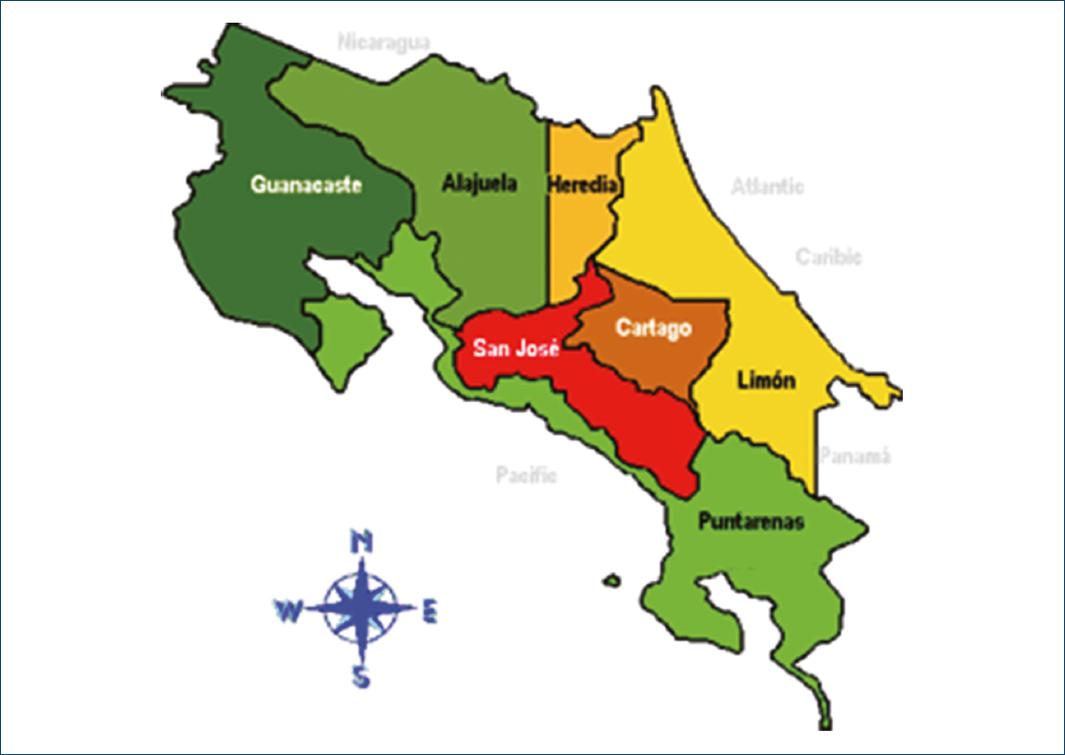
Costa Rica is a small country, since it has a territorial extension of 51,100 km2 and a population of five million inhabitants (October 2018). As it can be appreciated in the map (Fig. 1), it is divided into seven provinces; on the north it borders with Nicaragua and on the south with Panama. In Costa Rica, as in practically all over the world, chronic non-communicable diseases have been the main causes of death in the country for several decades, to the point of accounting for 79% of all of them7. Something similar occurs all over the world, since said conditions were the cause of 72.3% of all deaths in 2016 (95% confidence interval [CI]: 71.2-73.2)8. Within this large group, CVDs have become the leading cause of death since several decades ago. In the year 2015, CVDs caused 5,689 deaths in Costa Rica, with a rate of 98.07 per 100,000 population. Among all of them, IHD has always been ranked at first place and, as specific cause, myocardial infarction appears first, while the second cause of CVD-related death are cerebrovascular diseases. IHD was the cause of 2,690 deaths, with a rate of 47.93 per 100,000, which is equivalent to 47.3% of the group. Meanwhile, acute myocardial infarction (AMI), which is the main cause of death within the IHD segment, caused 1,383 deaths, with a rate of 28.6 per 100,000, equivalent to 51.2% of deaths within said segment, always for the same year 20159.
In Costa Rica, few works have been published on IHD descriptive epidemiology. Roselló and Guzman10 analyzed mortality during the 1970-2002 period according to its geographical distribution and place of occurrence. Subsequently, these two researchers published another article on the same subject, in this case with greater extension and depth, since they also included CVD, IHD and AMI mortality evolution during the 1970-2001 period11.
Hence the importance of updating and expanding the existing information in this regard, which is the main purpose of our collaboration.
The objective of this work is to describe and update some aspects of IHD descriptive epidemiology, especially its mortality, during the years encompassed between 1970 and 2014.
Methods
Initially, IHD mortality figures for all ages in Costa Rica from 1930 to 1969 were obtained from the statistics yearbooks of the National Institute of Statistics (INEC -Instituto Nacional de Estadística de Costa Rica)12, and subsequently, from the Central American Population Center (CCP - Centro Centroamericano de Población) database of the University of Costa Rica from 1970 to 201413. From those same sources, total population of the country for the same years of the studied period was obtained, in order to calculate the crude rates smoothed by three-year moving averages and also for five-year periods (quinquennia). Moving averages are used in this sense14,15, with three years being chosen each time for this purpose: first, the first three rates are added and divided by three, with the rate being placed in front of the intermediate year of that first triennium, then, the successive total values will be obtained by excluding the first year of the triennium from the preceding total value and adding the next year until the series is completed.
Subsequently, total deaths from said causes (ICD 10, I20 - I25) were obtained, classified by gender, of the population aged 35 to 74 years for the period between January 1, 1970 and December 31, 2014. With the population of that age group, the respective standardized rates were calculated, given that this is the age group with the highest risk for dying from such diseases, as well as to enable international comparisons. The Latin American population was taken as the standard population.
To assess IHD mortality rates secular trends or changes, percentage changes thereof were used in the first term and, in second place, regression techniques, with correlation or determination coefficients (r2), beta estimation and, finally, the degree of significance (p) being obtained in order to determine if the changes were statistically significant or not.
Crude and typified mortality rates were also calculated per hundred thousand population by Costa Rica provinces and regions. Standardization was also made using 2015 Latin America population age distribution (Latin American and Caribbean Demographic Center [CELADE - Centro Laatinoamericano y Caribeño de Demografía])16. We have used this population standard in other works, since it allows the best comparison of rates versus those in the other Latin American countries.
In order to obtain the IHD-related mortality figures, we used the 8th International Classification of Diseases (ICD), specifically the 410 codes, for the years 1970-79, ICD-9 410 codes for the 1980-1996 period and ICD-10 I21 codes for the period between 1997 and 2014. The latter distinguishes the following entities:
-
- Ischemic heart diseases (I20 to I25)
I20 Angina pectoris.
I21 ST elevation (STEMI) and non-ST elevation (NSTEMI) acute myocardial infarction.
I22 subsequent ST elevation (STEMI) and non-ST elevation (NSTEMI) acute myocardial infarction.
I23 Certain current complications, following ST elevation (STEMI) and non-ST elevation (NSTEMI) myocardial infarction (within the 28-day period).
I24 Other acute ischemic heart diseases.
I25 Chronic ischemic heart disease.
Regarding the change of codes from ICD-9 to ICD-10 we verified that the rates practically did not vary between 1990 and 1999, which was the decade in the middle of which the change between both classifications occurred. On the other hand, the percentage contribution of IHD mortality to general mortality did not vary either between the immediate years before and after the ICD change (it remained between 14.41 and 14.24%). At the international level, changes occurred between the ICD-9 and ICD-10 criteria were not a cause for concern in Spain, since the figures have remained relatively stable17.
In the case of mortality prior to 1970, it was addressed with current ICD codes, just as they appeared in the INEC statistical yearbooks. For the tabulation and analysis of data, the STATA® program was used18.
To omit the problem of inappropriate classification, which has been studied by the World Health Organization19, the percentage of poorly-defined pathologies, many of which actually correspond to IHD, such as paroxysmal ventricular tachycardia, ventricular fibrillation, cardiac arrest, heart failure and not otherwise specified heart failure, among others, was determined for two specific periods: the first one from 1980 to 1999, and the second from 2000 to 2016. In the first case there was a persistent decrease in their percentage with regard to total number of heart diseases, ranging from a maximum of 27.1% in the 1980 to 10.19% in 1995. In the case of the years corresponding to ICD-10, average percentage of wrongly defined pathologies was 4.30, with extreme values of 4.94% (year 2001) and 3.13% (2008). According to these low percentages, Costa Rica is in the group of countries considered as low miscoding, and therefore it is possible to assume that these errors have not significantly affected the IHD rates.
Results
Table 2 shows IHD crude mortality rates moving averages evolution in Costa Rica from 1930 to 2014. In general terms, a continued rise is observed until 2004, after which the rates tend to stabilize until 2009. As of that year, rates rather show a moderate elevation.
Table 2 Ischemic heart disease mortality crude rates moving averages in Costa Rica, 1930-2014
| Year | Moving averages | Year | Moving averages |
|---|---|---|---|
| 1930 | 1.76 | 1973 | 37.00 |
| 1931 | 1.88 | 1974 | 38.16 |
| 1932 | 1.86 | 1975 | 37.84 |
| 1933 | 1.68 | 1976 | 35.56 |
| 1934 | 1.76 | 1977 | 36.52 |
| 1935 | 2.09 | 1978 | 39.02 |
| 1936 | 2.28 | 1979 | 42.68 |
| 1937 | 2.50 | 1980 | 44.33 |
| 1938 | 2.95 | 1981 | 46.10 |
| 1939 | 2.94 | 1982 | 48.63 |
| 1940 | 3.82 | 1983 | 51.91 |
| 1941 | 3.64 | 1984 | 55.32 |
| 1942 | 3.89 | 1985 | 55.96 |
| 1943 | 2.65 | 1986 | 55.09 |
| 1944 | 3.05 | 1987 | 53.64 |
| 1945 | 3.01 | 1988 | 54.28 |
| 1946 | 3.28 | 1989 | 55.08 |
| 1947 | 2.56 | 1990 | 54.43 |
| 1948 | 2.43 | 1991 | 53.80 |
| 1949 | 2.65 | 1992 | 55.17 |
| 1950 | 2.86 | 1993 | 56.95 |
| 1951 | 5.12 | 1994 | 58.30 |
| 1952 | 8.44 | 1995 | 58.88 |
| 1953 | 11.84 | 1996 | 57.74 |
| 1954 | 13.18 | 1997 | 56.47 |
| 1955 | 13.55 | 1998 | 56.12 |
| 1956 | 13.79 | 1999 | 57.68 |
| 1957 | 13.62 | 2000 | 59.21 |
| 1958 | 14.07 | 2001 | 58.97 |
| 1959 | 15.14 | 2002 | 57.53 |
| 1960 | 15.82 | 2003 | 55.72 |
| 1961 | 16.67 | 2004 | 55.81 |
| 1962 | 17.43 | 2005 | 54.52 |
| 1963 | 20.81 | 2006 | 54.62 |
| 1964 | 22.94 | 2007 | 54.47 |
| 1965 | 26.67 | 2008 | 54.73 |
| 1966 | 28.44 | 2009 | 54.84 |
| 1967 | 33.25 | 2010 | 56.04 |
| 1968 | 36.87 | 2011 | 56.33 |
| 1969 | 37.02 | 2012 | 56.85 |
| 1970 | 34.19 | 2013 | 57.29 |
| 1971 | 31.50 | 2014 | 60.07 |
| 1972 | 33.64 |
Own creation with data from statistical yearbooks and from Centro Centroamericano de Población.
Table 3 shows the above information, but this time taking into account the quinquennial averages and their percentage relationship with general mortality. The same trend is observed when average rates are studied by quinquennia in the same time period, but the decline until the 2004-2009 quinquennium is interrupted, since it is followed by a slight increase in the next period, similar to the behavior observed in table 2.
Table 3 Ischemic heart disease mortality crude rates in Costa Rica, 1930-2014. Quinquennial averages and percentage ratio with overall mortality
| Quinquennium | Average death no. | Average rate | Percentage change | Percentage ratio |
|---|---|---|---|---|
| 1930-1934 | 9 | 1.7 | 0.08 | |
| 1935-1939 | 15 | 2.6 | 52.92 | 0.13 |
| 1940-1944 | 21 | 3.2 | 22.86 | 0.18 |
| 1945-1949 | 21 | 2.9 | -10.40 | 0.21 |
| 1950-1954 | 79 | 8.3 | 187.32 | 0.80 |
| 1955-1959 | 157 | 14.0 | 69.27 | 1.58 |
| 1960-1964 | 257 | 18.8 | 33.96 | 2.36 |
| 1965-1969 | 537 | 33.1 | 75.73 | 4.76 |
| 1970-1974 | 645 | 34.5 | 4.43 | 6.10 |
| 1975-1979 | 808 | 38.0 | 9.92 | 8.96 |
| 1980-1984 | 1197 | 48.9 | 28.93 | 12.69 |
| 1985-1989 | 1550 | 55.4 | 13.09 | 14.46 |
| 1990-1994 | 1766 | 55.6 | 0.37 | 14.41 |
| 1995-1999 | 2067 | 57.3 | 3.12 | 14.24 |
| 2000-2004 | 2298 | 57.3 | -0.07 | 14.76 |
| 2005-2009 | 2256 | 52.0 | -9.19 | 13.27 |
| 2010-2014 | 2726 | 58.58 | -0.12 | 14.01 |
Own creation with data from statistical yearbooks and from Centro Centroamericano de Población.
IHD mortality percentage contribution with respect to overall mortality was practically insignificant during the 1930-1954 period (less than 1%), but in the time span between the 1955-1959 and 1975-1979 quinquennia, the increase is notorious, especially after 1980, when the percentage reached two digits until stabilizing at 14%.
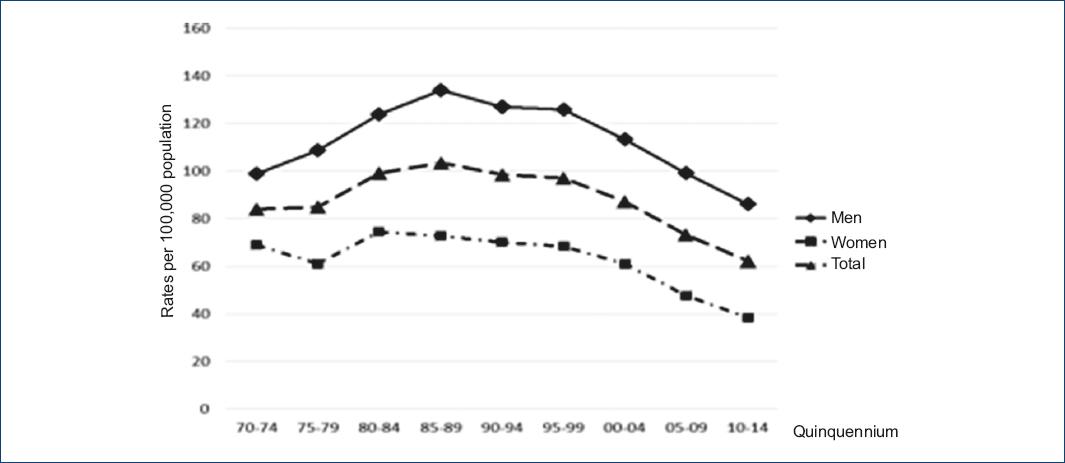
Average quinquennial rates were also analyzed adjusted for the 35 to 74-year age group between the years 1970-1974 and 2010-2014. At first sight, the rates per hundred thousand population are observed to increase until the 1995-1999 quinquennium, after which a significant and sustained decline is observed in the three subsequent quinquennia (Table 4), both in men and in women. The percentage decrease between the extreme quinquennia for women was 44.19, while for men it was 13.16. In this case, the huge decline difference in favor of women draws the attention. For both genders, the decrease corresponded to 25.88%.
Table 4 Ischemic heart disease mortality in people aged between 35 and 74 years by quinquennia in Costa Rica, 1970-2014. Adjusted rates per 100,000 population
| Quinquennium | Women | Men | Total |
|---|---|---|---|
| 1970-1974 | 68.83 | 98.93 | 83.88 |
| 1975-1979 | 61.15 | 108.55 | 84.85 |
| 1980-1984 | 74.32 | 123.88 | 99.10 |
| 1985-1989 | 72.61 | 134.07 | 103.34 |
| 1990-1994 | 69.92 | 127.02 | 98.47 |
| 1995-1999 | 68.35 | 125.67 | 97.01 |
| 2000-2004 | 61.05 | 113.18 | 87.12 |
| 2005-2009 | 47.72 | 98.97 | 73.35 |
| 2010-2014 | 38.41 | 85.91 | 62.17 |
Own creation with data from statistical yearbooks and from Centro Centroamericano de Población.
When this analysis is carried out according to gender (Tables 4 and 5, Fig. 2), when the series is divided in two periods (1970-1999 and 2000-2014), no decrease in the rates is observed to have occurred during the first period (except in males, p = 0.05) and there was rather an increase in women and in total rate, but the opposite occurred during the 2000-2014 period, given that, for males, a significant trend towards a decrease is observed (r = 0.994, r2 = 0.9884, β = -2.7270, p = 0.02) and the same occurred when both genders were taken into account (r = 0.9964, r2 = 0.9928, β = -2.4950, p = 0.04). For women, the rates also decreased, but the trend was not significant by a slight margin (p = 0.07).
Table 5 Regression (r) and determination coefficient (r2), b coefficient and significance (p) for coronary ischemic heart disease mortality adjusted rates in people aged from 35 to 74 years, according to gender. Costa Rica 1970-2014
| Gender and total | r | r2 | b | p |
|---|---|---|---|---|
| 1970-1999 | ||||
| Men | 0.6530 | 0.4264 | 1.1389 | 0.05 |
| Women | 0.0677 | 0.0046 | 0.1269 | 0.62 |
| Total | 0.5354 | 0.2867 | 0.6329 | 0.10 |
| 2000-2014 | ||||
| Men | 0.9994 | 0.9988 | -2.7270 | 0.02 |
| Women | 0.9896 | 0.9793 | -2.2640 | 0.07 |
| Total | 0.9964 | 0.9928 | -2.4950 | 0.04 |
Other indicators of disease burden
In addition, other indicators were obtained, in this case extracted from the Institute for Health Metrics and Evaluation (IHME) of the University of Washington, Seattle20, in order to complement the burden of the disease by IHD in Costa Rica. In the first place, Disability-Adjusted Life Years during the 1990-2014 period, as shown in figure 3. A continuous decline is observed until 2009, and then the trend stabilizes. Quantitatively, DALYs between the years 1990 and 2014 decreased from 2,505 (95% CI: 2,378.99-2,642.33) to 1,319.57 (95% CI: 1,233.86-1,421.17), for a percentage decline of 47.3%.
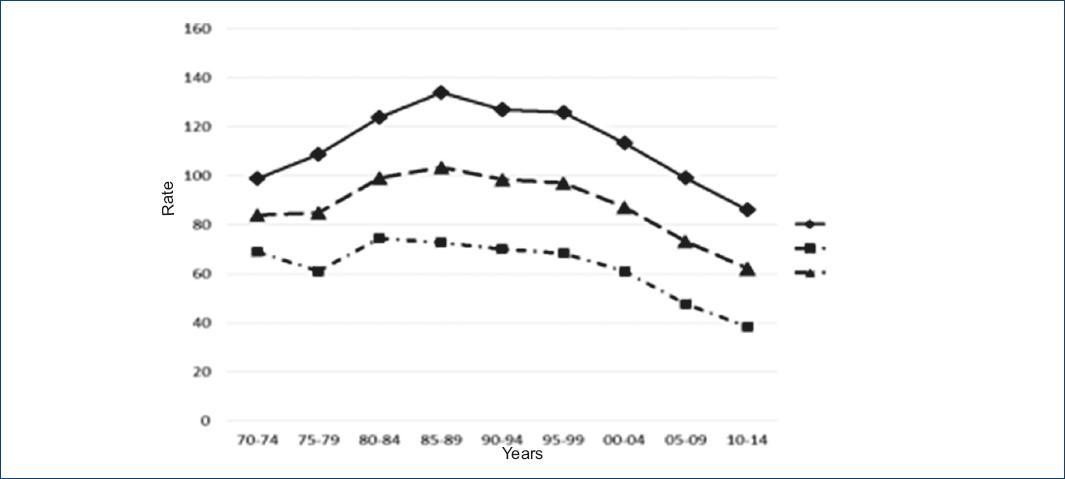
Figure 3 Disability-adjusted life years lost due to ischemic heart disease in Costa Rica, 1990-2014 period. Rates per 100,000 population (created based on data from the Institute for Health Metrics and Evaluation20).
Figure 4 shows the years of potential life lost (YPLL) evolution, also for the same 1990-2014 period, with a decrease during this period being observed, just as in the previous figure, as well as a stabilization of rates in the last five years. During the first of the aforementioned years, a figure of 2,401 per one hundred thousand population was obtained (95% CI: 2,286.98-1,533.93), which decreased to 1,214.93 (95% CI: 1,129.17-1,311.83), for a percentage decrease of 50.14%.
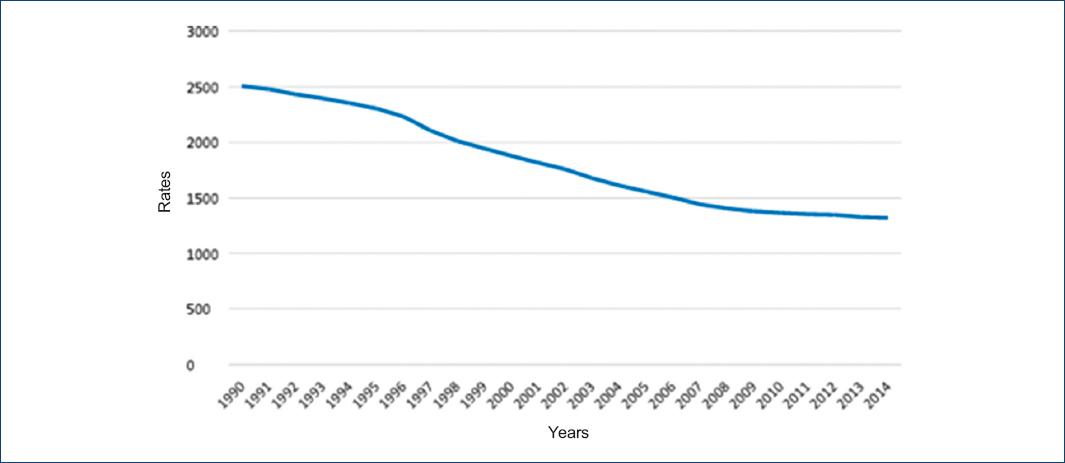
Figure 4 Years of potential life lost due to ischemic heart disease in Costa Rica, 1990-2014 period. Rates per 100,000 population (created based on data from the Institute for Health Metrics and Evaluation20).
As for years lived with disability (YLDs), figure 5 shows an increase of rates during the initial decade to then stabilize until the final years of the study. YLDs between 1990 and 2014 went from 103.41 per one hundred thousand population (95% CI: 71.01-147.14) to 104.75 (95% CI: 73.70-147.14); i.e. they remained practically the same (0.1% increase).
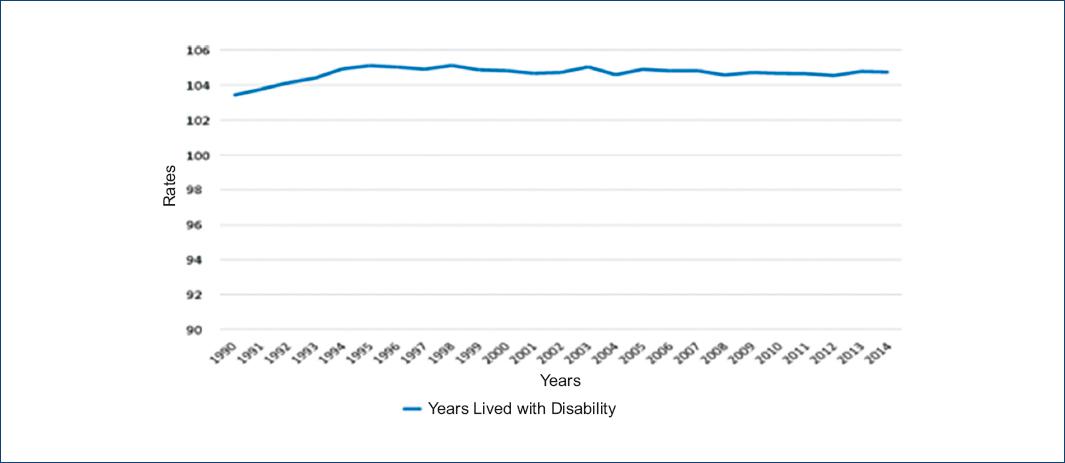
Figure 5 Years lived with disability due to ischemic heart disease in Costa Rica, 1990-2014 period. Rates per 100,000 population (created based on data from the Institute for Health Metrics and Evaluation20).
Geographical distribution
The highest crude rates during the first five quinquennia corresponded to the provinces of Heredia, San José and Cartago. Then, Heredia gave up its place to Alajuela and Cartago went to second place, while San Jose has had the highest rate throughout the last thirty years. The lowest rate corresponded to the province of Guanacaste, although in the last quinquennia, Puntarenas and Limón rates have approached much, almost getting even (Table 6).
Table 6 Ischemic Heart Disease crude and standardized mortality rates in people aged 35 to 74 years, by quinquennium according to province. Costa Rica 1970-2014
| Crude rates | |||||||
|---|---|---|---|---|---|---|---|
| Province | |||||||
| Quinquennium | San José | Alajuela | Cartago | Heredia | Guanacaste | Puntarenas | Limón |
| 1970-1974 | 108.8 | 88.8 | 100.3 | 129.4 | 39.4 | 61.7 | 126.8 |
| 1975-1979 | 101.5 | 106.4 | 90.7 | 118.7 | 60.3 | 61.4 | 102.1 |
| 1980-1984 | 125.9 | 115.7 | 108.2 | 127.4 | 69.3 | 89.5 | 100.7 |
| 1985-1989 | 129.1 | 102.4 | 106.1 | 120.5 | 76.1 | 83.1 | 114.5 |
| 1990-1994 | 108.1 | 92.7 | 104.9 | 106.2 | 70.0 | 78.7 | 108.1 |
| 1995-1999 | 105.7 | 93.3 | 99.0 | 90.8 | 60.3 | 92.9 | 75.2 |
| 2000-2004 | 96.5 | 81.0 | 88.8 | 80.6 | 65.6 | 76.8 | 65.8 |
| 2005-2009 | 83.6 | 72.6 | 82.6 | 71.8 | 63.1 | 64.7 | 62.7 |
| 2010-2014 | 86.3 | 71.1 | 76.8 | 73.5 | 62.2 | 64.4 | 61.2 |
| Standardized rates | |||||||
| Province | |||||||
| Quinquennium | San José | Alajuela | Cartago | Heredia | Guanacaste | Puntarenas | Limón |
| 1970-1974 | 109.7 | 86.3 | 104.4 | 124.4 | 39.0 | 68.9 | 134.2 |
| 1975-1979 | 99.1 | 102.6 | 92.9 | 116.4 | 58.5 | 65.8 | 106.0 |
| 1980-1984 | 119.8 | 110.5 | 109.1 | 123.4 | 64.3 | 90.8 | 101.1 |
| 1985-1989 | 123.5 | 99.2 | 107.4 | 117.8 | 71.1 | 83.7 | 117.3 |
| 1990-1994 | 106.2 | 93.0 | 109.3 | 109.4 | 67.0 | 79.8 | 116.7 |
| 1995-1999 | 106.4 | 96.9 | 105.4 | 96.5 | 58.7 | 95.2 | 86.4 |
| 2000-2004 | 96.5 | 83.9 | 93.9 | 86.2 | 64.5 | 78.5 | 75.9 |
| 2005-2009 | 79.3 | 71.8 | 83.5 | 72.7 | 60.4 | 64.2 | 69.1 |
| 2010-2014 | 78.3 | 67.5 | 74.8 | 71.1 | 58.8 | 61.9 | 63.9 |
Created with data from statistical yearbooks and from Centro Centroamericano de Población.
Province-standardized rates have had a quite similar behavior to the previously indicated crude rates (Table 6).
For IHD mortality geographical distribution we also resorted to an analysis by Costa Rica socioeconomic regions, with crude and standardized rates also being taken into account. These can be appreciated in table 7.
Table 7 Ischemic heart disease crude and standardized mortality rates in people aged 35 to 74 years, by quinquennium according to socioeconomic region. Costa Rica 1970-2014
| Crude rates | ||||||
|---|---|---|---|---|---|---|
| Socioeconomic region | ||||||
| Quinquennium | Central | Chorotega | P Central | Brunca | H Atlántica | H Norte |
| 1970-1974 | 109.3 | 40.6 | 71.7 | 54.8 | 126.8 | 48.1 |
| 1975-1979 | 107.9 | 57.2 | 81.5 | 50.4 | 102.1 | 56.6 |
| 1980-1984 | 127.2 | 67.4 | 94.0 | 78.3 | 100.7 | 75.4 |
| 1985-1989 | 124.1 | 73.5 | 97.5 | 75.4 | 114.5 | 67.9 |
| 1990-1994 | 108.7 | 69.7 | 89.8 | 67.0 | 108.1 | 59.8 |
| 1995-1999 | 103.1 | 61.3 | 101.7 | 81.8 | 75.2 | 69.9 |
| 2000-2004 | 92.4 | 63.7 | 82.9 | 73.1 | 65.8 | 64.8 |
| 2005-2009 | 81.8 | 62.1 | 75.0 | 59.6 | 62.7 | 54.8 |
| 2010-2014 | 81.7 | 60.9 | 70.8 | 58.5 | 61.2 | 63.3 |
| Standardized Rates | ||||||
| Socioeconomic region | ||||||
| Quinquennium | Central | Chorotega | P Central | Brunca | H Atlántica | H Norte |
| 1970-1974 | 108.2 | 40.3 | 72.5 | 67.6 | 134.2 | 52.5 |
| 1975-1979 | 104.6 | 56.2 | 81.3 | 56.2 | 106.0 | 62.9 |
| 1980-1984 | 121.2 | 63.6 | 89.8 | 81.5 | 101.1 | 84.1 |
| 1985-1989 | 119.3 | 69.5 | 92.9 | 77.8 | 117.3 | 74.8 |
| 1990-1994 | 108.2 | 67.2 | 88.4 | 69.1 | 116.7 | 67.0 |
| 1995-1999 | 105.6 | 59.6 | 103.2 | 84.3 | 86.4 | 78.7 |
| 2000-2004 | 94.3 | 62.5 | 84.4 | 74.5 | 75.9 | 71.8 |
| 2005-2009 | 79.2 | 59.5 | 73.6 | 59.1 | 69.1 | 58.7 |
| 2010-2014 | 75.8 | 57.6 | 66.9 | 56.6 | 63.9 | 65.6 |
In the case of crude rates, the highest corresponded to the Central region, followed by Huétar Atlántica. The lowest rates were observed in the Chorotega and Huétar Norte regions.
Regarding standardized rates evolution, it was quite similar to that of crude rates, with the highest being recorded in the central region (except for the first two quinquennia, in which they were surpassed by the Huétar Atlántica region rates, which in the rest of the period were at second place), with the lowest corresponding to the Chorotega and Huétar Norte regions.
Discussion
IHD accounted for 10.9% of mortality in Latin America and the Caribbean, ranked at first place as specific cause of death6, as it also did in the rest of the world21. Crude mortality rates for this cause in Costa Rica are slightly lower than the average for the Americas and in particular for Latin America, both for men and women and for both genders (Table 1). Rates are also higher in the Central American isthmus, given that Guatemala, Nicaragua and Panama have more elevated rates, with Costa Rica rates being almost equal to those of El Salvador and Belize, but clearly surpassing the Honduras rate. These crude rates showed a clear upward trend during a large part of the analyzed period, except in the final years, where a decline could be appreciated that was only interrupted in the 2010-2014 quinquennium.
In a previous study carried out by other authors10 in relation with IHD mortality during the 1970-2002 period, mortality was found to increase by 18.4%, with 6.1% corresponding to females and 28.4% to males. In our research, an increase is also observed in IHD crude rates until the year 2002, after which a slight decline begins, which continues on a plateau until 2009, to be followed by an increase between the years 2010 and 2014. This is best observed when the information is presented by quinquennia (Table 3), with the 2000-2009 declining trend being abruptly interrupted in the following five years. We postulate that perhaps this behavior is because life expectancy in Costa Rica has significantly increased over the last quinquennia, thus allowing for a larger number people to be exposed to dye from IHD. It is, in a certain sense, an emigration of previous mortality to older ages of life. The disproportionate increase in obesity and overweight in Costa Rica can also be mentioned.
As for standardized rates, those in the 35 to 74 years age group were obtained because this is the subset with the highest probability of experiencing a coronary event or dying from it. In this sense, rates were observed to continuously increase until the 1985-89 quinquennium, after which the trend was towards a straightforward decline, as it can be observed in table 4 and figure 2. This decline in our study was statistically significant (Table 5) for both genders (p = 0.04) and for males (p = 00.2), but not for females (p = 0.07). The percentage decrease between both extreme periods was equivalent to 39.8%. In this case, a similar trend to that the developed countries have had is observed22, except that the decline in age-standardized rates began much earlier in said countries, starting in 1980, as a consequence of primary and secondary cardiovascular prevention success21. Despite this large IHD incidence decline that has occurred in developed nations, it remains the cause of one out of every three deaths in the population older than 35 years23.
The above information allows us knowing that, in all quinquennia comprised within the 1970-1974 and 2010-2014 periods, IHD rates were higher in men in comparison with women, with the ratio being lower at the beginning of the series (1.43:1) and higher at the end of it (2.23:1). In addition, the ratio in favor of males is observed to gradually increase throughout all quinquennia, a result that is consistent with another study conducted in the country11, in addition to results obtained in other nations, such as Mexico24,25. Life expectancy in Costa Rica has always been higher in women in comparison with men (82.2 years for women and 77.5 for men, year 2016), which would partly explain the above observation. Higher IHD-related mortality in males has also been reported to likely be due to higher rates of smokers (18.8% in males and 7.9% in females, for the year 2014) and consumers of alcoholic beverages (males 44.4% and females 26.8% during the same year). In the latter case, it refers to people who reported having consumed at least one alcoholic beverage within the previous twelve months26. In the same sense, the same second survey on cardiovascular risk factors Indicates that a prevalence of high physical activity of 41.7% was obtained in individuals of the male gender, which was higher in the 20 to 39 years group (48%), while in the female gender, the prevalence of high physical activity was 26.2%, and it was higher in the 40 to 64 years group (28.9%)26.
Other of the most important risk factors recognized by multiple epidemiological investigations are overweight and obesity. Both conditions have significantly worsened precisely in Costa Rica. Thus, for example, overweight for both genders went from 24.9% in 1975 to 36.1% in 2014, for a percentage increase of 44.90%, with the peculiarity that males had higher prevalence than females, given that from 24.5% in 1975 they went to 39.3% in 2014, while females went from 25.4% to 33% in the same period. In the case of obesity (BMI equal than or greater than 30 kg/m2), it went from 6.3% in 1975 to 23.7% in 2014. In this case, women had higher prevalence, since from 8.5% it increased to 28.5%, while in men it went from 7.8 to 19.0%27. It could be postulated that the increase in IHD-related mortality observed during the last quinquennium (2010-2014) would be largely related to this increase in obesity and overweight in Costa Rica. In other countries, this negative effect of both conditions has also been reported, as well as that of diabetes, on CVD-related mortality, thus decreasing the possibility of a continuous decrease of their rates.
In addition, other indicators were obtained that do not only measure mortality but morbidity as well, expressed in this case by disability. Measurement of the burden of disease has been one of epidemiology paramount events in recent years, especially when in the 1990s, at the initiative of the World Bank, the first report on this matter was presented28. From there did DALYs emerge, which managed to combine fatal and non-fatal consequences of diseases, injuries and risk factors, represented by the YLL indicator and by YLDs. When figures 4 (YLL) and 5 (YLDs) are analyzed, DALYs are found to be constituted in more than 90% by YLLs, with a percentage lower than 10% corresponding to YLDs, quite a similar situation to that which occurred in Spain, where 96% was contributed by years of life lost to premature death and barely 4% by disability29; similar results have been reported in Colombia30. Both the sum of DALYs and YLLs have a tendency to decrease, with the latter going from rate of 13,705 per one hundred thousand population in 1990 to 10,447 in 2010. Conversely, YLDs practically did not experience significant changes, since from a standardized rate of 11,672 per one hundred thousand population in 1990 they went to a rate of 10,948 in 201031.
According to a publication of the Caja Costarricense de Seguro Social32, based on information provided by IHME, IHD-associated YLLs went from being the second specific cause of death in 1990 to constitute the first one in 2010. Also in that same publication, IHDs were the leading cause of DALY in Costa Rica, while as a cause of YLD, their contribution was practically insignificant, given that they were at 25th place.
IHD percentage contribution to overall mortality also did increase over time, but from the 1985-89 quinquennium on, the percentage stabilized around 14%, which is quite higher than that in Latin America, as previously mentioned.
With regard to IHD specific components percentage distribution, in our study we found that AMI occupied the main position, although with important variations that have ranged from 55 to 70%. In a research carried out in Mexico, the percentages found were 81.24% in 2001 and 82.75% in the year 200225.
Conclusions
In the evolution of IHD-related mortality in Costa Rica, three rather clear stages can be identified. The one first spreads from 1930 to 1964, and is characterized by a slow but continuous increase, which is followed by an explosive increase in the rates until the year 1984. Subsequently, the rates show a trend towards stabilization and decrease, which is interrupted in the last quinquennium.
When mortality of the 35 to 74 years age group is taken into account by quinquennia, in this case during the 1970-1974 and 2010-2014 periods, standardized rates allow for two to very clear periods to be identified. The first one, which goes from the beginning to the 1985-1989 quinquennium, is characterized by a continuous increase of rates, which is followed by an uninterrupted decrease until the final quinquennium of the time period. In this case, unlike IHD-related mortality for the entire population, the clear downward trend does not stop at the end of the series.
Ethical disclosures
Protection of people and animals. The authors declare that no experiments have been conducted on humans or animals for this research.
Confidentiality of data. The authors declare having followed the protocols of their work center on the publication of patient data.
Right to privacy and informed consent. The authors declare that no patient data appear in this article.
REFERENCES
1. Mozaffarian D, Benjamin EJ, Go AS, Arnett DK, Blaha MJ, Cushman M, et al. Heart Disease and Stroke Statistics-2016 Update:A report from the American Heart Association. Circulation. 2016;133(4):e38-360. [ Links ]
2. Sagar B. Dugani Andrew E. Moran Robert O. Bonow Thomas A. Gaziano. Ischemic heart disease:Cost-Effective acute management and secondary prevention. En: Prabhakaran D, Anand S, Gaziano TA, Mbanya JC, Wu Y, Nugent R, editores. Disease Control Priorities, Third Edition (Volume 5): Cardiovascular, Respiratory, and Related Disorders [Internet]. The World Bank Group;2017 [fecha de publicación:noviembre de 2017]. Disponible en:https://elibrary.worldbank.org/doi/abs/10.1596/978-1-4648-0518-9_ch8 [ Links ]
3. Hay SI, Abajobir AA, Abate KH, Abbafati C, Abbas KM, Abd-Allah F, et al. Global, regional, and national disability-adjusted life-years (DALYs) for 333 diseases and injuries and healthy life expectancy (HALE) for 195 countries and territories, 1990-2016:a systematic analysis for the Global Burden of Disease Study 2016. Lancet. 2017;390(10100):1260-344. [ Links ]
4. Naghavi M, Abajobir AA, Abbafati C, Abbas KM, Abd-Allah F, Abera SF, et al. Global, regional, and national age-sex specific mortality for 264 causes of death, 1980-2016:a systematic analysis for the Global Burden of Disease Study 2016. Lancet. 2017;390(10100):1151-210. [ Links ]
5. Health at a Glance 2017 [Internet]. Organisation for Economic Co-operation and Development. OECD Indicators [citado 19 de abril de 2018]. Disponible en:http://www.oecd.org/health/health-systems/health-at-a-glance-19991312.htm [ Links ]
6. Situación de Salud en las Américas: Indicadores Básicos 2016 [Internet]. Organización Panamericana de la Salud. Organización Mundial de la Salud [citado:19 de abril de 2018]. Disponible en:http://iris.paho.org/xmlui/handle/123456789/31288 [ Links ]
7. Evans-Meza R, Pérez-Fallas J, Bonilla-Carrión R. Análisis de la mortalidad por enfermedades cerebrovasculares en Costa Rica entre los años 1920-2009. Arch Cardiol Mex. 2016;86(4):358-66. [ Links ]
8. Vos T, Abajobir AA, Abate KH, Abbafati C, Abbas KM, Abd-Allah F, et al. Global, regional, and national incidence, prevalence, and years lived with disability for 328 diseases and injuries for 195 countries, 1990—2016:a systematic analysis for the Global Burden of Disease Study 2016. Lancet. 2017;390(10100):1211-59. [ Links ]
9. Memoria Institucional 2016. [Internet]. [citado 19 de abril de 2018]. Disponible en:https://www.ministeriodesalud.go.cr/images/stories/docs/DPI/2017/DPI_memoria_institucional_2016.pdf [ Links ]
10. RosellóAraya M, Guzmán Padilla S. Mortalidad por infarto agudo de miocardio:distribución geográfica y lugar de ocurrencia. Costa Rica, 1970-2002. Rev Costarric Cardiol. 2003;5(3):25-9. [ Links ]
11. RosellóAraya M, Guzmán Padilla S. Evolución de la mortalidad por enfermedad isquémica del corazón e infarto agudo del miocardio en Costa Rica, 1970-2001. Rev Panam Salud Publica. 2004;16:295-301. [ Links ]
12. Provincias de Costa Rica y sus límites | Temarios y Tareas [Internet]. [citado 22 de octubre de 2018]. Disponible en:https://temariosytareas.wordpress.com/2010/03/11/provincias-de-costa-rica/ [ Links ]
13. Instituto Nacional Estadística y Censos. Anuarios estadísticos 1920-1969. San José, Costa Rica. [ Links ]
14. Estadísticas vitales de mortalidad. Costa Rica 1970-2014 [Internet]. Centro Centroamericano de Población [citado:19 de abril de 2018]. Disponible en:http://ccp.ucr.ac.cr. [ Links ]
15. Camel-Vargas F. Estadísticas médicas y de salud pública. Universidad de Los Andes, Mérida (Venezuela). Talleres Gráficos Universitarios;1966. [ Links ]
16. Boletín Demográfico N.°73. América Latina y el Caribe:estimaciones y proyecciones de población. 1950-2050. Santiago de Chile:CELADE. División de Población;2004. [ Links ]
17. Moran A, Odden MC. Tendencias de la mortalidad por infarto de miocardio en España y Estados Unidos:¿una carrera cuesta abajo o cuesta arriba en el siglo XXI?Rev Esp Cardiol. 2012;65(12):1069-71. [ Links ]
18. Stata Corp 2014. Stata Statistical Sofware: Release 14 College Station, TX:Stata Corp LP. [ Links ]
19. Lozano R, Murray CJL, López AD, Satoh T. Miscoding and misclassification of ischemic heart disease mortality. Global Programme on Evidence for Health Policy Working Paper No. 12 [Internet]. World Health Organization; September 2001. Disponible en: http://www.who.int/healthinfo/paper12.pdf [ Links ]
20. GBD Compare | IHME Viz Hub [Internet]. University of Washington:Institute for Health Metrics and Evaluation [citado:16 de noviembre de 2017]. Disponible en:http://vizhub.healthdata.org/gbd-compare [ Links ]
21. Moran AE, Forouzanfar MH, Roth GA, Mensah GA, Ezzati M, Flaxman A, et al. The Global Burden of Ischemic Heart Disease in 1990 and 2010 The Global Burden of Disease 2010 Study. Circulation. 2014;129(14):1493-501. [ Links ]
22. Sanchis-Gomar F, Perez-Quilis C, Leischik R, Lucia A. Epidemiology of coronary heart disease and acute coronary syndrome. Ann Transl Med. 2016;4(13):256. [ Links ]
23. Bhatnagar P, Wickramasinghe K, Wilkins E, Townsend N. Trends in the epidemiology of cardiovascular disease in the UK. Heart. 2016;102(24):1945-52. [ Links ]
24. Lozano R, Escamilla JA, Escobedo J, López M. Tendencia de la mortalidad por cardiopatía isquémica en México, de 1950 a 1985. Salud Pública de México. 1990;32(4):405-15. [ Links ]
25. Velázquez Monroy O, Barinagarrementería Aldatz FS, Rubio Guerra AF, Verdejo J, Méndez Bello MÁ, Violante R, et al. Morbilidad y mortalidad de la enfermedad isquémica del corazón y cerebrovascular en México. 2005. Arch Cardiol Méx. 2007;77(1):31-9. [ Links ]
26. Encuesta de Factores de Riesgo de ECNT. CCSS. Vigilancia de los factores de riesgo cardiovasculares. Segunda encuesta, 2014. Roy Wong McClure, editor. San José, Costa Rica. EDNASSS-CCSS. [ Links ]
27. Evans-Meza R, Pérez-Fallas J. Tendencias del índice de masa corporal en Costa Rica de 1975 al 2014. Rev Hisp Cienc Salud. 2016;2(2):153-60. [ Links ]
28. GBD History [Internet]. Institute for Health Metrics and Evaluation, University of Washington [citado 19 de abril de 2018]. Disponible en:http://www.healthdata.org/about/history [ Links ]
29. Fernández de Larrea-Baz N, Morant-Ginestar C, Catalá-López F, Gènova-Maleras R, Álvarez-Martín E. Disability-adjusted life years lost to ischemic heart disease in Spain. Rev Esp Cardiol. 2015;68:968-75. [ Links ]
30. Bolívar-Mejía A, Vesga-Angarita BE. Burden of cardiovascular disease in Colombia. Current Topics in Public Health, Alfonso J. Rodriguez-Morales [Internet]. Colombia;2013 [citado 23 de abril 2018]. IntechOpen. DOI:10.5772/53280. Disponible en:https://www.intechopen.com/books/current-topics-in-public-health/burden-of-cardiovascular-disease-in-colombia [ Links ]
31. Costa Rica Profile [Internet]. Institute for Health Metrics and Evaluation, University of Washington [citado:23 de abril de 2018]. Disponible en:http://www.healthdata.org/costa-rica [ Links ]
32. La carga de enfermedad y esperanza de vida saludable-Costa Rica. 2014. Caja Costarricense de Seguro Social. San José, Costa Rica;2014. [ Links ]
Received: June 07, 2018; Accepted: November 28, 2018
 Este es un artículo Open Access bajo la licencia CC BY-NC-ND
