


 nueva página del texto (beta)
 Inglés (pdf)
 Artículo en XML
 Referencias del artículo
 Enviar artículo por email
 Citado por SciELO
  Similares en
SciELO
Similares en
SciELO 
 Permalink
Introduction
Analysis of the structure-activity relationships (SAR) of compound data sets using the concept of activity landscape modeling is gaining relevance in the medicinal and computational chemistry communities (Guha, 2012; Dimovaet al., 2014). It is well-recognized that the identification of activity cliffs, defined as compounds with high structure similarity but large potency difference, has a major impact in lead optimization efforts. As such, activity cliffs have a ‘nice face’ because they provide key structural information of specific and frequently subtle changes in the structure associated with large changes in activity. At the same time, activity cliffs have an ‘ugly face’, representing the bottle neck of computational predictive models that often assume smooth regions of the SAR landscape. The ‘duality’ of the roles of activity cliffs in drug discovery has been recently commented (Cruz-Monteagudoet al., 2014). Also, it has been argued that activity cliffs may be artifacts of the molecular representation or artifacts due to, for example, errors in the measurement of potency (Medina-Franco, 2013).
Activity landscape analysis and identification of activity cliffs has been traditionally made based on pairwise relationships. Although detecting specific structural changes that have a dramatic impact on the activity (vide supra) is relevant, identifying individual compounds with high frequency among activity cliffs has outmost importance for example, to select queries in similarity searches. Increasing efforts have been devoted towards the identification of single compounds that ‘induce’ or at least are associated with activity cliffs. Our group proposed a method to uncover the so-called ‘activity cliff generators’ based on Structure-Activity Similarity (SAS) maps. SAS maps are two-dimensional plots of activity similarity (or potency difference) vs. activity similarity. All possible pairs of compounds can be represented in a SAS map (Shanmugasundaram & Maggiora, 2001; Medina-Franco, 2012). Pairs of compounds that correspond to activity cliffs can be easily recognized in the quadrant that intersects pairs of molecules with high structure similarity but low activity similarity (or high potency difference). In turn, activity cliffs generators correspond to compounds with very high frequency (e.g., two standard deviations above average) in the ‘activity cliff quadrant’ (or region) of the SAS map (Méndez-Lucio et al., 2012). When using this method, caution should be used to select the threshold to define the regions of the activity landscape. Certainly, the thresholds to define quantitatively ‘high’ (or ‘low’) structural or activity similarity are tailored to the specific project needs (Dimova et al., 2014; Medina-Franco, 2012).
Herein, we conducted the activity landscape study of a set of 289 synthetic compounds with activity against the G protein-coupled receptor kinase 6 (GRK6). Following our previous work, to account for the dependence of the activity landscape with the structure representation, we used mean Structure-Activity Landscape Index (SALI) values that represent a consensus measure capturing information of multiple structure representations. The SALI metric was proposed by Guha and Van Drie for the quantitative analysis of activity landscapes (Guha & VanDrie, 2008; Guha & VanDrie, 2008).
Methods
Data set
To illustrate the approach, herein we analyzed a set of 289 synthetic compounds with activity against GRK6, previously reported. The IC50 values were measured under the same experimental conditions. The distribution of the activity values indicated the most active compound in the data set has an IC50 of 0.079 µM and >1x10⁴ (approximated here to 999 µM), respectively. The pIC50 range covers four log units (7.1 - 3.0). The median of the IC50 values is 3.59 (pIC50 = 5.45).
Fingerprint representations
A total of seven 2D fingerprint representations were computed with Canvas, 2012; Sastryet al., 2010: Molecular Access System (MACCS keys), radial (extended connectivity), atom pairs, topological, Molprint 2D, atom triplets, and dendritic.
Structural similarity
Structural similarities were computed with the Tanimoto coefficient Jaccard, 1901. This metric has been successfully applied in activity landscape modeling, for example in Medina-Franco et al., 2009. However, other measures such as Euclidean distance can be used. For instance, in a previous work, both Euclidean distance and the Tanimoto coefficient were used to model activity landscapes using three 2D fingerprint representations (Peltason et al., 2010). Authors of that work noted that the landscapes generated with Euclidean distance and Tanimoto similarity were often similar (Peltason et al., 2010).
Activity cliffs with SALI
The presence of activity cliffs was evaluated quantitatively by computing the SALI values with the expression (Guha & VanDrie, 2008; Guha & VanDrie, 2008):
where A i and A j are the activities of the ith and jth molecules and sim(i,j) is the similarity coefficient between the two molecules. Thus, to compute SALI values any similarity method can be employed. Mean SALI values were computed in this work using the mean structure similarity of four selected 2D and 3D molecular representations (vide infra). This approach of using multiple and complementary structure representations to compute consensus SALI values has been used in other activity landscape studies (Medina-Franco et al., 2009; Medina-Franco et al., 2011; Waddell & Medina-Franco, 2012). As will be shown later, the mean SALI values were consistent when interpreting the SAR of the data set, highlighting the feasibility of using mean fusion similarity values in characterizing activity landscapes.
Consensus SALI values
The authors have proposed that the information captured by different molecular representations can be combined using the principles of data fusion (Medina-Franco et al., 2007; Willett, 2013) to generate robust activity landscape models. One approach that was implemented in this work (and that has been used to aggregate similarity measures in activity landscape modeling) is to compute the mean structure similarity of a set of selected fingerprints (approach reviewed in Medina-Franco et al., 2013). Using this approach consensus SALI values were obtained by computing the mean structure similarity in Equation (1) (Medina-Franco et al., 2009). To compute the mean SALI values, the selection of the structural fingerprints was based on the different designs of the fingerprints and considering those with lowest linear correlation, e.g., selecting fingerprints as orthogonal as possible, with the underlying rationale that different fingerprints will capture different aspects of the molecular structures (Yongye et al., 2011).
Activity cliff generators
In order to identify activity cliff generators we employed two related approaches which are based on the distribution of the SALI values for the compound data set:
a) In the first approach, all molecule pairs with a high mean SALI value were identified. To define ‘high’ SALI value we computed the mean and standard deviation of the distribution of the mean SALI values, and then selected the molecule pairs with SALI values greater than two standard deviations. Then, for each compound, we computed the frequency of occurrence among the pairs highly-ranked. Activity cliff generators are selected as the molecules with the highest frequencies (followed by visual examination, as interpretability check). This approach is reminiscent of a method we previously proposed to identify individual molecules associated with high selectivity in a chemogenomics data set (Yongye & Medina-Franco, 2012). As discussed above, the ‘high’ mean SALI value depends on the distribution of the activity and similarity data of the particular data set.
b) In the second approach, for each molecule in the data set we computed the distribution of the mean SALI values of all the molecule pairs containing each compound. Then, individual molecules with the highest distributions (e.g., selected by the highest median) are selected as the activity cliff generators.
Consensus SAS maps
As a reference, we also generated the consensus SAS maps using a standard protocol (Medina-Franco, 2012). Briefly, for each pair of compounds (41,616 data pairs), we plot the absolute value of the potency difference vs. the mean structure similarity. The later measure was the one used to compute the mean SALI values described above. Further details of the construction of the consensus SAS maps are provided elsewhere (Medina-Franco, 2012; Pérez-Villanueva et al., 2010).
Results and Discusion
Distribution of pairwise similarities per fingerprints
The cumulative distribution functions (CDF), and their corresponding statistics for the seven fingerprint representations employed, derived from the 41,616 pairwise similarities, are shown in Figure 1. Similarity values computed with MACCS keys (as implemented in Canvas) were associated with the highest mean and median values. Meanwhile, similarity values calculated with Atom Triplets followed by Radial had the lowest mean and median values. The different ranges of similarity values computed for the same data set have been noted in other studies (Yongye et al., 2011; Pérez-Villanueva et al., 2010) indicating the different resolution and design of the fingerprints. This observation also indicates that, in general, fingerprint representations capture different aspects of the chemical structures and further confirms the relevance of using multiple representations to derive consensus activity landscape models (Medina-Franco et al., 2009; Medina-Franco et al., 2012).
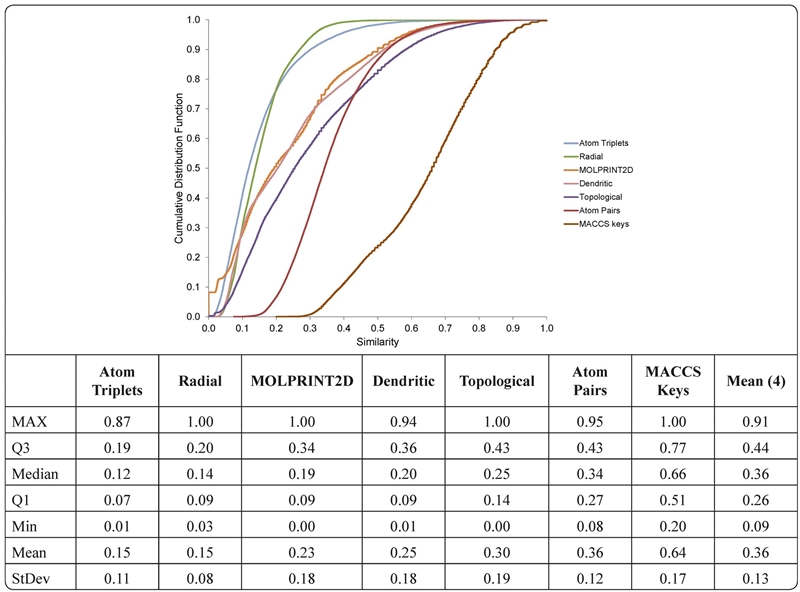
Figure 1. Cumulative distribution functions (CDFs) of the 41,616 pairwise similarities of the 289 compounds using seven structural representations. The table summarizes statistics of the distributions. Q3 and Q1 indicate the third and first quartiles, respectively. The table also includes selected statistics of the distribution of the mean similarity computed with 4 selected fingerprints (marked in bold).
Correlations between fingerprints
In order to select the fingerprints to compute the mean structure similarities (and then compute the mean SALI values), we constructed a correlation matrix from the 41,616 pairwise similarities and established the degree of association between the seven representations (Table I). For this data set, some fingerprints showed high correlations such as dendritic- topological, atom triplets-atoms pairs, MOLPRINT 2D-radial, and MOLPRINT 2D-topological that had correlations equal or greater than 0.88. The high correlations indicate that these pairs of fingerprints capture similar structural information. Pairs of fingerprints that showed relatively low correlations were, for example, MACCS keys-atom pairs and topological and atom pairs.
Table I Correlation matrix between the 41,616 pairwise similarities using seven fingerprint representations.
| ΔpIC 50 | maccs | radial | atompairs | molprint2d | topological | atomtriplets | dendritic | |
|---|---|---|---|---|---|---|---|---|
| ΔpIC50 | 1.000 | |||||||
| maccs | -0.230 | 1.000 | ||||||
| radial | -0.283 | 0.779 | 1.000 | |||||
| atompairs | -0.400 | 0.652 | 0.697 | 1.000 | ||||
| molprint2d | -0.358 | 0.811 | 0.883 | 0.732 | 1.000 | |||
| topological | -0.339 | 0.720 | 0.823 | 0.665 | 0.882 | 1.000 | ||
| atomtriplets | -0.417 | 0.634 | 0.797 | 0.909 | 0.820 | 0.789 | 1.000 | |
| dendritic | -0.355 | 0.694 | 0.840 | 0.644 | 0.876 | 0.982 | 0.790 | 1.000 |
a In bold are marked the 4 fingerprints selected to compute the consensus models of the activity landscapes.
Selection of fingerprints
In order to compute mean structure similarities to then calculate mean SALI values, we selected structural representations as complementary (but not redundant) as possible using two major criteria: 1) fingerprints with different design, and 2) fingerprints with correlation as low as possible. The same criteria have been used in several studies to construct consensus activity landscapes. Based on the observations above, we selected MACCS keys, radial, atom pairs, and topological fingerprints. The maximum correlation between any of the selected representations is 0.779 (between MACCS keys and radial fingerprints, Table I).
Activity cliff generators based on mean SALI values for the entire distribution
The mean SALI values were computed using the four previously selected representations. Table II summarizes selected statistics of the distribution of the mean SALI values for all the 41,616 pairwise combinations in the data set. The maximum mean SALI value was 9.49 while the mean and standard deviation of the distribution was 2.12 and 1.63, respectively. The molecule pair with the highest mean SALI value was NSMC00258-NSMC00443 (vide infra).
Table II Distribution of mean SALI values for all 41,616 individual compounds in the data set.
| mean SALI | |
|---|---|
| MAX | 9.49 |
| Q3 | 3.20 |
| Median | 1.81 |
| Q1 | 0.77 |
| Min | 0.00 |
| Mean | 2.12 |
| StDev | 1.63 |
We considered as consensus activity cliffs if the pairs of compounds had a mean SALI value greater than the mean plus three standard deviationsi.e., if the mean SALI value was greater than 7.01. Based on this heuristic criterion, 62 pairs of compounds where regarded as consensus (activity) cliffs, the 62 molecule pairs contain 41 individual molecules.
Figure 2 shows a histogram with the frequency of each of the 41 compounds present in the 62 consensus activity cliffs (derived from the mean SALI values). Figure 2 indicates that the most frequent compound is NSMC00128 present in 23 (37%) of the consensus cliffs. This compound is followed by NSMC00258 (13; 21%), NSMC00443 (11, 18%), and NSMC00286 (8, 13%). The remaining 37 molecules have a frequency equal or lower than 5 (≤ 8%). The two most frequent compounds (NSMC00128 and 258) are inactive. The most active molecules with high frequency are NSMC00443 (IC50 = 0.079 µM), 396 (IC50 = 0.131 µM), and 444 (IC50 = 0.133 µM).
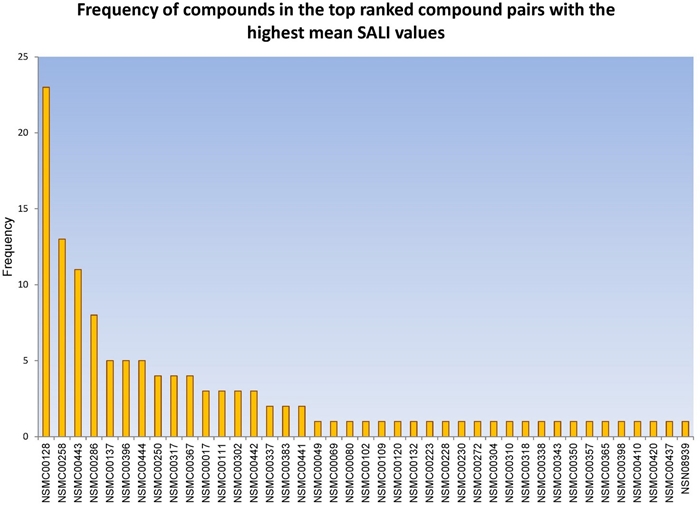
Figure 2. Histogram with the frequency of occurrence for each compound in the compound pairs with the highest similarity values.
Figure 3A-D shows the distribution of all 288 compounds pairs that contain the four top ranked activity cliff generators in consensus SAS maps. In each map, data points are colored by the mean SALI value using a continuous scale from green (lowest value) to red (greater value). As expected from the SALI values, red points are located towards the top-right quadrant of the plot that identifies pairs of compounds with high mean structural similarity and high potency difference. The lowest SALI values (zero, green points) are located at the bottom of the SAS maps along an x-horizontal line with potency difference value of zero. Figure 3A visually depicts that overall NSMC00128 is the compound with the largest number of points in the top-right quadrant of the SAS map. Note also that the consensus SAS maps top-ranked cliff-forming compounds, have several data points with very large potency difference values larger than or close to four logarithmic units. In contrast, Figure 4 in the Supporting Information shows the distributions of data point for pairs of compounds with molecules with the lowest distributions of the SALI values. Overall, in the SAS maps of the non-cliff forming compounds, data points are located in any of the three quadrants that do not correspond to activity cliffs.
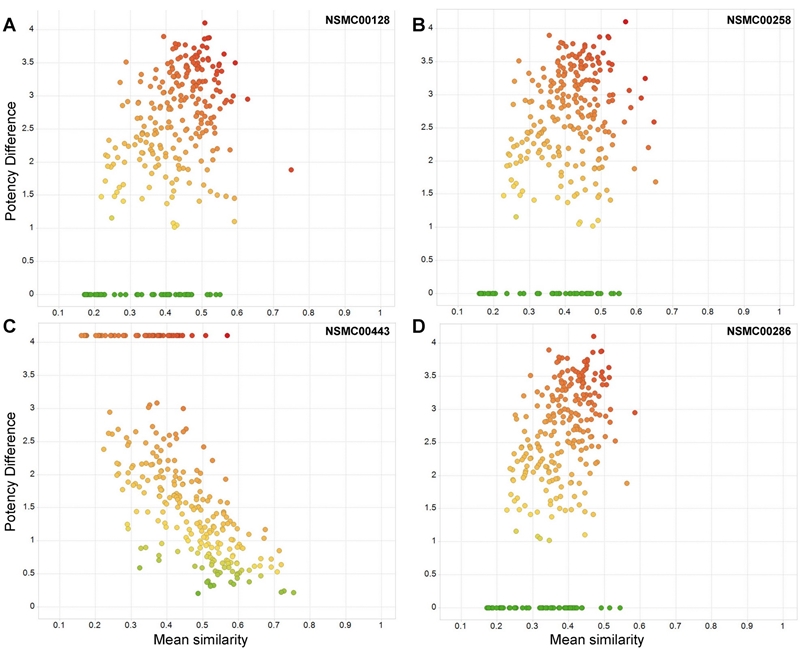
Figure 3. Visual representation of activity cliff generators in consensus SAS maps. Each map shows 288 data points that correspond to all pairwise comparisons containing and activity cliff generator (A) NSCM00128, (B) NSMC00258, (C) NSMC00443 and (D) NSMC00286. Data points are colored in gray scale by the mean SALI value using a continuous scale from dark gray (highest value of 9.49) to medium gray (median value of 1.81) to light gray (lowest value of zero).
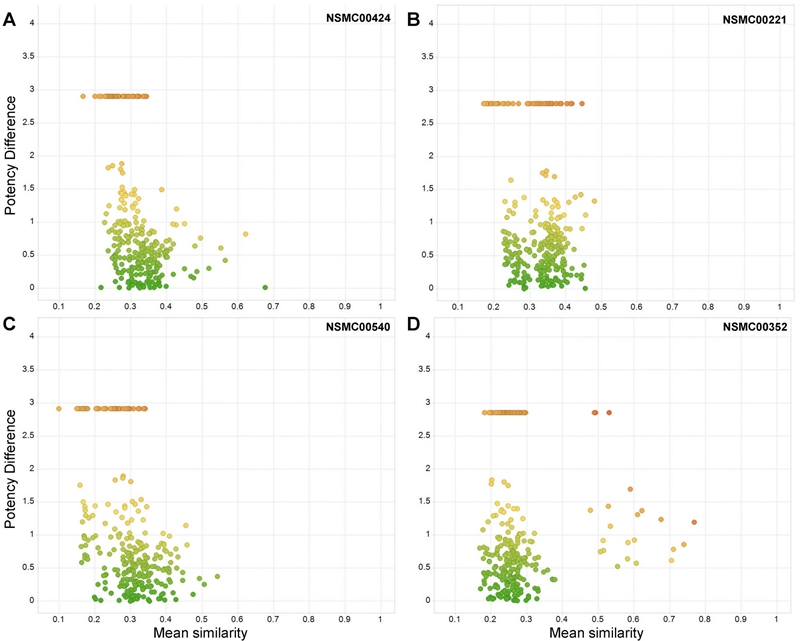
Figure 4. Visual representation of compounds associated with the lowest mean SALI in consensus SAS maps. Each map shows 288 data points that correspond to all pairwise comparisons containing one compound. (A) NSCM00424, (B) NSMC00221, (C) NSMC00540 and (D) NSMC00352. Data points are colored by the mean SALI value using a continuous scale from red (highest value of 9.49) to yellow (median value of 1.81) to green (lowest value of zero).
Figure 5 shows 6 representative examples of consensus activity cliffs. All compounds in these examples are activity cliff generator, in particular, NSMC00128, NSMC00258 and NSMC00443. Table III summaries the structure similarity, potency difference and mean SALI value for each of the six pairs. The position of the activity cliffs in the SAS maps is shown in Figure 6 of the Supporting Information. The molecule pair 272-318 change in F → Cl (pair with one of the highest mean structure similarity in the data set) increases the potency from 3.31 to 0.545. The compound pair 258-398 has the second highest mean SALI value in the data set (8.61). The structural difference in this molecule pair is the presence of a furan ring in the scaffold of the molecule. This structural change has a dramatic change in the potency in 3.25 log units. The compound pair 258-443 has the highest mean SALI value in the data set (9.49) with an even more pronounced change in the potency in 4.1 log units. Compound 443 is the most active in the data set (IC50 = 0.079 µM). Putting together the SAR of these two molecular pairs indicates that the SAR path marked by compounds 258 → 398 → 443 i.e., adding a furan ring to 258 and further adding a phenyl ring in 443, significantly improves the compound potency. Compound pair 128-111 shows that replacement of 1,8-naphthyridine ring for quinolone i.e., a difference of one nitrogen atom in the heterocyclic ring, increases the potency in nearly 3 log units. Similar to the examples discussed before, compound pairs 128-250 and 128-338 (both with mean SALI values > 8.0) further show the significant increment in activity due to the addition of a furan ring to the structure of the inactive compound 128 and the replacement of the 1,8-naphthyridine ring for a quinoline ring.
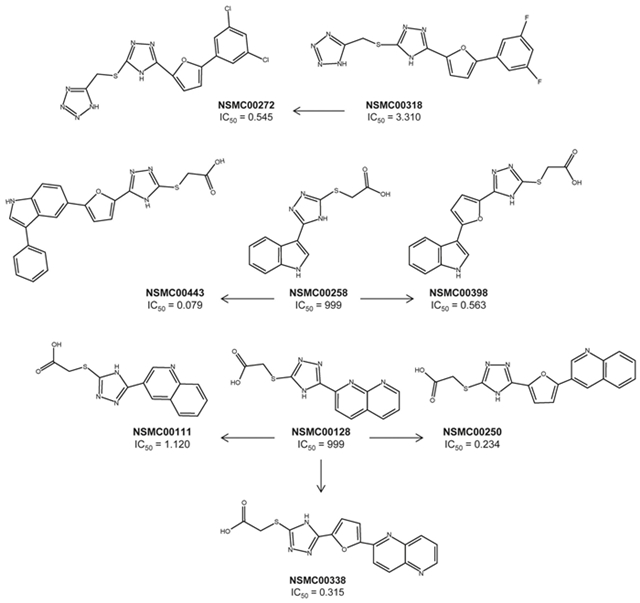
Figure 5. Representative examples of consensus activity cliffs. All compounds in these examples are activity cliff generators.
Table III Summary of the structure similarity, potency difference and mean SALI value for representative consensus activity cliffs.
| Pair | MaxpIC 50 | ΔpIC 50 | maccs | radial | atompairs | topological | Mean | Mean SALI |
|---|---|---|---|---|---|---|---|---|
| 00258_00443 | 7.10 | 4.10 | 0.950 | 0.233 | 0.444 | 0.644 | 0.568 | 9.49 |
| 00258_00398 | 6.25 | 3.25 | 0.950 | 0.324 | 0.525 | 0.690 | 0.623 | 8.61 |
| 00128_00338 | 6.50 | 3.50 | 0.975 | 0.270 | 0.569 | 0.558 | 0.593 | 8.60 |
| 00128_00250 | 6.63 | 3.63 | 0.975 | 0.250 | 0.555 | 0.468 | 0.562 | 8.29 |
| 00111_00128 | 5.95 | 2.95 | 1.000 | 0.233 | 0.778 | 0.500 | 0.628 | 7.92 |
| 00272_00318 | 6.26 | 0.78 | 0.944 | 1.000 | 0.721 | 0.939 | 0.901 | 7.92 |

Conclusions
Activity landscape analysis of a data set of synthetic compounds tested as inhibitors of GRK6 uncover several activity cliffs, in particular activity cliff generators. Activity cliff generators were identified as molecules highly frequent among molecule pairs with the largest ratio between activity difference and molecular distance as computed by the SALI measure. Multiple structure representations were considered to reduce the dependence of the activity landscape with structure representation. The SAR of the activity cliffs pointed to specific structural modifications that have a large impact in the activity of these compounds. The strategy discussed in this work can be extended to analyze the SAR for any other data set with measured activity for single or multiple targets.

