


 nova página do texto(beta)
 Inglês (pdf)
 Artigo em XML
 Referências do artigo
 Enviar este artigo por email
 Citado por SciELO
  Similares em
SciELO
Similares em
SciELO 
 Permalink
Introduction
Brazil is the fifth largest countries in the world, exceeded in size by Russia, Canada, China, and the United States. Moreover, its productive activities vary in the different regions of the country, with specific productive structures in each space (Alves, 2020). These characteristics result in great heterogeneity regarding the country’s economic and social dynamism. Therefore, economic crises tend to affect each space in a different way, impacting local social aspects differently.
In such a context, the objective of this paper is to analyze possible effects of the economic crisis caused by Covid-19 on criminality, poverty and mortality (due to preventable causes) comparing municipalities in Brazil. Surely, Covid-19 has resulted in incalculable damage to the health in the country. Thousands of people have already been ill and, unfortunately, not a few have died from Coronavirus related diseases. Some municipalities have seen the collapse of their health system, which worsens the existing health problem. Moreover, the rhythm of contamination is one of the fastest in the world, placing Brazil in the position of one of the countries with the highest number of deaths in the next few weeks, (according to estimates put forward by Bhatia et al., 2020), for being still in the exponential phase of the illness.
However, in addition to the Covid-19 health problems, the economy has experienced a parallel effect. Unfortunately, even municipalities that have not been affected too strongly by the virus, already experience economic problems. Basically, there are two reasons that make the Coronavirus crisis affect local economies, namely: Brazilian exports, which were already in decrease and now follow a faster downward trend resulting from the international income fall, and the reduced domestic demand (Maliszewska et al., 2020; Fernandes, 2020).
It seems relevant to emphasize that even if no restrictive measure had been implemented in Brazilian municipalities, there would be reduction in the domestic demand. It is natural that with the presence of the virus, people reduce their exposure, avoiding crowded places. Therefore, the decrease in the demand for some goods and services (such as those in the areas of events, gastronomy, bars, restaurants, tourism, accommodation, commerce, etc.), would have been naturally affected.
In early March, a few days after Brazil had confirmed its first Covid-19 case, several states and municipalities adopted social distancing formal measures. The objective of such measures was to flatten the infection curve aiming at preventing the health system collapse. The first studies related to them indicated that these initial measures were important to control the virus spread in the Brazilian territory. For example, Ganem et al. (2020) evidenced a positive impact of the social distancing early measures applied in São Paulo, slowing the dynamics of the Covid-19 transmission, estimating an expressive retraction in the number of deaths in next few months as a result of that action.
Even if current evidence (national, and especially international, such as that presented by Lee et al., 2020) has shown social distancing as the best way to mitigate the effects of this pandemic, there has been some political and economic pressure to stop these measures. The economic sector tension casts doubt on the application of such measures by picturing catastrophic future scenarios from the economic and social standpoint, projecting great misery and mortality.
However, some projections such as those by Correia et al. (2020), already point out to a great economic crisis regardless of the adoption of social distancing measures or not. This should occur, according to them, because with the virus spread, social interactions are naturally reduced, affecting locally any type of economic activity that depends on such interactions. Also, in a globalized world, the national dynamics depend on the international context. And the international projection shows a 3% mean global income contraction, with countries like Italy (-9.1%), Spain (-8%), France (-7.2%) and Germany (-7%) presenting even higher percentages. According to the International Monetary Fund (IMF) (2020), this is expected to be the greatest global economic slowdown since the Great Depression in the 1930s. China, the greatest Brazilian commercial partner, is expected to reach a 1.2% growth rate in 2020 (in 2019, it was 6.1%), below the 6% predicted in January by the IMF. Thus, the Covid-19 economic effects tend to exist regardless of the restrictive measures adopted inside the country.
Correia et al. (2020), when analyzing the Spanish flu in the United States in 1918, observed that the cities that acted earlier and were stricter with the distancing measures did not necessarily worsen their subsequent economic crisis. In fact, those that acted earlier and more aggressively obtained a relative increase in several economic indicators after the end of the pandemic, as in the case of industrial employment. Therefore, those authors concluded that although a pandemic is “highly detrimental to the economic activity”, fast response to it might reduce mortality and, at the same time, be economically beneficial to the after-pandemic recovery.
Currently, this is the great debate in Brazil: on the one hand, the actors of the federal government and entities of the productive structure defend the opening of economic activities, on the other hand, some states and municipalities defend the partial isolation of the population as a way of preventing deaths and the collapse of the health system. This paper is inserted in this struggle.
The great slogan of those defending the end of the social distancing measures is that poverty, famine and criminality resulting from the economic crisis will kill more than the pandemic. Such predictions are difficult to be confirmed, since, while many people might suffer deprivation due to the economic crisis and have social problems, other studies such as Tarrataca et al. (2021), evidenced through simulations that if the restriction measures are abandoned, Covid-19 will spread in waves all over the country, increasing the number of deaths.
In this context, this paper analyzes a recent period in Brazil (2012-2017), a time when the country faced an intense economic crisis, reaching a 3.5% decrease in the economy, focusing mainly on 2015 (crisis peak). The objective is to investigate the impact of the economic crisis on some social variables, focusing mainly on Brazilian municipalities that were the most affected in the 2015 crisis and measuring the economic impact on the pre-selected social variables.
The events of this period should not necessarily reflect literally the consequences of the Covid-19 crisis, since there is an aggravating factor related to the mortality resulting from the virus. However, the internal dilemma is in the great economic crisis that will occur if the predictions of Gross Domestic Product (GDP) drop become true, according to some local actors, due to the social distancing. The rationale behind such predictions is the idea that the social distancing economic impacts are greater than the benefits it might bring to public health (Ferrari and Cunha, 2020). That is, they defend the appearance of greater social problems if there is a GDP fall as predicted by international authorities.
For this reason, some groups defend the abandonment of restrictive measures to prevent this economic shock, defending that the proportional number of deaths caused by Covid-19 would be lower than the number of deaths due to other diseases, or social processes such as criminality and traffic accidents (Ferrari and Cunha, 2020).
Thus, the internal dilemma is not based on the impact of coronavirus on mortality rates, but rather on the economic and social damage caused by the social distancing measures. For this reason, our objective is to study a period of strong economic contraction in Brazil to evaluate whether the social effects announced by the defenders of the ‘return to normality’ were observed in all municipalities of the country.
Szirmai (2005) argues that many countries, including Brazil, presented a more intense growth rate in some periods of their history, and even so, this did not significantly affect their poverty levels. This is probably due to some structural elements, namely: the productive structure that is formed by large oligopolies, which are most of the time international; the lack of an internal chain of productive activities, with large income leakages resulting from the importation of complementary goods; the income concentration in the job market, etc. In 2017, for example, the Brazilian GDP grew 1.1%, however, the mean income growth of workers who received a minimum wage (30% of the population) was only 0.90%, while the richer population had an 8.4% income growth (IBGE, 2020).
Thus, Szirmai (2005) inferred that economic growth is a necessary condition for the socioeconomic development of a region, but, at the same time, is not enough, mainly due to its high concentration.
Taking that into consideration, the GDP fall might not equally affect the whole population, due to the concentration of production in some national agents. This is the hypothesis investigated in this study, that not necessarily all Brazilian spaces would have their social aspects affected by the Brazilian recession due to the structural characteristics of the productive distribution.
Similar studies such as Alves (2020) and Silva et al. (2021) investigated the economic crisis impact on the income dynamics in different regions of the country, identifying structural differences or its effect on the sectoral price dynamics; however, they did not address the impact of these crises on social aspects, which is the main contribution of this paper.
As pointed out by Angaw (2021), when analyzing the crisis provoked by Covid-19 in Ethiopia, the political responses given by the public administration aiming to mitigate the socioeconomic crises resulting from the pandemic are essential, however, they are also limited; for this reason, identifying which spaces are more impacted by a recession is very important to direct more effective specific actions through well-informed public policies.
With this purpose, this paper is structured in four sections. The first section is this introduction, the second presents the methodology, the third part is the data analysis and the fourth presents final considerations.
1. Methodology
Aiming at analyzing the possible effects of the economic crisis caused by the Covid-19 on criminality, poverty, and mortality rates (due to preventable causes) between municipalities in Brazil, the economic crisis Brazil went through from 2012 to 2017 was taken as a reference.
We understand that global financial crisis had a different origin from the one that has been developing recently. However, our objective is not to identify the Covid-19 impact on the economy, or the economic behavior after the pandemic. Our discussion takes the assumption that the social distancing measures will drastically affect the economic activity in the country and, therefore, will have significant impact on social aspects and investigates it. Our intention is to capture the effect of an intense economic crisis on social aspects, aiming at identifying the scope of a possible economic downturn.
Souza Junior et al., (2020), when projecting the Brazilian economic growth in 2020, presented three sceneries: quarantine up to the end of April, with the prediction of a 0.4% negative variation in the GDP; with a two-month social distancing period, a 0.9% fall in the GDP; with three months of those measures, a 1.8% fall. However, the IMF’s most recent estimates (2020) predicted a 5.3% decrease in the Brazilian GDP.
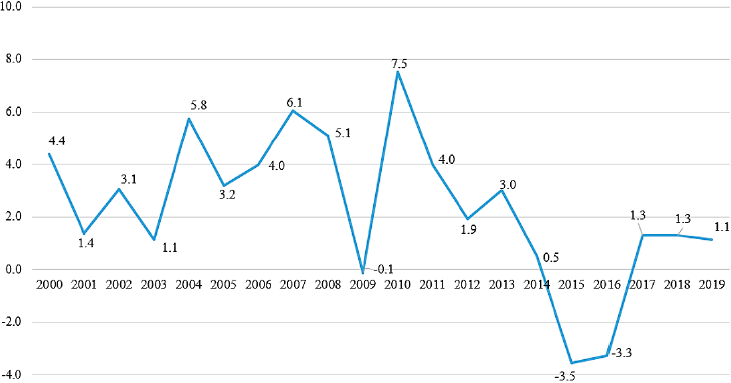
Therefore, the GDP decrease predicted by the different studies varied from 1% to 5%. In this sense, the following decrease rates in the Brazilian economy were analyzed: 1% or over, 2% or over, 3% or over, 4% or over and 5% or over. The last recession occurred in the country between 2012 and 2017, however, it peaked in 2015, as shown in Graph 1. For this reason, the year analyzed in this study was 2015 for showing the greatest decrease in the last 30 years.
Finally, the method used to evaluate the impact of the GDP fall on the social variables selected was the Propensity Score Matching (PSM)1 method, as presented below. The assumption is a GDP shock (considering that the country moved from a 0.5 economic growth rate in 2014 to -3.5% in 2015) and the PSM is one of the best methods to evaluate the effect of an exogenous action (either a policy, a program, or a specific action in time).
1.1. Econometric Model: Propensity Score Matching
An efficient way to evaluate the effect of a specific action on a given variable consists in observing it when the analysis unit i (in this case, municipalities) is affected by certain action in contrast with when it is not affected (Heinrich et al., 2010). The difference obtained in the variable of interest represents the impact of the action. That is (1):
Where:
The impact of any specific action should not be individualized, but rather, should have its mean effect on the group under analysis measured. With this purpose, the parameter known as Average Treatment Effect (ATE), described by (2).
Where: E is the expected value;
The difficulty of measuring (2) is that this and other effects are not necessarily observable. Thus, supposing that the difference between the averages is given by the average of the differences, then ATE can be represented by (3).
The item
If adding to and subtracting from (4) the term, the difference between and ATE (5) is obtained:
Where: SB corresponds to the difference between the variable Y of the group that had GDP fall and those municipalities that did not have it. If SB is equal to zero, ATE can be measured through the difference between the averages of the variable Y; however, it hardly ever occurs, and, therefore, a suitable methodology must be used that guarantees that the term SB is equal to zero.
One of the methods used to minimize the selection bias, mainly when the selection of participants in a certain action/policy/program is not random,2 is the Propensity Score Matching (PSM). Therefore, two groups are needed: the treatment one and the control one. The former comprises the individuals (municipalities -in this study) that had a decrease in the GDP according to the assumptions listed above, while the latter gathers those that did not have a GDP fall.
The difficulty of measuring the effects of the GDP fall between these two groups ends in the distinction of the existing characteristics between them (such as physical and human capital, population growth rate, etc.). These characteristics might determine the difference in the variable of interest. In fact, Cavalcanti et al. (2016) inferred that the ideal evaluation of the impact of any specific action would be the comparison within the same group in two contexts: participating in an action or not. However, since this is not possible, the alternative is the creation of a statistically identical group, so that the differential is only based on the fact of participating in a specific action or not.
The PSM method allows this comparison, finding the similar ones within the groups of municipalities that presented GDP fall (treatment group, T=1) and those that did not present this fall (control group, T=0). This propensity is generated from the observable characteristics of the municipalities, which affect their likelihood of having a decrease in the GDP. Therefore, the participation of the municipalities in the group that presented GDP decrease or not becomes random (Heinrich et al., 2010). In this research, the characteristics (called covariates) used for this matching were3 the following: region (South, Southeast and Center-West were ascribed a value equal to 1 and the remaining regions received the value 04), demographic density (population per square kilometer), physical capital (total industrial facilities) and human capital (mean years of education/schooling of formal workers). The determination of such variables followed the work that applied the model proposed by Mankiw et al. (1992), aiming to identify the economic growth determining factors.
It seems relevant to emphasize that when seeking those that are similar when there are different characteristics listed, it is possible to incur in the multidimensionality problem, that is, municipality i might have some characteristics close to municipality j and others close to municipality m. In this case, it would be difficult to establish which municipality to compare i with. As pointed out by Rosenbaum and Rubin (1983), PSM minimizes this problem, calculating the probability of a municipality receiving the treatment taking into consideration its observable characteristics (covariates). In this study, probability was measured using the Logit model (6), with matching based on the assumption of conditional independence. As a consequence, the difference between the averages of the covariates in the treatment and control groups cannot be statistically different from zero.
Where: P(Ti =1|Xi ) denotes the probability of the municipality presenting GDP fall (in the first model -1% or over; in the second model, -2% or over; in the third, -3% or over; in the fourth, -4% or over; in the fifth, -5% or over) considering their covariates.
1.2. Empirical Strategy
Chart 1 summarizes the data used to calculate the Propensity Score Matching (PSM). It seems relevant to mention that only municipalities that presented all the information needed were considered, that is, 5319 municipalities. Basically, three variables of results were included (criminality variation, mortality due to preventable causes variation, poverty variation) to be analyzed regarding five sceneries: GDP fall of 1% or over; 2% or over; 3% or over; 4% or over, and 5% or over. Also, for each scenery, the value ascribed to municipalities with GDP fall in 2015 was ‘one’, while municipalities that did not present that fall were ascribed ‘zero’. In addition, for each scenery, the estimates of impact for all Brazilian municipalities were carried out, considering small ones (0 to 50 thousand inhabitants), medium-sized (50 to 100 inhabitants) and large ones (over 200 inhabitants). Therefore, the study totalled 60 PSM estimates.
Before the PSM result presentation, a spatial panel model was estimated for the variables poverty and criminality, and a traditional panel for mortality.5 The objective was to verify the correlation between the social variables and the GDP variation, considering the whole recession period, 2012-2017. It seems relevant to highlight that this exercise was only an initial test, without deep investigation of the impact of the GDP fall on social aspects, only presenting a general overview, with initial inferences. The control variables included in each model followed the literature in each area and the results are shown in Appendix 1.
2. Results and Discussions
The current existing debate in Brazil refers to the economic crisis that the country might face due to the need for social distancing to minimize the Covid-19 impacts on population health. Going beyond such discussion, this study focused on the possible effect that an expressive fall in the GDP (allegedly resulting from the social distancing) would cause on some social variables. With this purpose, the year 2015 was analyzed, since it was the year that presented the greatest GDP fall since the 1990s.
Brazil is the fifth country in the world regarding the extension of its territory (8,511,000 km²). For this reason, there is great heterogeneity all over its space, with differentiated productive structures, poverty levels, and great income inequalities. This makes the economic dynamics vary from place to place.
Table 1 shows the average GDP per capita between Brazilian municipalities, where great discrepancy is observed, with some municipalities showing an average value of US$ 99,440, while others reached only US$ 640. When considering the size of the municipalities, many inequalities are also verified, since municipalities with smaller populations presented a GDP per capita lower than that of the municipalities that were more densely populated. In fact, theoretically, the workforce is attracted to spaces that present more employment opportunities, corresponding to places with more consolidated productive structures (Krugman, 1991), which justifies the concentration of population in municipalities with higher GDP per capita.
Table 1 Variables, Source and Year - PSM and Logit Models
| Variables | Proxy | Source | Year |
| Actual GDP variation | Economic Growth | Ipeadata | 2015 |
| Robbery variation per thousand inhabitants | Criminality (property crime) | State Safety Secretariats1 | 2015 |
| Mortality due to preventable causes variation (population over 5 years old) per thousand inhabitants | Preventable deaths | Datasus | 2015 |
| Number of people in the Single Register variation, per thousand inhabitants2 | Poverty | MDS | 2015 |
| Industrial facilities per capita | Physical capital | Rais | Average 2010 to 2014 |
| Formal worker average schooling | Human capital | RAIS | Average 2010 to 2014 |
| Population growth rate | Population growth | IBGE | Average 2010 to 2014 |
| Population per square kilometer | Demographic density | IBGE | Average 2010 to 2014 |
| Region (1 for South/Southeast/Center-West and 0 for all the others) | More developed regions regarding productive structure | IBGE | Average 2010 to 2014 |
1 It seems relevant to emphasize that these data do not exist in the official data bases of the country. Thus, for two years, correspondence was sent asking for information to all Brazilian states with the purpose of investigating determining factors of criminality in Brazil, since this project is funded by the National Council for Technological and Scientific Development. Twenty-four states and the Federal District provided the project with this information, only the state of Pará did not send it (never replied to the correspondence) and Paraíba that informed not having such information.
2 The Single Register is a set of information about Brazilian households that are in a situation of poverty or extreme poverty. This information is used by the federal government, states, and municipalities to implement public policies able to promote some improvement in the life conditions of these families.
Source: Research result.
When the Annual Social Information List, RAIS (2020) and the Brazilian Institute of Geography and Statistics, IBGE (2020) data were surveyed, respectively, regarding the proportion of workers in relation to the population and the number of retirees/pensioners per capita, 20% of the Brazilian municipalities were seen to have a higher proportion of retirees/pensioners than formal workers in 2015. If the number of Bolsa Família (a type of monthly allowance paid by the government to poor families) beneficiaries is added to that of the retirees/pensioners, the proportion increases to 22% of the municipalities. This means that in a quarter of the Brazilian municipalities the economy dynamics does not result mainly from the productive activity, but rather from income transfer and pensions paid by the public social security system, which confirms the inferences regarding productive concentration in some spaces of the country, highlighting that such municipalities are mostly small cities in the regions North/Northeast.
Regionally, the difference between North and Northeast and the South, Southeast and Center-West of the country (Table 2) is clear. It seems relevant to emphasize that up to the 1970s the industry was mainly located in the Southeast region, mostly in the state of São Paulo, where 58% of the production was concentrated. In the following decades, a decentralization process occurred, with industrialization gains to the South, mainly due to its proximity to the Mercosul and for having a competitive agriculture and livestock production (Cano, 1998). Regarding the Center-West region, the expansion of the agricultural borders privileged it, gaining a special dynamism resulting from the productive chain of agriculture and livestock production.
Table 2 GDP per Capita Descriptive Statistics - Municipalities - 2015 (US$ of 2020)
| Municipalities | Average | Maximum | Minimum |
Total municipalities |
|
| All municipalities | 3.86 | 99.44 | 0.64 | 5319 | |
| Size of the municipalities |
Small | 3.67 | 99.44 | 0.64 | 4694 |
| Medium | 4.89 | 55.70 | 0.92 | 486 | |
| Large | 6.79 | 35.50 | 2.10 | 139 | |
| Regions | North | 2.70 | 21.44 | 0.91 | 426 |
| Northeast | 1.90 | 44.96 | 0.64 | 1569 | |
| Center-West | 5.37 | 47.19 | 1.48 | 466 | |
| Southeast | 4.40 | 99.44 | 0.98 | 1668 | |
| South | 5.53 | 52.07 | 1.88 | 1190 | |
Source: Ipeadata (2020).
Therefore, the productive dynamics is seen to benefit these regions, generating inequalities regarding the economic growth distribution all over the country. And, in this sense, a recession like the one that occurred in 2015 is not expected to affect all the spaces equally.
In fact, when the average GDP growth is considered between the municipalities in the country (Table 3), the previous data presented is confirmed, identifying expressive heterogeneity in the productive process between the Brazilian municipalities. The size analysis indicates that those with lower population density were the ones that suffered the least with the 2015 recession, and the regions peripheral to the productive activity (North/Northeast) were also less impacted.
Table 3 Economic Growth Rate Descriptive Statistics - Municipalities - 2015 (%)
| Municipalities | Average | Maximum | Minimum |
Total municipalities |
|
| All municipalities | 0.35 | 784.41 | -82.01 | 5319 | |
| Size of the municipalities |
Small | 0.66 | 784.41 | -82.01 | 4694 |
| Medium | -1.69 | 55.41 | -43.70 | 486 | |
| Large | -2.96 | 52.02 | -44.87 | 139 | |
| Regions | North | 2.07 | 167.95 | -50.24 | 426 |
| Northeast | 1.20 | 346.90 | -82.01 | 1569 | |
| Center-West | 1.31 | 96.11 | -30.33 | 466 | |
| Southeast | -1.57 | 784.41 | -71.86 | 1668 | |
| South | 0.91 | 360.32 | -51.51 | 1190 | |
Source: Ipeadata (2020).
This means that the municipalities that suffered the most with the 2015 recession in Brazil were those with a better productive structure, that is, those presenting higher GDP per capita.
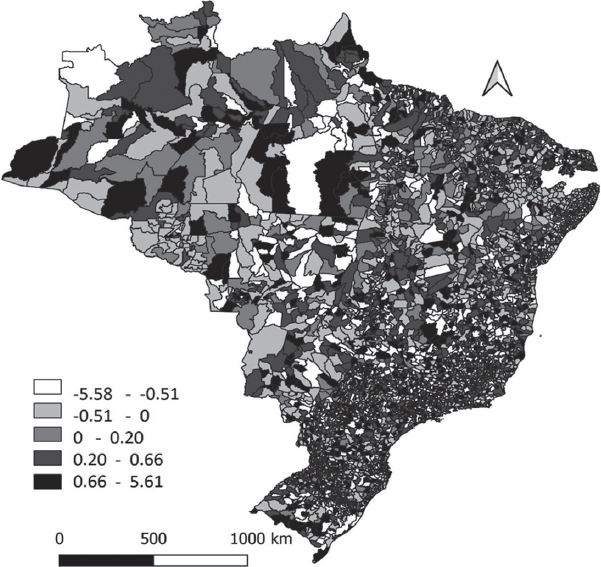
Spatially, Figure 1 shows the distribution of municipalities that had GDP fall of 1% or over, 2% or over, 3% or over, 4% or over and 5% or over, corresponding respectively to 2547, 2238, 1922, 1627 and 1377 municipalities. Therefore, less than a half of the Brazilian municipalities presented a GDP fall, and those were responsible for the 2015 recession. As, in general, the productive structure in Brazil is concentrated in those spaces, they are the ones more likely to present greater economic losses with the Covid-19 crisis. The issue to be considered is: Did the municipalities that were most affected by the 2015 recession present worsened social aspects when compared to the other Brazilian spaces?
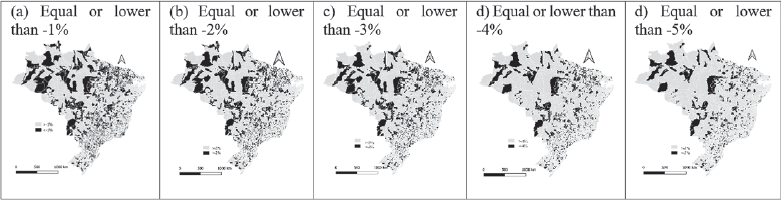
* It seems relevant to mention that some social information from the states of Pará and Paraíba is missing, for this reason they were removed from the analysis, not appearing in Figure 1.
Source: Ipeadata (2020).
Figure 1 GDP Fall - Brazilian Municipalities* - 2015
3.1. Impact of the GDP Fall on Some Social Variables: 2015 Recession
When there is a retraction in the economic growth, theoretically, the worsening of some social aspects is expected. This idea is included in the concept of socioeconomic development, with the assumption that the economic dynamics increase provokes structural alteration, triggering positive effects on different social dimensions (Sant’Ana, 2008). Simultaneously, when an economic crisis occurs, the society’s welfare is also expected to be weakened.
However, this is not an empirical rule. In the 1960s/1970s, when Brazil experienced its ‘economic miracle’ and achieved the greatest economic growth in its history, it did not necessarily mean social advances, on the contrary, it was one of the periods in which income became most concentrated in the country, without any reduction in poverty levels. Some factors help to explain these results: high concentration of the productive activity, mainly with international oligopolies; lack of a productive chain of domestic activities with income leakage abroad; high concentration of income in the job market; in addition to the measures implemented to stop inflation, which reduced the workers’ purchase power, etc.
Thus, even if Brazil faces a serious recession (as the one in 2015), not all municipalities will be affected in their social aspects, due to the possible absence of economic dynamics a priori.
For this reason, some social variables were investigated. Robbery per capita was the first analysis. Public safety is one of the main bottlenecks in the country. In a study developed by Gallup (2018), aiming to measure the population’s perception of insecurity, Brazil got the 138th position in a list containing 142 countries. That is, the public safety in the country is one of the worst in the world.
During 2015, approximately 53% of the municipalities increased the number of robberies per capita, with a 0.24 average. When the group of municipalities that had GDP fall is compared to the group of municipalities that presented economic growth, both had increases in criminality in 2015. However, the average variation was smaller for the latter. Regarding the size of the municipalities, only the group of large cities obtained negative variation in robbery per capita, from which those that did not face recession showed greater decrease in criminality (Table 4). Thus, through this initial data, we got to the conclusion that the increase in criminality was higher in municipalities that faced recession in 2015.
Table 4 Robbery Variation Average per Capita - Brazilian Municipalities - 2015
| Municipalities | All | Large | Medium | Small |
| That presented GDP fall | 0.27 | -0.004 | 0.62 | 0.16 |
| That presented GDP growth | 0.20 | -0.45 | 0.57 | 0.09 |
Source: Public Safety State Secretariats, with organized research data.
The United Nations Office on Drugs and Crime, UNODC (2012) document confirmed this result. In fact, when observing fifteen countries during the 2008-2009 recession, a criminality increase was identified with twice as many robberies occurring in that period. The document concluded that out of the eleven countries experiencing recession, eight presented some relation between criminality and economic activity.
Moreover, when comparing Figure 1 (GDP fall) to Figure 2 (robbery variation per capita), certain spatial similarity can be observed, in which many of the municipalities with GDP loss showed greater variations in robbery per capita. When an econometric exercise was carried out with data from 2012 to 2017, testing the effect of GDP variation on the robbery variation per capita, a negative effect was identified (Appendix 1), confirming that the smaller the GDP growth is, the greater the criminality variation tends to be.
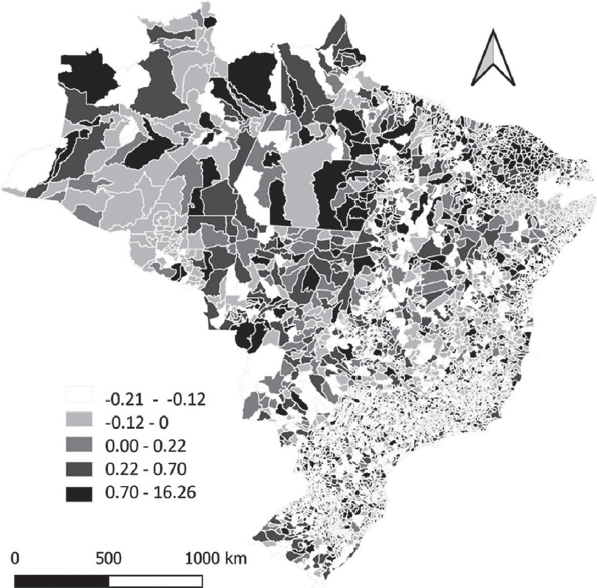
Source: State Safety Secretariats, with research data.
Figure 2 Robbery Variation per Capita - Brazilian Municipalities - 2015
To obtain more robust analyses, the impact of the GDP fall on criminality was investigated using PSM, considering 5 scenarios: 1% decrease or over, 2% decrease or over, 3% decrease or over, 4% decrease or over, and 5% decrease or over. In this type of investigation, similar municipalities are compared, that is, those that showed economic fall with others that had GDP growth, but that had similar characteristics regarding human capital, physical capital, population, demographic density and region. Therefore, ‘pseudo-equals’ are compared, among which the only existing difference is the GDP variation.
As a result, the sharp GDP fall in 2015 was observed, on average, to affect more seriously the criminality in municipalities that faced recession (treatment) than those that showed GDP growth (control). However, when analyzing population concentration, the result found is that municipalities classified as medium-sized did not present differentiated impact (Table 5).
Table 5 GDP Fall Mean Effect (Me) on the Robbery Variation per Capita - Brazilian Municipalities - 2015
| Fall | All municipalities | Large | Medium | Small | ||||
| ME | Z | ME | Z | ME | Z | ME | Z | |
| -1% | 0.06 | 1.74** | 0.22 | 0.44 | 0.07 | 0.43 | 0.50 | 2.34* |
| -2% | 0.09 | 2.52* | 0.09 | 0.17 | 0.0001 | 0.0001 | 0.08 | 2.31* |
| -3% | 0.13 | 3.37* | 0.81 | 1.69** | 0.015 | 0.09 | 0.08 | 1.74** |
| -4% | 0.10 | 2.43* | 0.71 | 1.62** | 0.12 | 0.78 | 0.06 | 1.56 |
| -5% | 0.08 | 1.85** | 0.78 | 1.68** | 0.14 | 0.80 | 0.04 | 1.11 |
Source: Authors’ estimates with organized research data.
Note: (*) statistically significant at 5%; (**) statistically significant at 10%.
This does not mean that they did not have an increase in criminality, but rather that the robbery variation per capita between the treatment and control groups was statistically the same. As for small municipalities, both groups showed intensification of criminality as shown in Table 3; however, those with negative GDP growth had the criminality intensified. When large municipalities were analyzed, Table 3 shows that the average criminality decreased, but they also showed statistically significant differences between the treatment and control groups, which indicates that both groups decreased average criminality. However, those that presented GDP loss over 3%, observed less reduction in criminality (Table 5).
Finally, these results point out the fact that small and large municipalities that had their GDP reduced experienced a negative impact on criminality, while, in medium-sized municipalities, the GDP fall did not make any difference, especially because those spaces already presented an increase in public safety, resulting from the concentration of the productive activity there in the last few years.
The second variable analyzed corresponded to the poverty in the Brazilian population. According to IBGE (2019) data, the percentage of people classified as poor was 27% in 2015, which posed a great social problem to be faced. When using the number of people listed in the Single Register (CadÚnico) as a proxy for poverty, 15% of the municipalities were observed to vary positively the percentage of this insertion, intensifying local poverty (Table 6). However, when the average of this variation is obtained, a negative value is found (-21.02), demonstrating that, in general, individual deprivation decreased when all Brazilian municipalities were considered. And this reduction was higher especially in small municipalities, which are spaces that tend to concentrate more poverty in the country, which is extremely important.
Table 6 CadÚnico Register Variation per Thousand Inhabitants - Brazilian Municipalities - 2015
| Municipalities |
CAdÚnico increase percentage |
Variation average | |
|
Municipalities with GDP fall |
Municipalities with GDP growth |
||
| Small | 17% | -22.4 | -22.6 |
| Medium | 20% | -13.2 | -11.7 |
| Large | 23% | -9.92 | -10.07 |
| All | 19% | -20.91 | -22.16 |
Source: MDS (2020), with organized research data.
Therefore, even if Brazil was going through one of the biggest economic crises of those times, there was a reduction in the average variation of CadÚnico registers per thousand inhabitants. In fact, when comparing Figure 1 (GDP fall) to Figure 3 (CadÚnico variation per thousand inhabitants), we did not necessarily find similarity, since many of the municipalities that had GDP fall also presented a decrease in the CadÚnico register (and vice versa). This absence of correlation is confirmed with the estimates presented in Appendix 1, in which the coefficient referring to the GDP variations was not statistically significant regarding poverty variation.
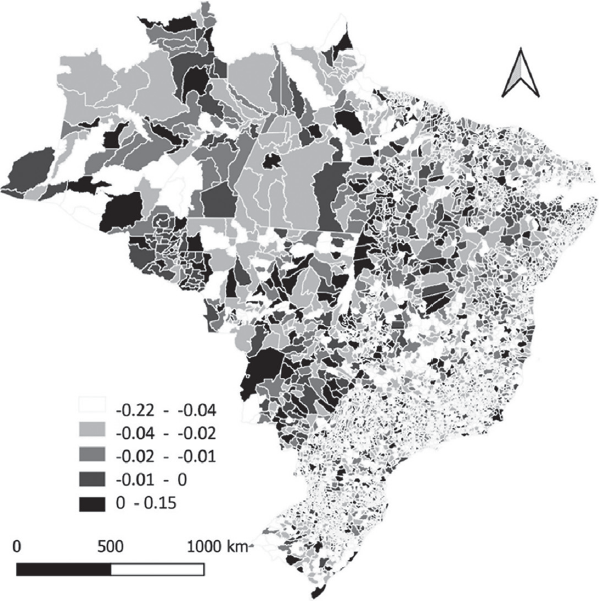
Source: MDS (2020), with organized research data.
Figure 3 CadÚnico Register Variation per Thousand Inhabitants - Brazilian Municipalities - 2015
In fact, Prates et al. (2016) analyzed the industrial decentralization in Brazilian municipalities and observed that the ten municipalities with the highest GDP were responsible for about 30% of the Brazilian industrial production in 2010, confirming the absence of productive activity in large areas of the country.
In a more specific investigation, when comparing municipalities with similar characteristics (Table 7), no difference was found in terms of CadÚnico variation between the municipalities that had economic growth and those which presented GDP fall. Therefore, the 2015 recession did not necessarily significantly impact the existing poverty.
Table 7 Mean Effect (Me) of the Gdp Fall on the Number of People in the Single Register per Thousand Inhabitants Variation - 2015
| Fall | All municipalities | Large | Medium | Small | ||||
| ME | Z | ME | Z | ME | Z | ME | Z | |
| -1% | 0.6 | 0.88 | 0.003 | 0.93 | -0.001 | -0.64 | 0.0002 | 0.28 |
| -2% | 0.9 | 1.24 | 0.004 | 1.53 | 0.0001 | 0.10 | -0.00002 | -0.02 |
| -3% | 0.8 | 0.99 | 0.005 | 1.70 | -0.001 | -0.76 | 0.0004 | 0.46 |
| -4% | 0.4 | 0.47 | 0.002 | 0.65 | 0.001 | 0.85 | 0.0005 | 0.52 |
| -5% | 0.2 | 0.27 | 0.0003 | 0.11 | 0.0009 | 0.44 | -0.001 | 1.19 |
Source: Authors’ estimates with research data.
Note: Statistically significant at 5%.
This might have resulted from the lack of productive activity in part of the Brazilian municipalities, since 22% of the municipalities had their economy based on retirement/pensions and income transfers. In fact, when correlating the 2015 GDP per capita with the number of individuals registered in the CadÚnico register per capita, the correlation found was -0.45, that is, the places with more people registered in the CadÚnico that is per inhabitants, on average, were those municipalities that had lower GDP that is to say per capita. For this reason, the poverty variation was not so significant, because those locals where poverty was more concentrated were spaces that lacked productive activity.
The last social variable investigated was the variation in the number of preventable deaths per thousand inhabitants. The objective was to identify whether the economic difficulties affected the access to the health infrastructure, resulting in deaths that could have been prevented if correctly treated. Table 8 shows that over a half of the municipalities had an increase in mortality per thousand inhabitants in 2015, with greater variation in small and medium-sized municipalities.
Table 8 Mortality Due to Preventable Causes Variation per Thousand Inhabitants - Brazilian Municipalities - 2015
| Municipalities |
CAdÚnico increase percentage |
Variation average | |
|
Municipalities with GDP fall |
Municipalities with GDP growth |
||
| Small | 51.6% | 0.07 | 0.09 |
| Medium | 61.5% | 0.08 | 0.09 |
| Large | 61.1% | 0.03 | 0.06 |
| All | 52.7% | 0.07 | 0.09 |
Source: MDS (2020), with organized research data.
When correlating this mortality variation with the GDP dynamics, no statistical significance was identified, that is, the GDP fall did not necessarily raise the variation of the mortality due to preventable causes (Appendix 1).
The same evidence was found when comparing Figure 1 (GDP variation) to Figure 4 (mortality variation per thousand inhabitants), showing several spaces that had an increase in mortality, but, not necessarily with economic retraction. Also, even the spatial distribution of the mortality variation was random (Moran’s I6 not statistically significant), different from the GDP variation, that presented a spatial distribution pattern, and such pattern was observed to follow a concentrating pattern (Moran’s I positive and statistically significant).
Source: DATASUS (2020), with organized research data.
Figure 4 Mortality Due to Preventable Causes Variation per Thousand Inhabitants - Brazilian Municipalities - 2015
For a robust analysis, the municipalities that had an expressive GDP fall were compared to those that improved their economy, matching them according to their similarities. Actually, the previous inferences were confirmed, since no statistical difference was found regarding the mortality variation between municipalities that were impacted negatively by the crisis and those that were not (Table 9). It seems relevant to emphasize that both groups presented, on average, an increase in mortality rates, but this positive variation resulted from other factors (according to Appendix 1) that were not related to the existing economic dynamism.
Table 9 Mean Effect (Me) of the Gdp Fall on the Mortality Due to Preventable Causes Variation per Thousand Inhabitants - 2015
| Fall | All municipalities | Large | Medium | Small | ||||
| ME | Z | ME | Z | ME | Z | ME | Z | |
| -1% | -0.007 | -0.25 | 0.06 | 0.49 | 0.00005 | 1.52 | 0.008 | 0.23 |
| -2% | 0.023 | 0.75 | 0.02 | 0.62 | 0.00003 | 0.81 | 0.02 | 0.53 |
| -3% | 0.026 | 0.85 | 0.006 | 0.20 | 0.00002 | 0.58 | 0.03 | 0.87 |
| -4% | 0.014 | 0.45 | 0.01 | 0.45 | 0.00002 | 0.46 | 0.03 | 0.81 |
| -5% | 0.004 | 0.12 | 0.03 | 0.62 | 0.00004 | 1.20 | -0.02 | -0.53 |
Source: Authors’ estimates with research data.
Note: Statistically significant at 5%.
Moreover, the health, physical and human structures do not change instantly, it is a process that occurs along time, which might justify the absence of recession effects on preventable deaths in 2015.
Conclusions
The Covid-19 crisis has provoked not only a health crisis in Brazil, with a huge number of deaths, but also, a political and economic crisis that results mainly from the dilemma installed in the country regarding the ‘social distancing measures needed to save lives’ and ‘their economic costs’.
Going beyond this debate, which is relevant, but is not the focus of this paper, we sought to investigate whether the maintenance of social isolation, with its potential effect on the economy, would impact social aspects, as it is commonly alleged by the defenders of the ‘return to normality’ in the country.
As a result, after analyzing a recent period of recession in the country, this study identified that not all municipalities will necessarily suffer such economic impact, due to the differences in terms of productive activity concentration. However, even when comparing municipalities with similar economic characteristics, no difference was found regarding the GDP fall impact on mortality or poverty, only on criminality.
Since robbery is an action that has direct relation with economic opportunities and its concentration responds to the current economic environment, its increase is justified when there is a decrease in the economic dynamics. However, other variables investigated presented other elements that influenced them in the short term, and economy was not their main determinant. Maybe, in the medium and long term, if the economic dynamics loss is extended, these variables might be impacted (deteriorating the health structure, impacting income transfer programs and the country’s security system, etc.), but in the short term no significant differences were found between the municipalities that were affected by the 2015 crisis and those that were not.
These results showed evidence that the potential economic crisis generated domestically by the Covid-19 tends to affect the life of the population, however, it is not the only factor responsible for negative changes in the social aspects that might occur in Brazil.
This focus on the effect of the economic crisis on social aspects is the main contribution of this paper to the literature, which in general analyzes only the economic effects of a recession.
However, the results obtained when analyzing the 2015 crisis might not be the same as those observed in the crisis the country has been facing currently, mainly due to the nature of the recession, which is different, which is also one of the limitations of this study. However, even having different origins, it is possible to foresee some trends based on previous observations.
It seems also relevant to emphasize that the country had already been facing an economic crisis period (with fiscal deficit) before the pandemic outbreak, which along with the growing crisis (resulting from the high debts with subsequent payment of interests), might worsen the economic situation and, for example, affect criminality rates negatively. Therefore, further studies should evaluate not only the direct effect of the pandemic on social aspects, but also the country’s ex ante situation in their analyses. Also, further research should focus directly on the impact of the Covid-19 crisis on the social dynamics of Brazilian municipalities, aiming to confirm the results obtained when investigating the 2015 crisis.

