nova página do texto(beta)
 Inglês (pdf)
 Artigo em XML
 Referências do artigo
 Enviar este artigo por email
 Citado por SciELO
  Similares em
SciELO
Similares em
SciELO 
 Permalink
Introduction
The decrease of informal market in the last decade can be considered one of the main changes in Brazilian economy. After decades (1980s -1990s) in which informal labor grew consistently, reaching a very high level, the last decade it witnessed the reverse process. The figures (National Household Survey - PNAD) evidence the change very clearly: the proportion of employed people in the informal sector decreased from 55.1% in 2001 to 48.7% in 2009, with a fall of 6.4 percentage points.
Researches on this change are necessary for providing to decision makers with public policies evidences of the ways to reduce further informality. In fact, high levels of informality make difficult to access goods and services restricted to formal workers, promote unequal competition in the product market, and generate adverse macroeconomic impacts on pension and tax collection.
This paper aims to evidence the characteristics of individuals that affect more the transition from informal to formal sector. The initial hypotheses are that the characteristics linked to the level of education of an individual are the most important in explaining this transition. To achieve this purpose, we utilize parametric and non-parametric survival analysis. Through the hazard function it is possible to investigate what factors affect the risk of occurrence of the event, i.e., individuals leave the state of informality to reach formality. For this, we use the data from the Monthly Employment Survey (PME) from January 2004 to December 2013. PME surveys the Metropolitan Regions of Rio de Janeiro, São Paulo, Porto Alegre, Belo Horizonte, Recife, and Salvador; which are the six biggest metropolitan areas of Brazil in terms of population according to Brazilian Census in 2000. Two metropolitan regions of this survey, Recife and Salvador, are situated in the North-East of Brazil; three, Rio de Janeiro, São Paulo and Belo Horizonte, in the Southeast macroregion; and one, Porto Alegre, in the South of the country. In this paper, formality and informality are considered only at the level of workers, not contemplating entrepreneurs, that is, formal workers are employees with formal contract (signed work booklet) and informal workers are employees without formal contract. A traditional classification in the Brazilian literature classifies as informal workers those who do not have a signed work booklet. To have signed a work booklet means to be registered as an employee and to have the certainty of certain right, including category minimum wage, paid vacation, guarantee fund, weekly rest, guaranteed income for the worker and his family in times of incapacity to work caused by illness, accident, and pregnancy.
The essay is divided into four sections, excluding introduction and conclusions: in the first section, data of recent decrease of Brazilian informality are presented; in the second section, other researches about the topic are evidenced through a literature review; in the third section, parametric and non-parametric models of duration are explained from a theoretical point of view, along with the database; in the fourth section, the results of duration analysis are showed and commented.
1. Evidences of recent decrease in Brazilian informality
Brazilian Federal Constitution of 1988 allowed considerable progress in formalization of society in the 1980s; examples of this are the incorporation of the rural social security system and the creation of a universal Social Security. However, this process of formalization of society was interrupted in the successive decade. In fact, in the 1990s, the confluence of technological, productive, and financial changes worldwide, in addition to deregulation and weakening of institutions that structured working relationships, pressured the labour market towards a relative reduction of formalization. Beyond this, we can add the deep economic crisis due to hyperinflation that struck Brazil in that decade. It was only in the 2000’s that this trend in the labour market was reversed in a context of economic growth, social policy redesign, and restructure the state's ability to develop public policy in society (Instituto de Pesquisa Economica Aplicada, 2011).
As we can see in Figure 1, the proportion of workers employed informally changed from 57.39% in 2002 to 44.38% in 2012, with a fall of 13.01 percentage points in ten years. The drop is more relevant if we compare it with the previous period (1992-2001) where this ratio was constant or increased depending on the year in question.
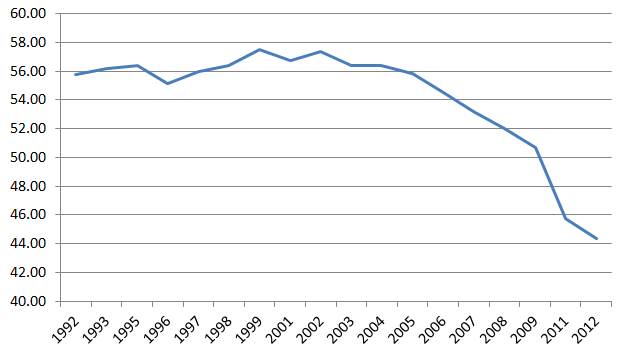
Source: own elaboration - Pesquisa nacional por amostra de domicílios IBGE (1992-2012).
Figure 1 Proportion of informal workers (%)
Considering a demographic analysis of this change, we can analyse the data relative to sex. Data from Figure 2 show that, in relative terms, the increase of formalization was higher among women in the last years. Informal jobs among men passed from 56.45% in 2002 to 43.85% in 2012 (decrease of 12.60 percentage points), against a change from 58.73% to 45.09% among women (decrease of 13.64 percentage points). We can also observe that from 1992 to 2012 the gap of informality between men and women is narrowing: in the period 1992-1995 the gap was around 6-7 percentage points, while in the period 1996-2009 it was stable at 2-3 percentage points and, finally, in 2011-2012 dropped to one percentage point.

Source: own elaboration - Pesquisa nacional por amostra de domicílios IBGE (1992-2012).
Figure 2 Proportion of informal workers by sex (%)
Regarding ethnicity (Figure 3), the greatest advances in formalization occurred among those whose proportion of informal workers came from a higher level, namely blacks, browns, and Amerindians. For these ethnicities, the percentage of informal workers decreased between 2002 and 2012 from 64.68 to 50.27, totalizing a difference of 14.41 percentage points. The fall in informality is less pronounced when we consider white and yellow workers in the same period: they passed from 50.28% in 2002 to 36.96% in 2012, reducing informality by 13.32 percentage points. We have to point out that in this case the fall of informality among the categories is less pronounced than in the case of sex.

Source: own elaboration - Pesquisa nacional por amostra de domicílios IBGE (1992-2012).
Figure 3 Proportion of informal workers by ethnicity (%)
Regarding the years of study, the data in Table 1 show that formalization was increasing with schooling among workers.
Table 1 Proportion of informal workers by level study completed (%)

Source: own elaboration - Pesquisa nacional por amostra de domicílios IBGE (1992-2012).
In each year, informality is decreasing according to the level of education reached by the worker. The difference between the first category, illiterate, and the last one, higher education, is very significant: the average difference in all years is around 65 percentage points. The probable effect of education on recent reduction of informality can be observed only in the period 2006 - 2012. In fact, in that period, we can see a reduction of informality by around 7 percentage points among workers with elementary and primary education, by around 5 percentage points among workers with secondary education and by 2 percentage points among workers with higher education.
It is also interesting to evidence that informality increased in the higher levels of study. This fact can be explained by the presence of elements of heterogeneity in these levels of schooling. For instance, Valdivia-López & Pedrero-Nieto (2011) evidence that experience can play an important role in the dynamics of heterogeneity within the same level of education, affecting wage premium in their study, while informality in this paper.
2. Literature review
The International Labour Organization (ILO 2014) affirms that the first step towards designing effective policies to enable transitions to formality is to identify the heterogeneity of the informal economy, the different categories of workers involved, and the drivers that are leading to the growth of the informal economy. Workers in the informal economy differ widely in terms of income, basic characteristics (sex, age), status in employment (employees, employers, own-account workers), sector (trade, agriculture, industry), type and size of enterprise, and location (urban or rural).
ILO (2014) tries to explain also the large presence of women in the informal sector. Part of the explanation lies in unequal burden of unpaid family duties that are given to women. In every society, the fact that women tend to spend more hours in unpaid work than men limits their choices about labour market participation, working hours and the place of their work. The informal economy may be the only way for women combining paid work with family responsibilities, given the sufficient flexibility and autonomy of this sector.
On the same topic, Cacciamali & José-Silva (2003) evidence that an important feature of the Brazilian labour market is the unequal distribution of unemployment and precarious occupations, leading to the fact that youth and women are among the most affected by these two situations.
Gonzalez-de-la-Rocha (1994) justifies the attractiveness of the informal sector for older workers arguing that they have incentives to migrate voluntarily for this sector, due to the fact that they are older and less educated. The lack of skills, the desire to leave the competitive and stressful position of employee, and even the opportunity to obtain higher income than in the formal sector, since their personal characteristics interfere negatively on wages, are factors that influence these individuals to be inserted as informal, mostly as entrepreneurs.
With regard to the education of informal workers, there is a large consensus in Brazilian literature (Barros, Mello & Pero, 1993; Cacciamali & Fernandes, 1993; Neri, 2002) that they have, on average, fewer years of schooling than formal employees.
On the same topic, Carneiro & Henley (2001) explain that the return to education is lower among informal workers.
However, Curi & Menezes-Filho (2004) have a contrary opinion about what the literature affirms with regard to the qualifications of workers in informal sectors. When analysing the evolution of the Brazilian urban labour market during the 1990s, it was observed that there was an increase in informality in all levels of education, particularly among the highest.
In their work, Carneiro & Henley (2001) calculate also the probability of working in the formality: it is inferior for women, white, unionized, and urban workers. Moreover, they study the level of salaries and education in the formal and the informal sector. They conclude that the average wages between workers of the two markets are similar, though informal workers have less access to secondary and superior education.
Furthermore, considering the sectors of the economy, they affirm that construction and services are those that encourage informality, while administrative, industry, transport, and communications are those in which informal work is less present.
The literature about transition between formal and informal sector is also interesting. For Mexico, Maloney (1999), through transition matrices and a multinomial logit model show that the transition of workers from the formal to the informal sector is as likely as the transition in reverse. For Brazil, Barros et al. (1990) do a similar job for the Metropolitan Region of São Paulo, and show that 9% of workers has transited between formality and informality in one year, and that about 50% of workers employed without a formal contract will be in the formal sector in the next year.
Neri (2002), in turn, with a transition matrix with data from the Monthly Employment Survey (PME) for the years between 1982 and 1997, shows that the probability of exit from one job in the informal sector and going to one in the formal sector is almost the same that for the formal sector.
3. Empirical methodology and database
3.1 Parametric models of duration
Econometric models of duration are models regarding the length of time spent in a given state before transition to another state.
The duration models (also called models of survival analysis) can be utilized in several studies in economics, most of them refer to the time of transition from the state of unemployment to employment.
Generally, the duration models are commonly used in two types of analysis: (i) estimating the probability of the event to continue as it has lasted until a determined time or (ii) estimating the probability that the event ends in the next period, given that it lasted until the current period (Lancaster, 1979). For analysing the transition from informality to formality and the factors that affect this change, this paper utilizes the second approach.
The survival function, a complementary concept to the cumulative distribution function (cdf), is the probability that duration equals or exceeds t, which is defined by:
 (1)
(1)
where T denotes duration in a state and is a nonnegative random variable.
Another key concept is the hazard function, which is the instantaneous probability of leaving a state conditional on survival to time t. This is defined as:
 (2)
(2)
In regression analysis of transitions the conditional hazard rate,  , is of fundamental interest. Through the conditional hazard rate is possible to investigate what factors affect the risk of occurrence of the event. Therefore, hazard function is conditioned by the vector of observable explanatory variables, because it is considered that the condition in the labour market is affected by a vector of variables that represent the characteristics of individuals, such as level of education, race, region of residence, sex, among others.
In regression analysis of transitions, it is necessary to specify a probability distribution for the failure time on the hazard function. The probability distributions that are used in this type of analysis are exponential, Weibull, log-normal, log-logistic, Gompertz, and the generalized gamma.
Moreover, since workers may be clustered by unobserved heterogeneity (motivation, ability, among others), the estimated parameters may be inefficient, if not, consider unobserved heterogeneity (Heckman & Singer, 1984). A survival model with unobservable heterogeneity is called frailty model. At the observation level, frailty is introduced as an unobservable multiplicative effect, ξ, on the hazard function, such that
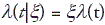 (3)
(3)
where λ(t) is a non-frailty hazard function, say, the hazard function of any of the six parametric models supported by a survival analysis. The frailty, ξ, is a random positive quantity and is assumed to have mean 1 and variance θ. A way to control the effect of unobserved variables is the use of survival model with Gamma or Inverse-Gaussian correction.
Finally, in this analysis, we have also considered censoring. Censoring means that the events occurred at some time when the subject was not under observation.
In the left censoring, the failure event occurs prior to the subject entering in the study. For example, an individual who is employed in formal sector when interviewed is considered left censored, because the transition from informality to formality happened prior to the beginning of the follow-up period.
In right censoring, the study is run for a specified length of time and by the end of that time, some individuals have not yet experimented the failure event.
Given the presence of both types of censoring, the present paper develops an analysis taking into account censoring.
3.2 Non-parametric methodology
It is often useful to know the shape of the unconditional hazard or survival function before considering the analysis with regressors.
Non-parametric methodology allows a quick diagnosis of the form of the survival function and comparisons between groups, which may assist in further specification of a parametric model.
In non-parametric methods, parameters are not estimated, indeed descriptive analysis of the data are used, such as tables of survival. The advantage of using the non-parametric methods is the lack of restrictions on the model and they do not require the choice of a specific probability distribution. Moreover, there are some negative aspects of this methodology. Since they do not provide estimates of coefficients, there is no way to quantify the effect of covariates on survival time or the transition. Furthermore, there is no way to control the effect of a covariate by another and the conclusions may be incomplete or even misleading. However, the method can be useful for screening a large number of covariates prior to estimation of the regression models (Tomás, 2007).
According to Cameron & Trivedi (2005), considering the concept of the survival function, Kaplan-Meier estimator can be defined as follows:
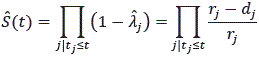 (4)
(4)
where  is hazard function,
dj is the number of spells ending at time tj and rj is the risk of failure at
time t-j that is before time tj.
is hazard function,
dj is the number of spells ending at time tj and rj is the risk of failure at
time t-j that is before time tj.
3.3 Database
The database used in this study comes from the micro-data from the Monthly Employment Survey (PME) collected by Brazilian Institute of Geography and Statistics (IBGE) for the period January 2004 to December 2013.
PME is obtained from a probability sample of approximately 40,000 households located in the Metropolitan Regions of Rio de Janeiro, São Paulo, Porto Alegre, Belo Horizonte, Recife, and Salvador. The basic objective of the survey is employment, adding some demographic and educational characteristics with the objective of enabling better understanding of this topic (Perez-Ribas & Dillon-Soares, 2008).
PME is a monthly household survey and follows a different methodology from other Brazilian household surveys. There is a scheme of rotation groups and panels where each sample household is interviewed for four consecutive months, then, it is excluded from the sample for eight consecutive months and reinserted for another period of four consecutive interviews, when it is finally excluded from the sample. The structure of the research makes possible to follow the same individual over a period of four consecutive months in the first and second interview (Dos-Santos-Queiroz et al., 2012).
An interesting aspect of PME is the fact that it makes possible the study of transitions, given the characteristic of being a panel data that follows each household during eight surveys. However, we have to underline the aspect that PME surveys household and not individuals, and, for this, it can happen that some individuals cannot be followed for eight months. That is, individuals change household during their life and so exit from the survey before the time or enter when it has already started. Thus, it can be affirmed that PME is an unbalanced or incomplete panel from the individual’s point of view.1
The PME does not report a code that allows identifying with certainty the same person at different times. To circumvent this problem, it is common to use some individual characteristics reported in the survey to identify the same person in two or more interviews. For doing it, this paper uses a pairing algorithm that is provided in Perez-Ribas & Dillon-Soares (2008).
Moreover, it is important to highlight that the sample used in this article consists of individuals over the age of 16.
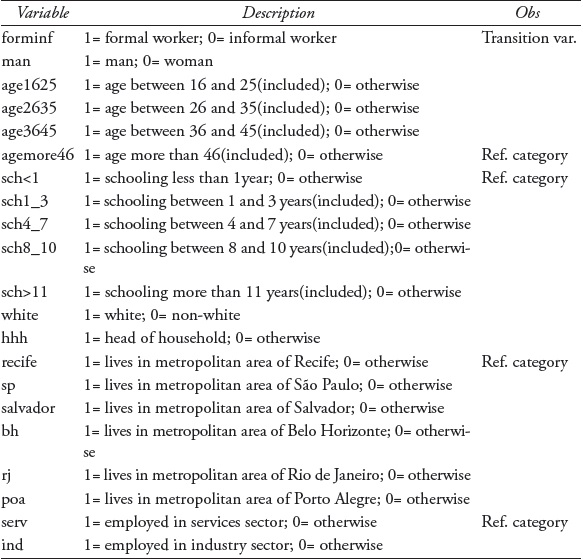
Regarding the characteristics of the workers, the following attributes for analysis of the transition from informality to formality were selected: sex, ethnicity, household head, age, schooling, metropolitan area, and economic sector.
Table A1 in appendix gives a description of the selected variables. Table 2, below, shows descriptive statistics of the sample of workers that passed from informality to formality.
Table 2 Descriptive statistics

Source: own elaboration, pesquisa mensal de emprego (IBGE, 2004-2013).
According to this data, it can be noted that workers that passed from informality to formality during the time considered are on average more from male sex than from female sex. It is also important to note that the general data of the population considered in the survey indicate that women are more than men on average.
Means about ethnicity and being household head indicate that these characteristics seem to have a slight effect on transition from informality to formality. White individuals that experimented transition are slightly more on average than non-white individuals, while in the general data the two groups are equal on average. People that are household head transit less than others according to the data of transition group, but this fact may be due to a lower presence of individuals with this characteristic in the overall data.
According to age groups, individuals who transited more are those with an age comprised between 26 and 35 years, followed by those between 36 and 45. However, the most interesting data is about workers with 46 or more years, which have the lowest mean in the case of transition, while it is the more present group in the database according to the overall data.
Considering the level of schooling, it appears that having studied 11 years or more has a large effect on the transition from informality to formality. The two prior education groups (4 - 7 years and 8 - 10 years) have some effect, but not comparable with the last group. Moreover, the group of workers that studied 11 years or more has a larger mean in the case of transition than in the overall data.
The analysis of descriptive statistics continues considering metropolitan areas: São Paulo and Belo Horizonte are the metropolitan areas where on average more individuals transited from informal to formal jobs, but are also the cities with more individuals in the database; on the other side, Recife appears to be the city where this happened less.
Finally, the sector of services is on average the economic sector where transition occurred more on average during the time analysed. Also in this case, we have to remember that services is the sector with more presence in the general data.
4. Empirical results
Empirical results are presented using two categories of models: parametric and non-parametric. The goal is to complement the two models to increase, in this way, the power of explanation.
The time between January 2004 and December 2013 is expressed in (120) months.
4.1 Non-parametric models
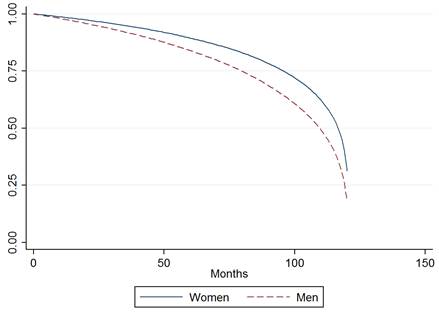
Figure 4, below, presents the estimation of the survival function of workers by sex. The data show that men have a lower probability than women to continue in informal sector for all months, especially after the beginning month and before the ending months.
Source: own elaboration - Pesquisa mensal de emprego IBGE (2004-2013).
Figure 4 Kaplan-meier survival estimates by sex
After 79 months, men have 75% of chances to remain informal, while women reach this level only after 95 months.
The biggest difference of probability between women and men is observed in the 117th month, where men have a probability to continue in informality of 31.20% while women of 45.26%, a difference of 14.06 percentage points. In the last month, men have a probability to remain in the informal sector of 31.30%, while women of 18.25%, a difference of 13.05 percentage points.
The successive analysis is about survival estimates by years of schooling, showed in Figure 5 below.

Source: own elaboration - Pesquisa mensal de emprego IBGE (2004-2013).
Figure 5 Kaplan-meier survival estimates by years of schooling
It is evident that passing from a group of fewer years of study to a group of more years leads to a reduction in the probability of a worker remaining in informal sector. The top curve describes the probability of individuals with less than one year of schooling, the curves below correspond to gradually more years of study, until the bottom curve that defines more than 11 years of education. In fact, workers with more than 11 years of schooling decrease the probability of remaining in informality by 25% after 70 months, while workers with 8 - 10 years after 82 months, workers with 4 - 7 years after 98 months, workers with 1 - 3 years after 109 months and workers with less than 1 year after 115 months.
Continuing in the same analysis, considering the reduction of chance by 50% we can observe that only workers with more than 3 years of schooling reach this level before the 120th month.
The next graph (Figure 6) shows the probability of surviving in informal sector by age. The most relevant aspect is the difference in the curves between the group of workers with age more than 45 (‘>46’) and the other groups of age. On the other hand, individuals more likely to exit informality are those belonging to 26-35 group and 36-45 group.

Source: own elaboration - Pesquisa mensal de emprego IBGE (2004-2013).
Figure 6 Kaplan-meier survival estimates by age
For example, the group ‘>46’ reaches probability of 75% only after 102 months, while the other groups achieve this level between the 60th and 74th month; moreover, this group of older workers achieves 50% of probability only at the penultimate month, whilst the other groups arrive at this point well before.
Figure 7, below, provides an analysis of survival probability by ethnicity. It can be easily perceived that there is no relevant difference between white and non-white workers; the curves follow almost the same path. According to this figure, it appears that ethnicity is an individual characteristic that has a small role in explaining the transition from informal to formal labour.

Source: own elaboration - Pesquisa mensal de emprego IBGE (2004-2013).
Figure 7 Kaplan-meier survival estimates by ethnicity
Figure 8 makes available Kaplan-Meier survival estimates by the condition of being or not being head of the household. It seems that being head of household can be considered a characteristic that explains the transition from informal to formal labour. For instance, an individual that is head of household reaches probability of 75% after 77 months, while other individuals come to this level after 94 months. A similar delay happens when we observe the probability of 50%: head of household reaches this level after 108 months, while other people after 116 months.

Source: own elaboration - Pesquisa mensal de emprego IBGE (2004-2013).
Figure 8 Kaplan-meier survival estimates by condition in the household
In the Figure 9, we can observe survival estimates by metropolitan cities. The metropolitan region of Recife appears to be the worst in comparison to the other metropolitan cities. In fact, the curve of Recife has a different path: considering the chance to remain informal of 75%, we can observe that a worker that lives in Recife reaches this level in the 97th month, while workers living in other metropolitan cities come to this probability between the 83rd and 91st month.

Source: own elaboration - Pesquisa mensal de emprego IBGE (2004-2013).
Figure 9 Kaplan-meier survival estimates by metropolitan cities
Finally, the last graph (Figure 10) is about survival estimates by sector of activity.

Source: own elaboration - Pesquisa mensal de emprego IBGE (2004-2013).
Figure 10 Kaplan-meier survival estimates by sector of activity
We can note that workers employed in the sector of services have the lowest probability to exit informality, while individuals employed in industry have the largest. Thus, it appears that the variables linked to the sector of activity have a role in increasing the chances of transition from informality to formality. The largest difference in the chances to remain informal can be noted in the centre of the graph, between the 50th and the 100th month.
4.2 Parametric models
In this section results obtained through parametric models of duration are presented and commented.
The regression is developed controlling the level of unemployment in each month in each metropolitan city and taking into account left and right censoring.
When we use parametric models, we should choose the probability distribution that fits best the variable of formality, given that the results may be biased if the distribution is not correct. To choose the best distribution that describes the variable of formality, the following methods can be used: a graphic method and AIC scores.
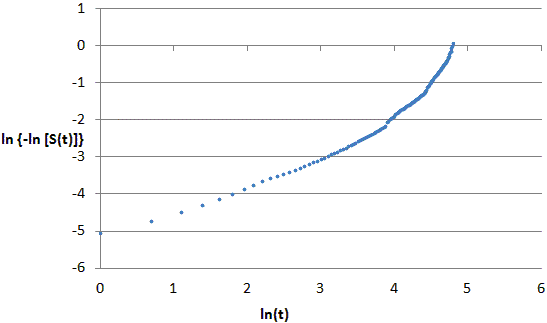
In the first method, to test the adequacy of the Weibull distribution and the exponential model, we build a graph with the value of in y-axis and the value of x-axis, where is the survival function obtained by the Kaplan-Meier method. According to Colosimo (2001), the Weibull distribution is most suitable if the graph obtained is approximately linear. If, in addition to linearity, the graph passes through the origin and has a slope equal to one, the best fit is given by the exponential distribution.
The graph (Figure 11) is prevalently linear, presenting no significant deviation. However, the other two conditions are not met, namely: passing through the origin and having a slope equal to one. Thus, according to the graphic method, it seems that the best distribution to be used in this case is Weibull.
Seeking to verify the accuracy of the graphical analysis, we also use the second method, that is, comparing AIC scores.
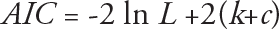
Akaike’s Information Criterion (AIC) is used to distinguish between different parametric models. Typically, models whose log-likelihood is small are preferred. Akaike’s method penalizes each model’s log likelihood to reflect the number of parameters that are being estimated and then compares them:
 (5)
(5)
where k is the number of model covariates and c is the number of model specific distributional parameters. Essentially, the method consists of a comparison between the AIC scores for different parametric models and the selection of the biggest one with the smallest AIC score (Jenkins, 2008).
The following Table 3 shows AIC scores for different parametric distribution according to the model of this paper.
Table 3 Aic scores
| Model | AIC |
|---|---|
| Exponential | 1,987,823 |
| Weibull | 1,563,169 |
| Gompertz | 1,783,905 |
| Log-normal | 1,902,837 |
| Log-logistic | 1,820,558 |
| Gamma | 1,766,411 |
Source: own elaboration - Pesquisa mensal de emprego IBGE (2004-2013).
According to Table 3, it can be affirmed that the Weibull distribution is the one which fits best. This result confirms the findings obtained by graphical analysis. Thus, the model with Weibull distribution for the survival time into informality is the one considered in the analysis.
Another issue that has to be addressed is about the presence of unobserved heterogeneity. One can estimate frailty models and test whether unobserved heterogeneity is relevant using likelihood ratio tests based on survival model with Gamma or Inverse-Gaussian correction and model without frailty correction. Both models yield a test statistics on the frailty variance that lead us to accept the null hypothesis that =0 in equation of section 3.1. This suggests that unobserved heterogeneity is not affecting our model.
Table 4 presents parametric results in the format of hazard ratios. Each value minus one provides the percentage change of each variable in the probability to transit to formal jobs, in comparison with the category of reference.
Table 4 Parametric results (hazard ratios)
| Variables | Hazard Ratios |
|---|---|
| man | 1.297 *** |
| sch<1 | Reference |
| sch1_3 | 4.048 *** |
| sch4_7 | 5.050 *** |
| sch8_10 | 6.362 *** |
| sch>11 | 8.760 *** |
| age1625 | 2.515 *** |
| age2635 | 3.018 *** |
| age3645 | 2.635 *** |
| agemore46 | Reference |
| white | 0.916 *** |
| hhh | 1.332 *** |
| recife | Reference |
| sp | 3.283 *** |
| salvador | 0.431 *** |
| bh | 10.878 *** |
| rj | 8.320 *** |
| poa | 15.973 *** |
| serv | Reference |
| ind | 2.145 *** |
| constant | 0.001 *** |
Significance levels: *10 percent, **5 percent, ***1 percent
Source: own elaboration - Pesquisa mensal de emprego IBGE (2004-2013).
It appears that if the individual is a man the probability of transition to formality is largest in comparison to a feminine individual. A male worker has 29.7% more probability to transit into the formal sector than a female worker.
Workers with an age between 16 and 25, between 26 and 35, and between 36 and 45 have more probability of transition than workers aged more than 46 (Table 4). The most relevant result is about the group of workers aged between 26 and 35 with a probability of transition of 201.8% larger than the group of workers aged more than 46 years.
However, the largest hazard ratios are those regarding schooling, in particular, for individuals with more than 11 years of education. Moreover, the more the years of schooling, the larger the hazard ratios are. For instance, having 11 years of schooling or more leads to an increase in the probability of transition to formality by 776.0%, in comparison to having less than 1 year.
Continuing with the analysis of the results, it can be noted that the variable white has little relevance to explaining transition to formality; the hazard ration in this case is very close to 1.
The next characteristic, being head of household, is slightly more relevant: workers with this characteristic have a probability to enter in a formal job increased by 33.2% than other workers.
Regarding metropolitan areas, all cities, with the exception of Salvador, have a larger probability of transition to formality than Recife (Table 4). It appears that the transition to formality is more difficult in Recife and Salvador, metropolitan cities of Northeast of Brazil, while very easy in Belo Horizonte and Porto Alegre, which show huge hazard ratios. The results relative to metropolitan cities are a network of unemployment in the region, given that it was controlled by level of unemployment of each metropolitan city.
The last variables provide the evidence that workers in the sector of industry seem to have a higher probability (114.5%) of transition to formality than workers in the sector of services.
Conclusions
Considering all the methods of analysis of this essay, some hypothesis about the transition from informal to formal sector can be made.
The level of education is a characteristic that seems to have a great effect on the transition from informality to formality. In fact, we observe that the probability to transit to formality increases according to the years of education.
Recent literature about this topic confirms these results. Barbosa-Filho et al. (2012) affirm that the fall of informality by 6.2% occurred between 2002 and 2009 is one of the successes of the policy of universalization of education in the country. Thus, from the public policy viewpoint, the more education will be stimulated, the larger the reduction of informality in Brazil will be.
Another group of variables that may have a big role in explaining transitions is that relative to metropolitan cities. Belo Horizonte, Rio de Janeiro, and Porto Alegre are the metropolitan areas where transition has a larger probability to happen than the others areas.
The sector of activity also has an important role in clarifying this type of transition. It appears that industry, being a sector where individuals are easily employed in the formality, has had a larger role in the reduction of informality in the period considered.
Age is a characteristic that appears to be significant in explaining transitions from informality to formality. In particular, we have to mention the importance of the age group between 26 and 35 years, which has the largest hazard ratio.
The variables relating to sex and head of household seem to have a lower effect than previous variables, but cannot be disregarded. In particular, hazard ratios are in agreement with our initial suppositions: men and heads of household have more probability to transit to formality than women and individuals with other positions in the household.
Finally, another important conclusion is that ethnicity appears to have almost no effect in explaining transition to formal job. The lack of effect of this variable may be explained by the fact that, when the level of education is controlled, the difficulties and the disadvantages that black and brown people suffer in the job market may disappear. Thus, in Brazil, the lack of opportunities that black and brown people have in the job market may be due mostly to their low levels of schooling, which is a consequence of inequality of opportunities to access educational system.